Upgrade to Pro — share decks privately, control downloads, hide ads and more …

Distributed Tracing: Understanding how your all your components work together

Distributed Tracing: Understanding how your all your components work together

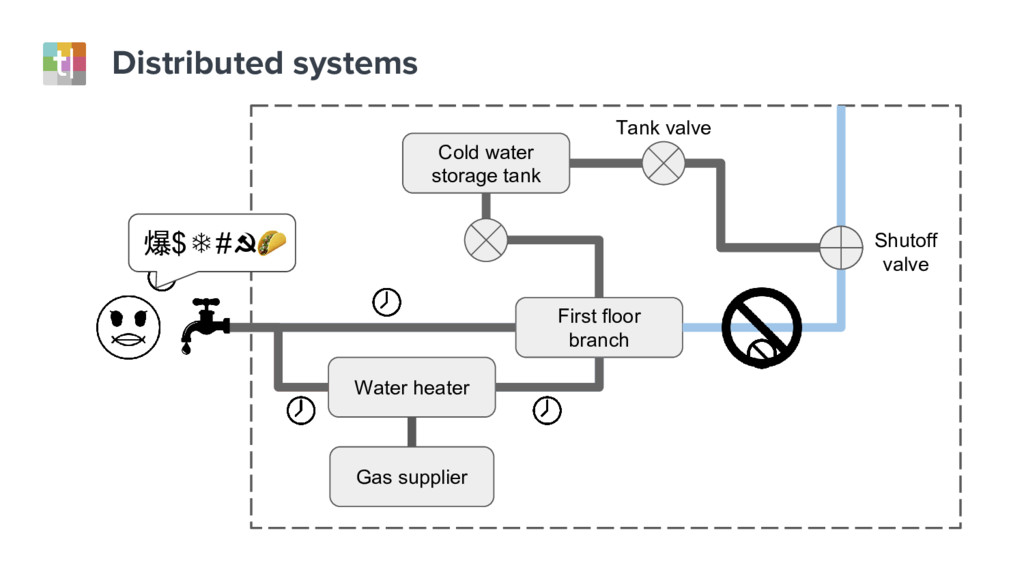
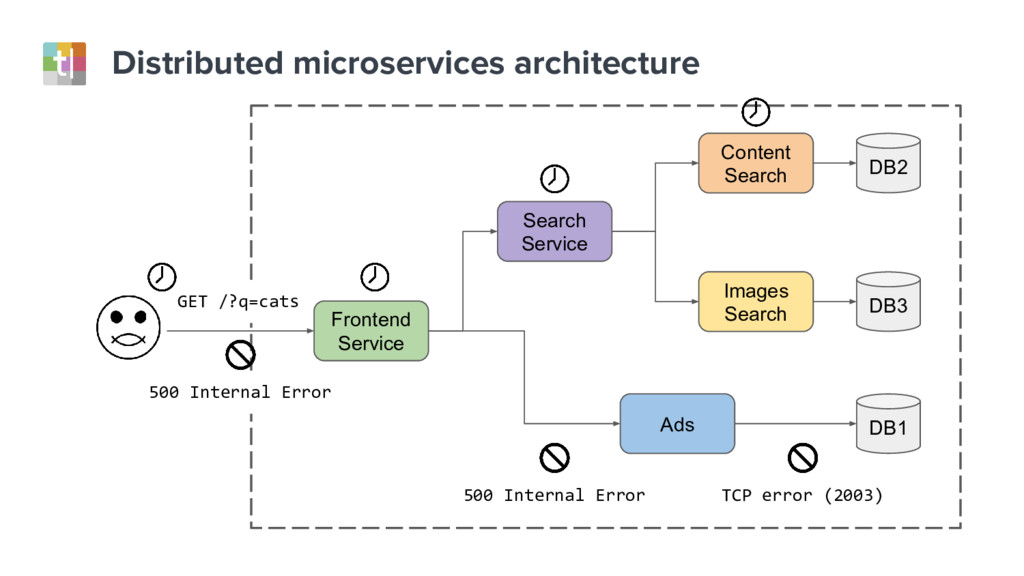
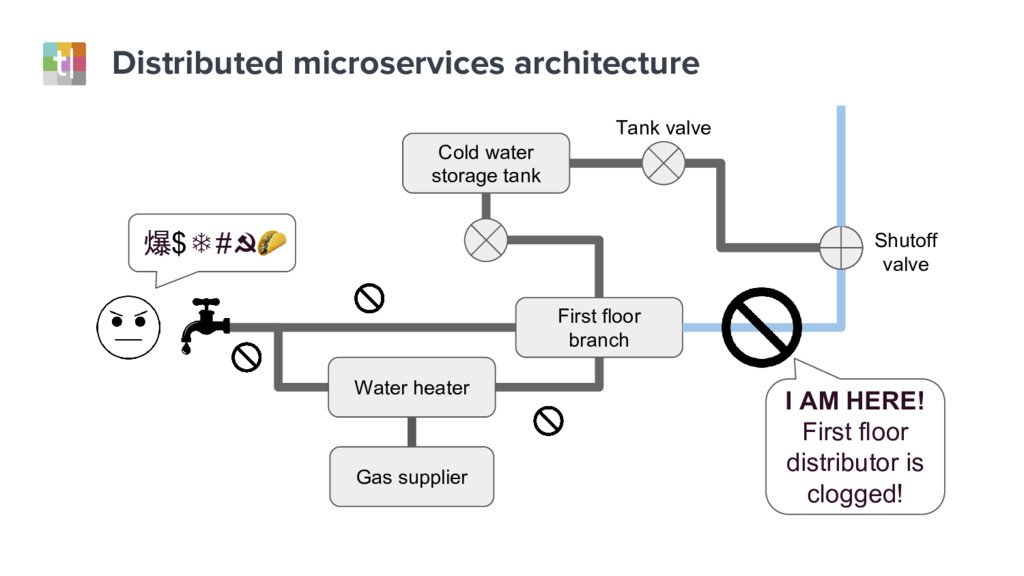
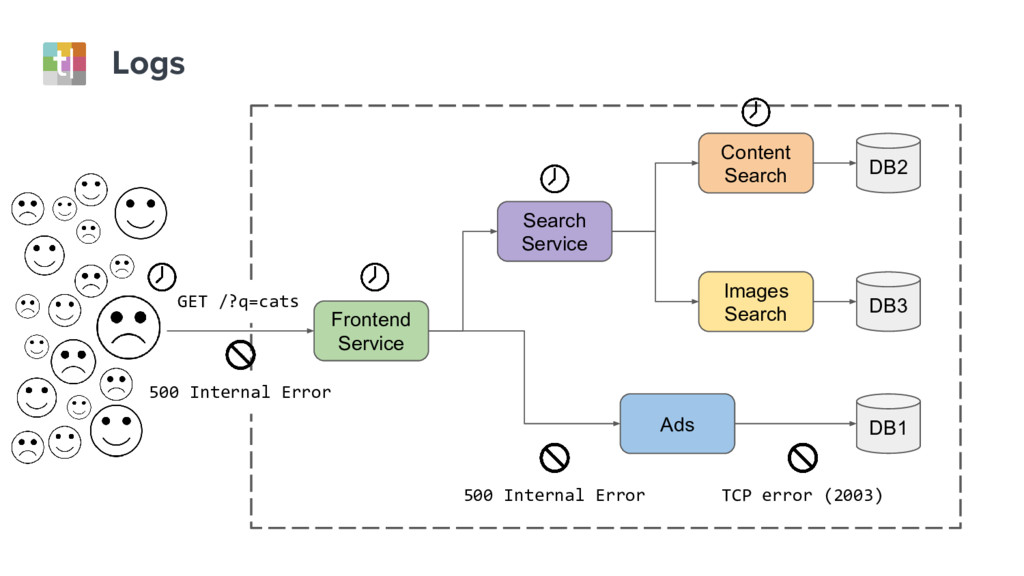
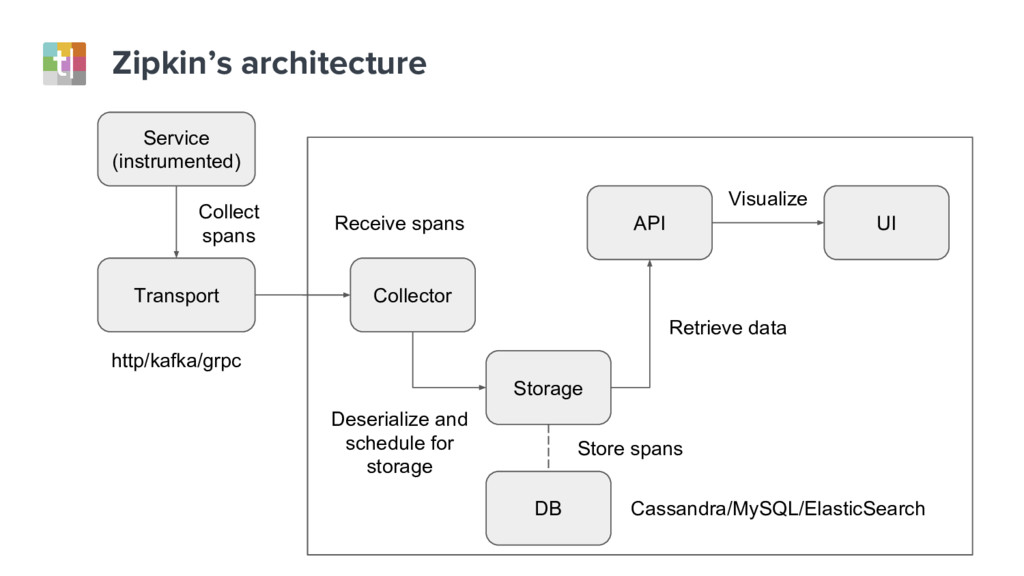
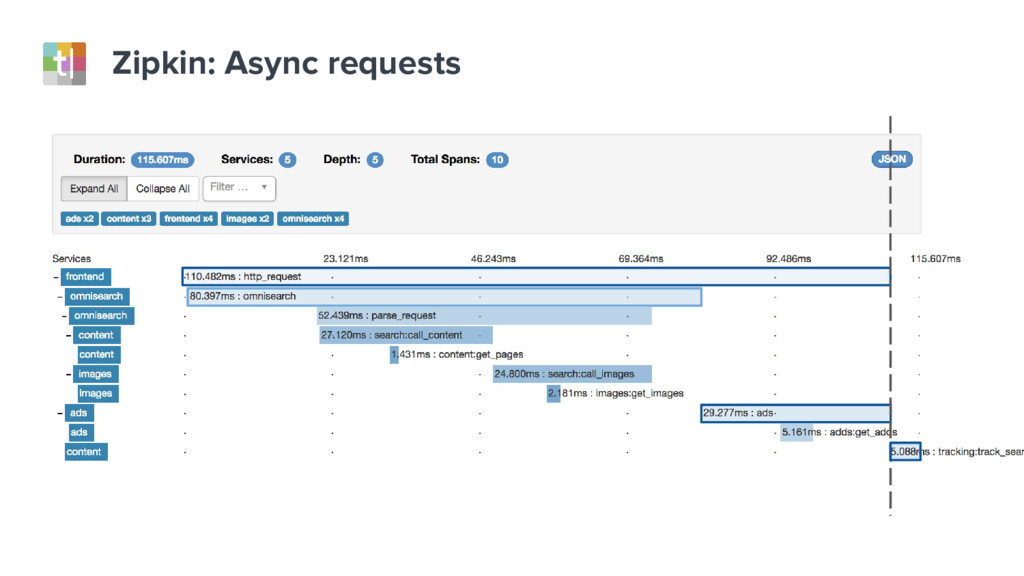
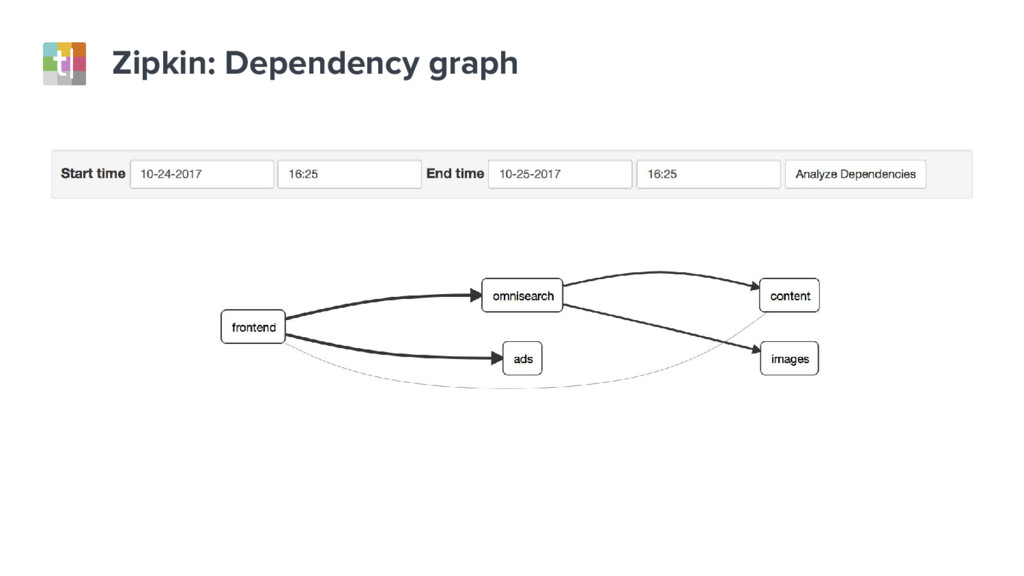
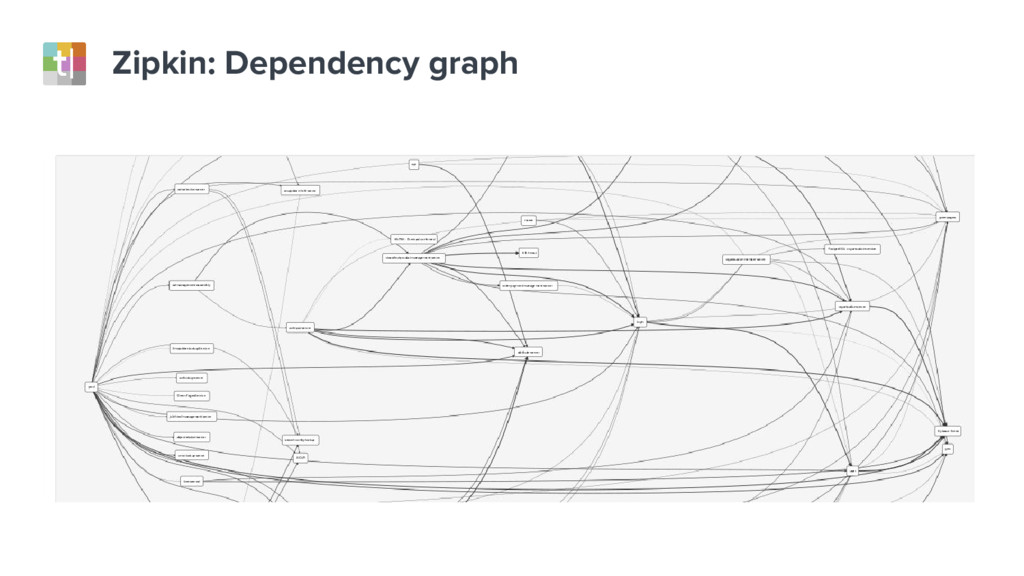
Understanding system failures traditionally starts with looking at a single component in isolation. However, this approach does not provide sufficient information with distributed services architectures. In these systems, end-user requests traverse dozens of components, and therefore a new approach is needed.

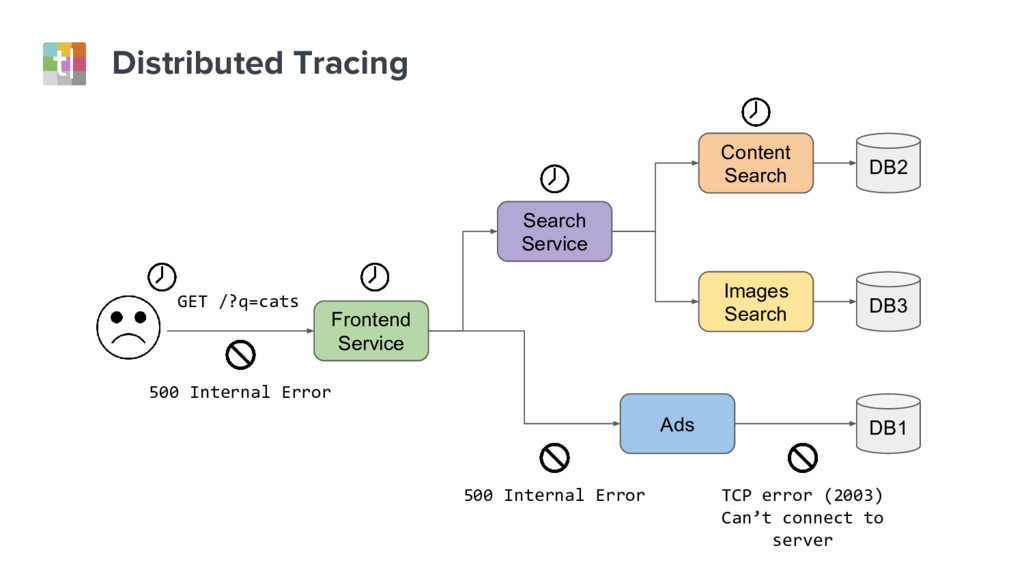
In this talk we’ll look at distributed tracing, which summarizes and contextualizes all sides of the story into a well-scoped and shared timeline. We’ll also look at distributed tracing tools, like Zipkin, which highlight the relationship between components, from the very top of the stack to the deepest aspects of the system.

José Carlos Chávez

November 15, 2017
Tweet

More Decks by José Carlos Chávez

Other Decks in Technology

Transcript

  1. Distributed Tracing
    How your systems work together

    View Slide

  2. About me
    José Carlos Chávez
    Software Engineer at Typeform
    focused on the responses
    services aggregate
    Open source contributor for
    Distributed Tracing projects
    @jcchavezs
    [email protected]

    View Slide

  3. Distributed systems

    View Slide

  4. Distributed systems
    A collection of independent components appears to its users as a
    single coherent system.
    Characteristics:
    → Concurrency
    → No global clock
    → Independent failures

    View Slide

  5. Distributed systems
    Water heater
    Gas supplier
    Cold water
    storage tank
    Shutoff
    valve
    First floor
    branch
    Tank valve
    爆$❄#☭

    View Slide

  6. Distributed microservices architecture
    Frontend
    Service
    Ads
    Content
    Search
    Images
    Search
    DB2
    DB3
    DB1
    TCP error (2003)
    500 Internal Error
    500 Internal Error
    Search
    Service
    GET /?q=cats

    View Slide

  7. Distributed microservices architecture
    Water heater
    Gas supplier
    Cold water
    storage tank
    Shutoff
    valve
    First floor
    branch
    Tank valve
    爆$❄#☭
    I AM HERE!
    First floor
    distributor is
    clogged!

    View Slide

  8. We do have that, it is called
    logs!

    View Slide

  9. Logs
    Frontend
    Service
    Ads
    Search
    Service
    Content
    Search
    Images
    Search
    DB2
    DB3
    DB1
    TCP error (2003)
    500 Internal Error
    500 Internal Error
    GET /?q=cats

    View Slide

  10. [24/Oct/2017 13:50:07 +0000] “GET / HTTP/1.1” 200 … **0/13548”
    [24/Oct/2017 13:50:07 +0000] “GET /omnisearch HTTP/1.1” 200 … **0/23948”
    [24/Oct/2017 13:50:08 +0000] “GET / HTTP/1.1” 200 … **0/12396”
    [24/Oct/2017 13:50:07 +0000] “GET /images HTTP/1.1” 200 … **0/23748”
    [24/Oct/2017 13:50:07 +0000] “GET /content HTTP/1.1” 200 … **0/23248”
    [24/Oct/2017 13:50:07 +0000] “GET /ads HTTP/1.1” 200 … **0/26548”
    [24/Oct/2017 13:50:07 +0000] “GET / HTTP/1.1” 200 … **0/13148”
    [24/Oct/2017 13:50:07 +0000] “GET / HTTP/1.1” 200 … **0/2588”
    [24/Oct/2017 13:50:07 +0000] “GET /ads HTTP/1.1” 500 … **0/3248”
    [24/Oct/2017 13:50:07 +0000] “GET /omnisearch HTTP/1.1” 200 … **0/23548”
    [24/Oct/2017 13:50:07 +0000] “GET /content HTTP/1.1” 200 … **0/22598”
    [24/Oct/2017 13:50:07 +0000] “GET /images HTTP/1.1” 200 … **0/13948”
    ...
    Logs
    ? ?

    View Slide

  11. Distributed Tracing to unclog
    your pipes

    View Slide

  12. Distributed Tracing
    → Understanding Latency issues across services
    → Identifying dependencies and critical paths
    → Visualizing concurrency
    → Request scoped
    → Complementary to other monitoring tools

    View Slide

  13. Distributed Tracing
    Frontend
    Service
    Ads
    Search
    Service
    Content
    Search
    Images
    Search
    DB2
    DB3
    DB1
    TCP error (2003)
    Can’t connect to
    server
    500 Internal Error
    500 Internal Error
    GET /?q=cats

    View Slide

  14. [24/Oct/2017 13:50:07 +0000] “GET / HTTP/1.1” 200 … **0/13548”
    [24/Oct/2017 13:50:07 +0000] “GET /omnisearch HTTP/1.1” 200 … **0/23948”
    [24/Oct/2017 13:50:08 +0000] “GET / HTTP/1.1” 200 … **0/12396”
    [24/Oct/2017 13:50:07 +0000] “GET /images HTTP/1.1” 200 … **0/23748”
    [24/Oct/2017 13:50:07 +0000] “GET /content HTTP/1.1” 200 … **0/23248”
    [24/Oct/2017 13:50:07 +0000] “GET /ads HTTP/1.1” 200 … **0/26548”
    [24/Oct/2017 13:50:07 +0000] “GET / HTTP/1.1” 200 … **0/13148”
    [24/Oct/2017 13:50:07 +0000] “GET / HTTP/1.1” 200 … **0/2588”
    [24/Oct/2017 13:50:07 +0000] “GET /ads HTTP/1.1” 500 … **0/3248”
    [24/Oct/2017 13:50:07 +0000] “GET /omnisearch HTTP/1.1” 200 … **0/23548”
    [24/Oct/2017 13:50:07 +0000] “GET /content HTTP/1.1” 200 … **0/22598”
    [24/Oct/2017 13:50:07 +0000] “GET /images HTTP/1.1” 200 … **0/13948”
    ...
    Logs

    View Slide

  15. Distributed Tracing
    FRONTEND
    SEARCH
    ADS
    CONTENT
    IMAGES
    Time
    [1508410470] error
    TCP (2003)
    500
    [1508410442] no cache for
    resource, retrieving from DB
    db_2_inst1
    error
    error

    View Slide

  16. Elements of Distributed Tracing
    → A trace shows an execution path through a distributed system
    → A context includes information that should be propagated
    across services
    → A span in the trace represents a logical unit of work (with a
    beginning and end)
    → Tags and logs (optional) add complementary information to
    spans.

    View Slide

  17. How propagation it works?
    Client /
    Producer
    Extract()
    Inject()
    Span 2
    Span 1
    Extract()
    TraceID: fAf3oXLoDS
    ParentID: ...
    SpanID: dZ0qHIBa1A
    Sampled: true
    ...
    TraceID: fAf3oXLoDS
    ParentID: dZ0qHIBa1A
    SpanID: oYa7m31wq5
    Sampled: true
    ...

    View Slide

  18. Benefits of Distributed Tracing
    → Effective monitoring
    → System insight, clarifies non trivial interactions
    → Visibility to critical paths and dependencies
    → Observe E2E latency in near real time
    → Request scoped, not request’s lifecycle scoped.

    View Slide

  19. What about overhead?
    → Observability tools are unintrusive
    → Sampling reduces overhead
    → Instrumentation can be delegated to common frameworks
    → (Don’t) trace every single operation

    View Slide

  20. Zipkin

    View Slide

  21. Zipkin
    → Distributed tracing tool
    → Based on Google Dapper (2010)
    → Created by twitter (2012)
    → Open source (2015)
    → Strong community

    View Slide

  22. Zipkin’s architecture
    Service
    (instrumented)
    Transport
    Collect
    spans
    Collector
    API UI
    Storage
    DB
    Visualize
    Retrieve data
    Store spans
    http/kafka/grpc
    Receive spans
    Deserialize and
    schedule for
    storage
    Cassandra/MySQL/ElasticSearch

    View Slide

  23. Zipkin

    View Slide

  24. Zipkin: Trace overview

    View Slide

  25. Zipkin: Tags & Logs

    View Slide

  26. Zipkin: Errors

    View Slide

  27. Zipkin: Async requests

    View Slide

  28. Zipkin: Dependency graph

    View Slide

  29. Zipkin: Dependency graph

    View Slide

  30. Thank you

    View Slide

  31. Q&A

    View Slide

  32. How is it different from logs?
    Credits: Peter Bourgon

    View Slide