Upgrade to Pro — share decks privately, control downloads, hide ads and more …

Do you want to measure your project?

Do you want to measure your project?

Lightning talk at FOSDEM.

FLOSS (free, libre, open source software) projects are usually developed in the open. A lot of information about their inner life is available in their development repositories: source code management (aka version control), issue tracking (aka bug reporting) systems, mailing lists, etc. This information can be organized and analyzed, and be used to gain understanding about how the project is performing, about the processes their developers are using, and in general about how it is evolving.

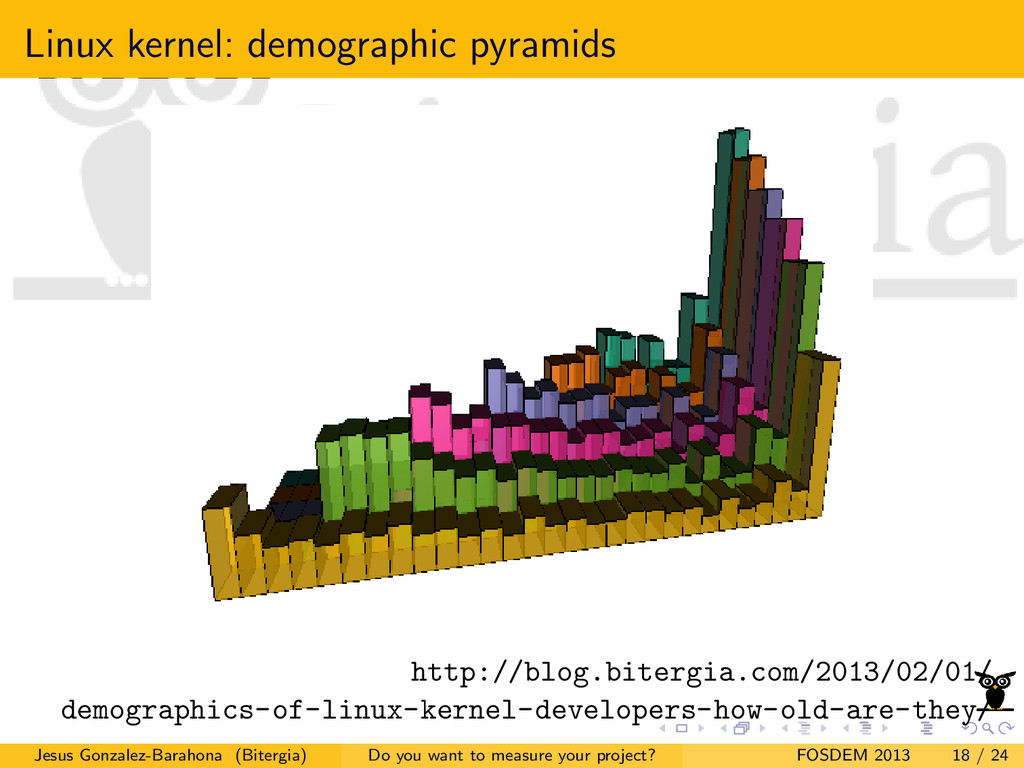
The kind of quantitative analytics that can be obtained from these repositories allow also for a direct tracking of several parameters that can characterize specific aspects of software development. The impact of changes in project policies or uses can therefore be evaluated quantitatively, and be observed in retrospective.

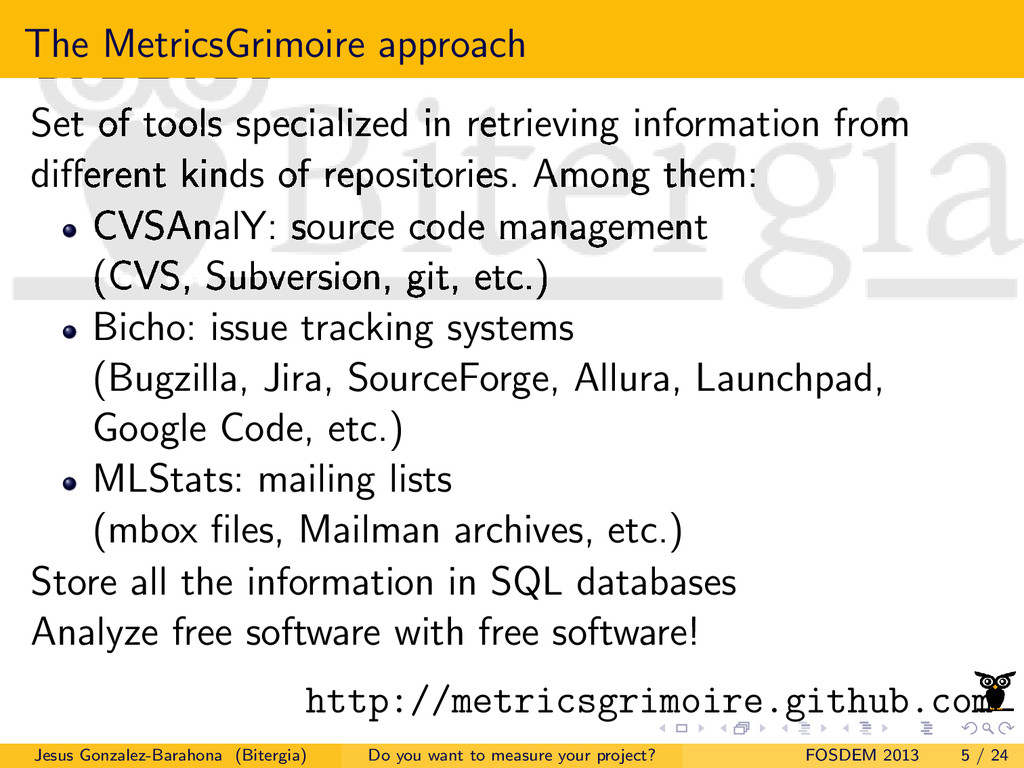
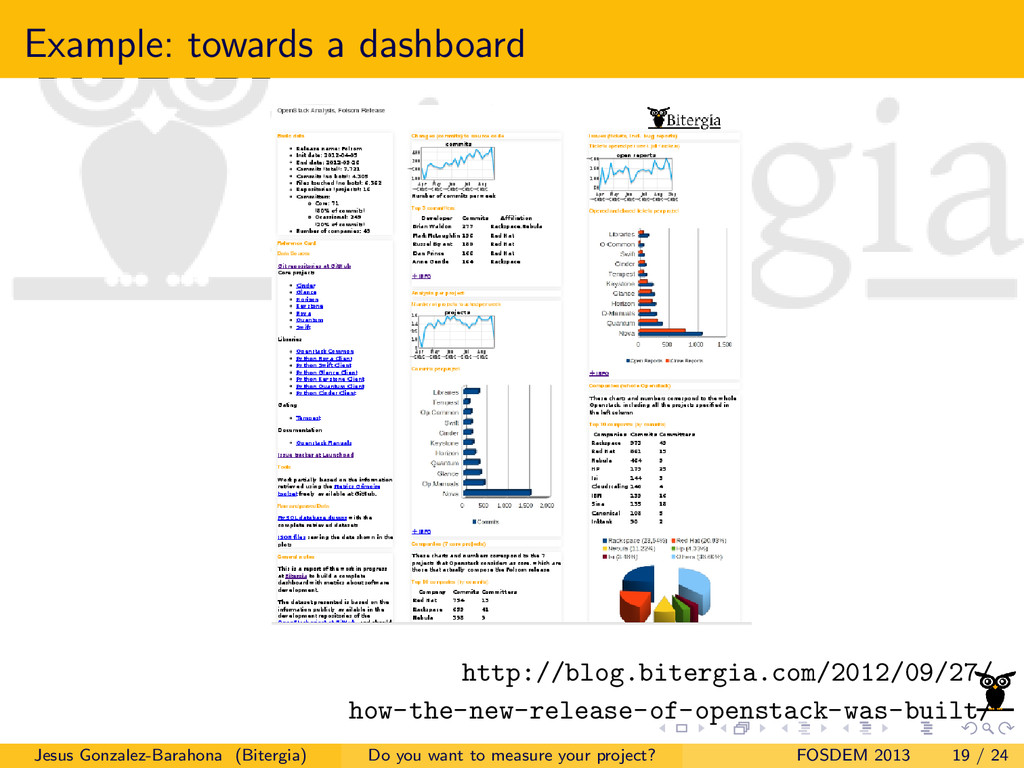
There are some websites that allow for some of these analysis, and some tools for supporting software development are also starting to offer some functionality along this line. But a more complete, holistic, flexible and customizable option is available: a set of free software tools that can extract information and metainformation from the most widely used kinds of software development repositories, store it in a database, and produce data and visualizations out of it. This talk will present it: the MetricsGrimoire toolset and its friends.

The MetricsGrimoire project provides a set of tools that can be used to analyze many kinds of software development repositories, from git or Subversion to Bugzilla, Jira or the SourceForge, GitHub and Launchpad issue trackers. Some related tools allow for different kinds of analysis and visualization of the retrieved data. Being all the tools free software, the limit for the kind of analysis and visualizations is only the imagination.

The talk will provide a detailed technical view of the tools (written mainly in Python), how they can be used and extended, and how we're using them to produce detailed analysis about several free software projects.

The main tools that will be introduced are:

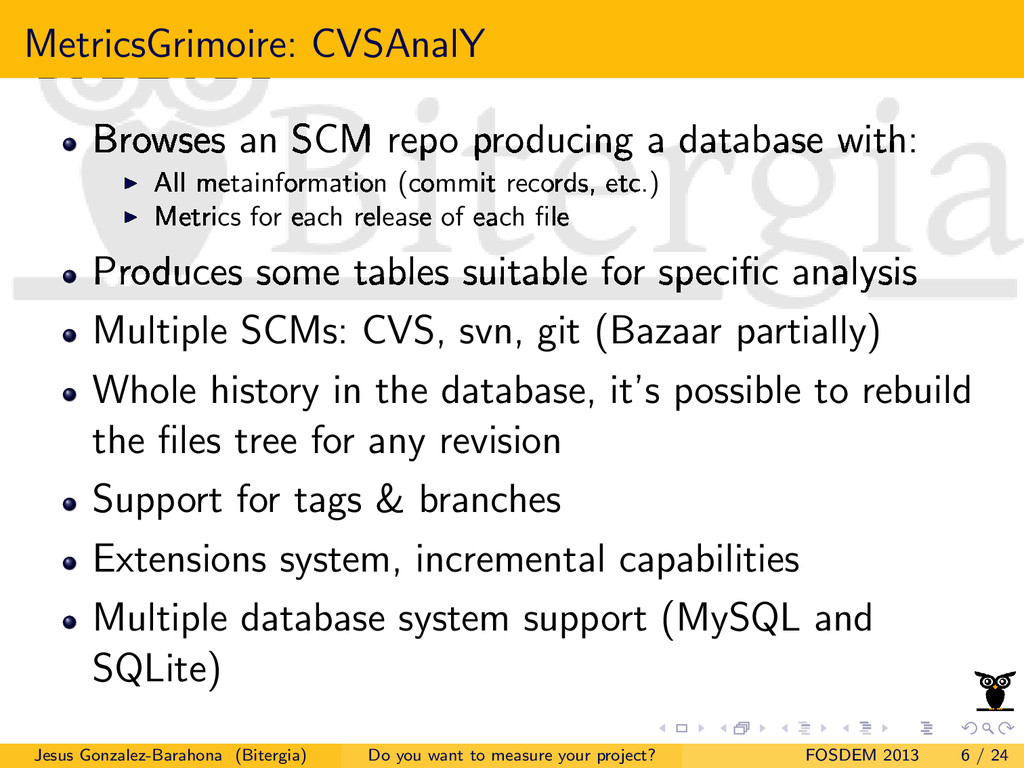
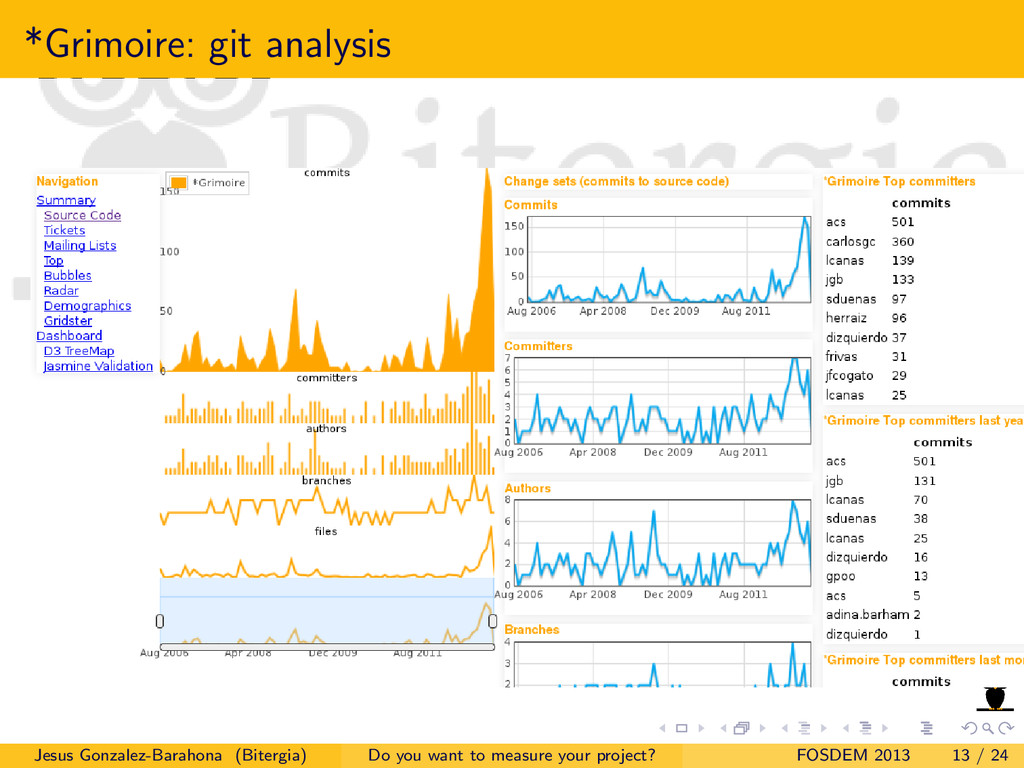
- CVSAnalY, which currently supports CVS, SVN and Git, while Bazaar and Mercurial are in the roadmap.
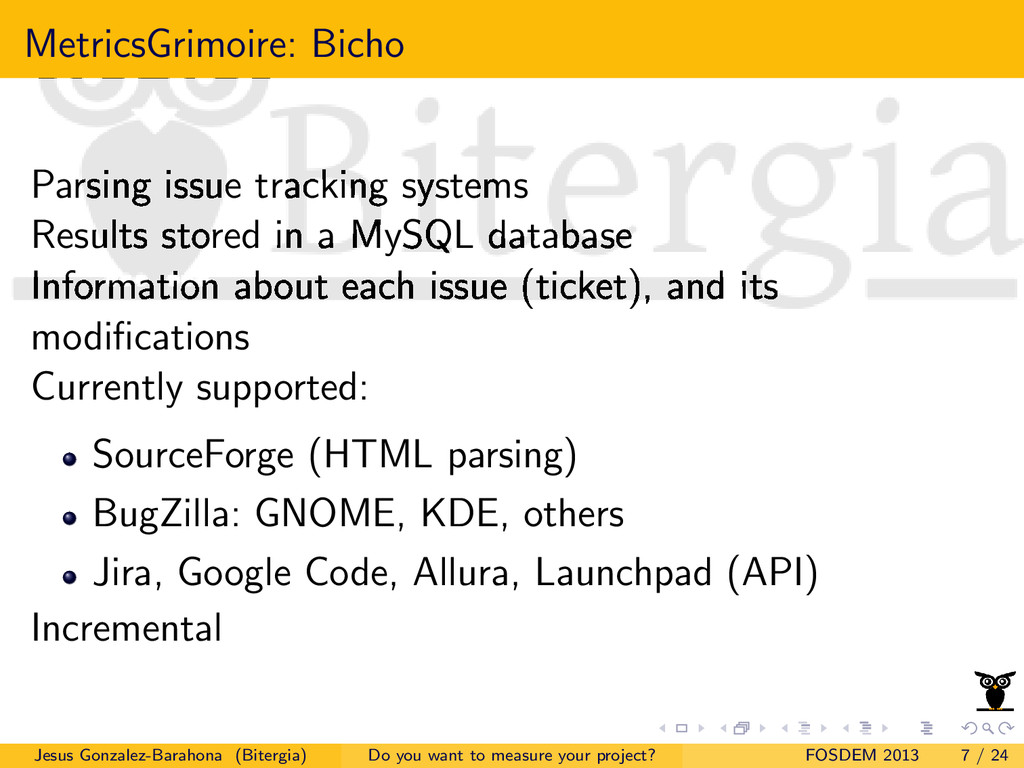
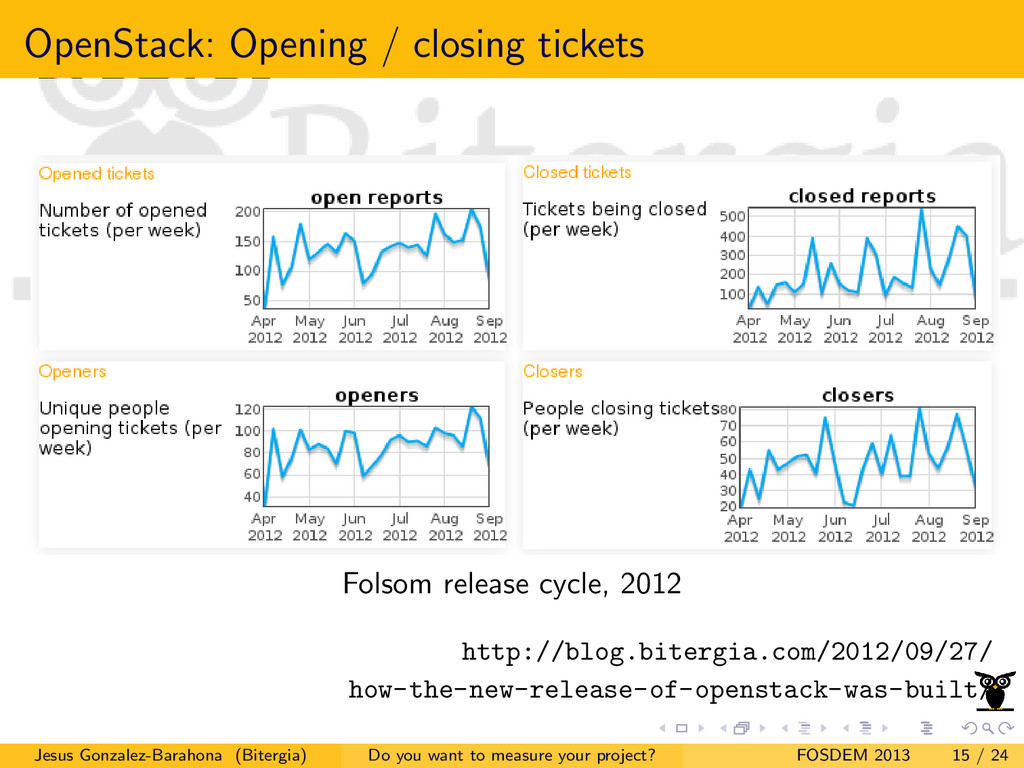
- Bicho, currently supporting Bugzilla and the Google Code, GitHub, Jira, Launchpad, and Allura trackers.
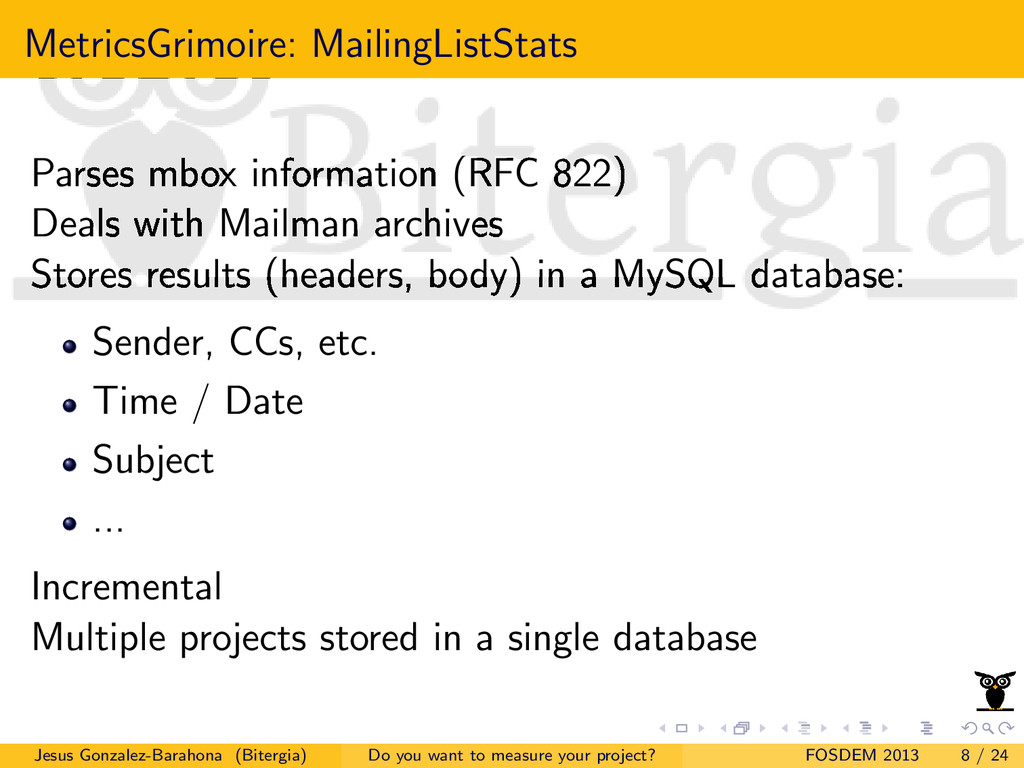
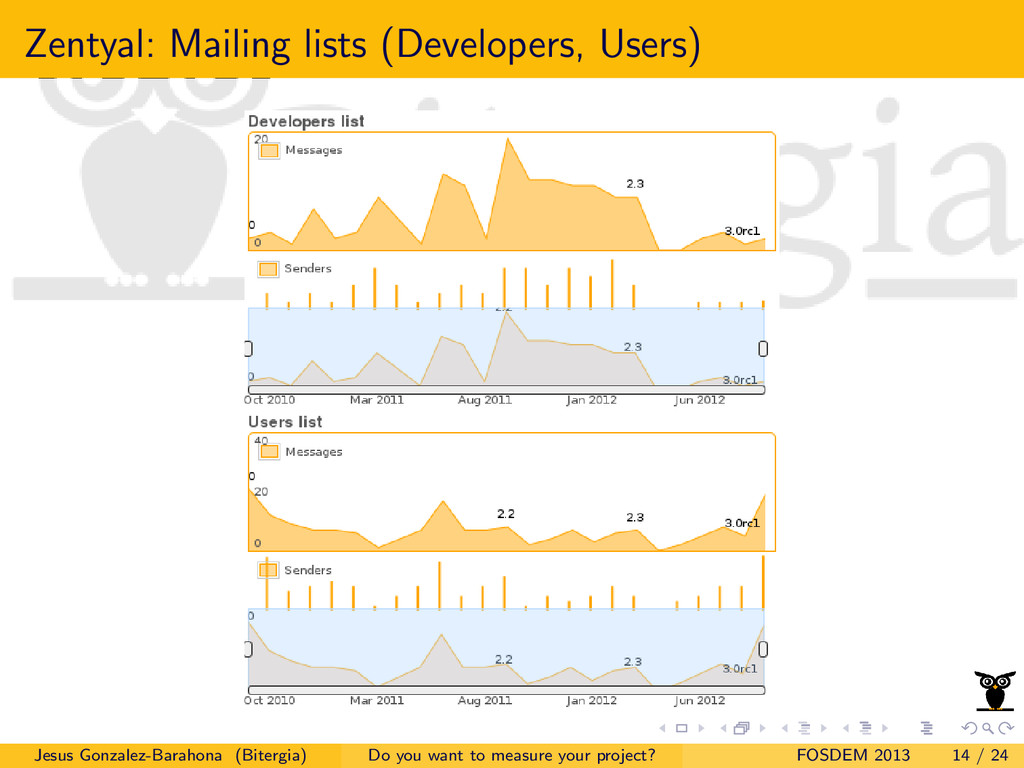
- MailingListStats, currently supporting files in mbox format and Mailman web-accesible archives.
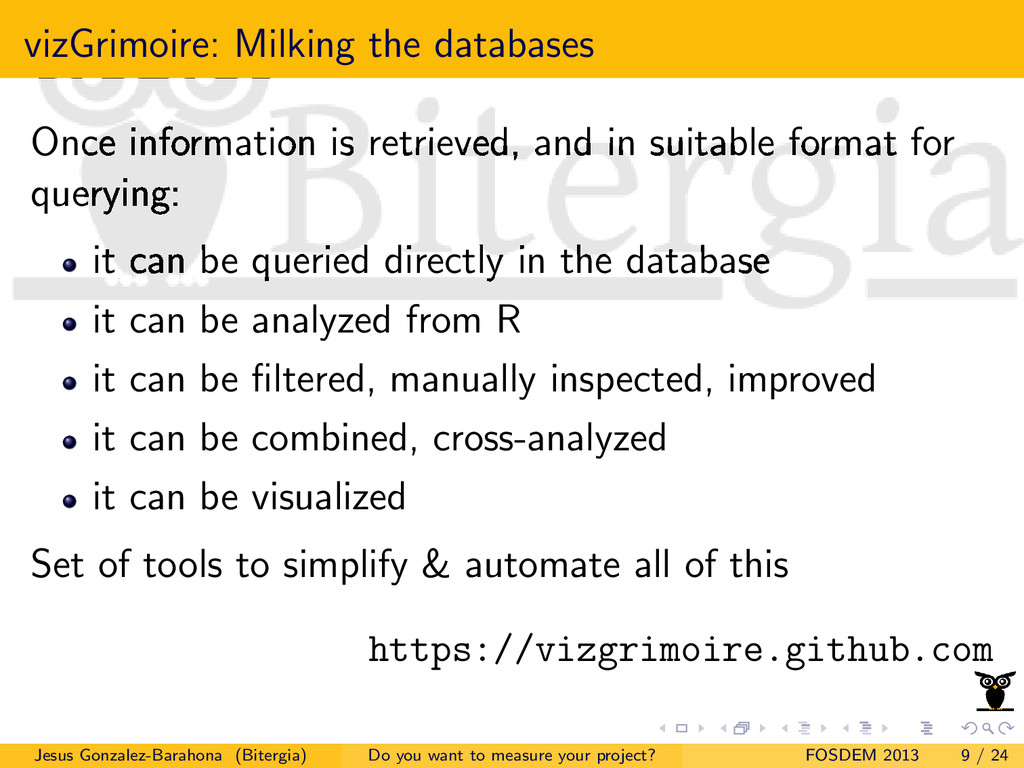
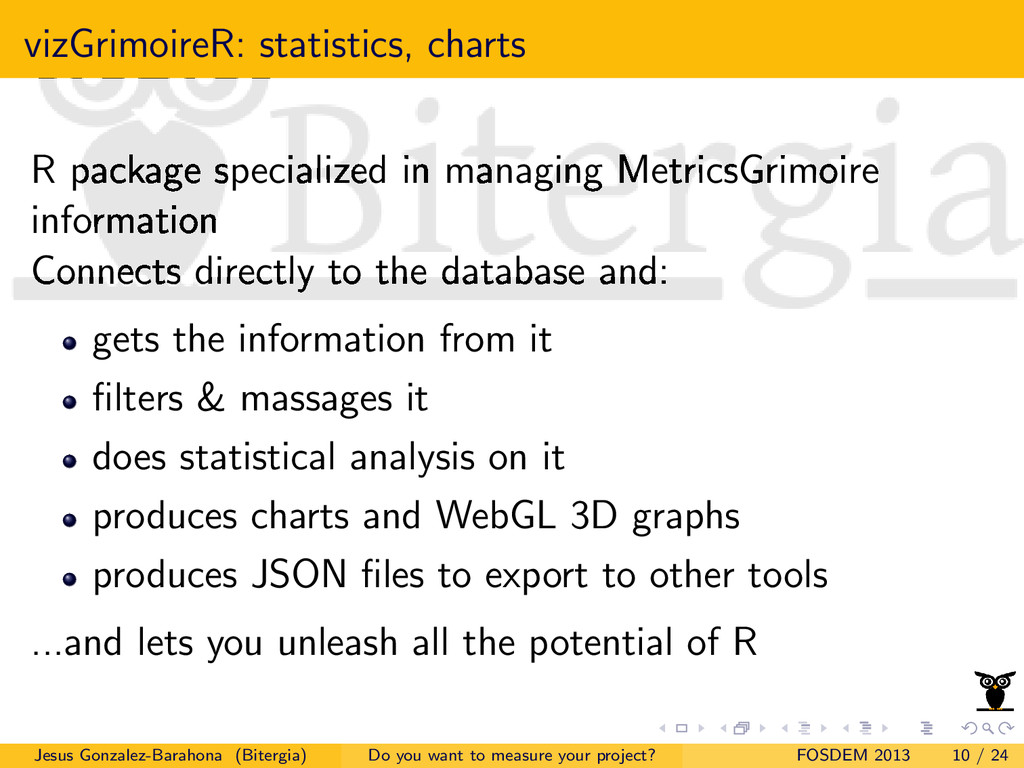
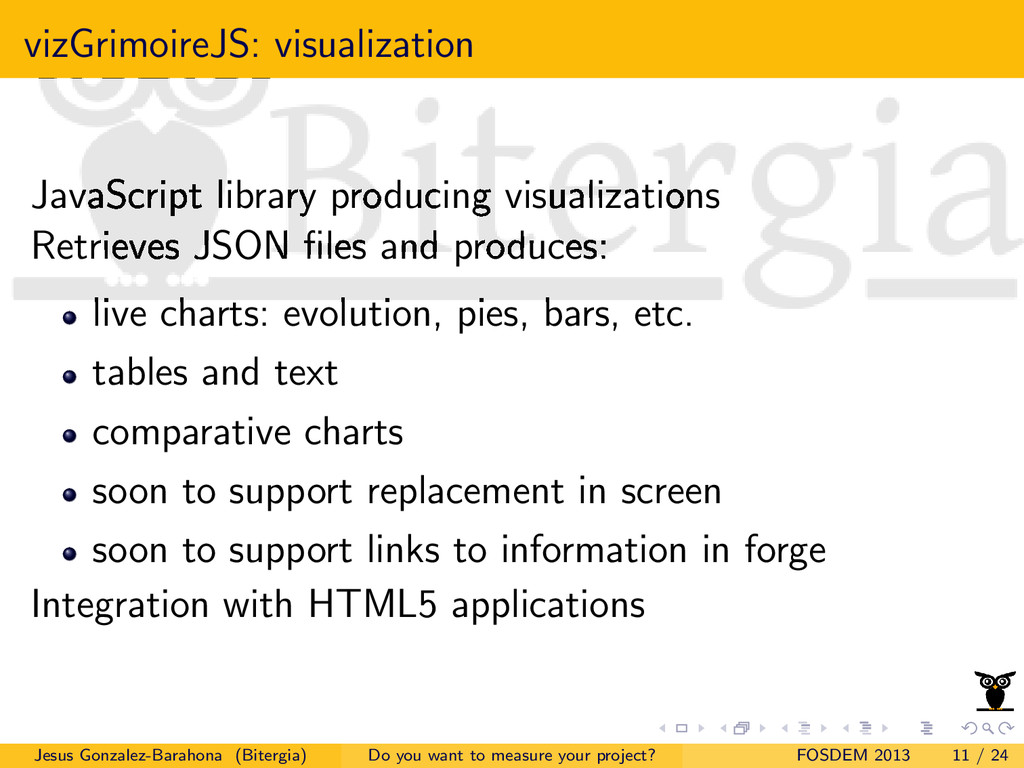
- VizGrimoire, a set of R scripts and JavaSript code to analyze and
visualize the databases produced by the former tools.

With all these tools working together, automatic and semi-automatic analysis of software development projects is possible, at least to a certain extent. Developers can tailor and adapt them to suit their specific needs, track the parameters they are interested in, and analyze the specific aspects of their pet projects that they may want.

Some questions that could be answered by this combined use of the tools
are:

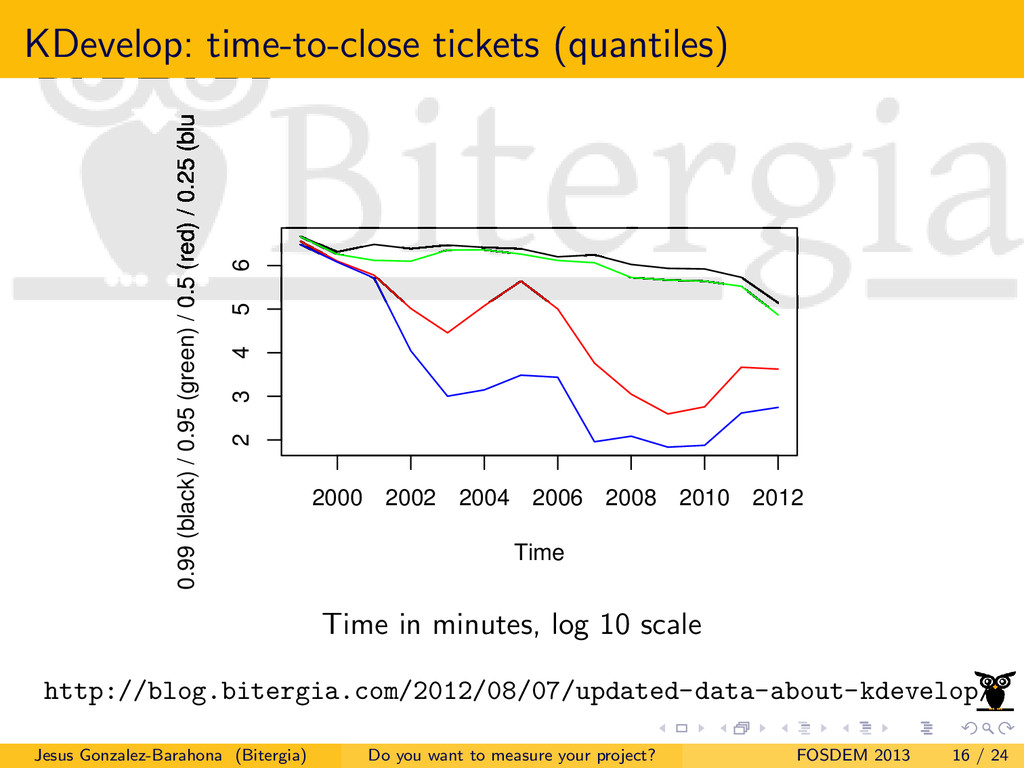
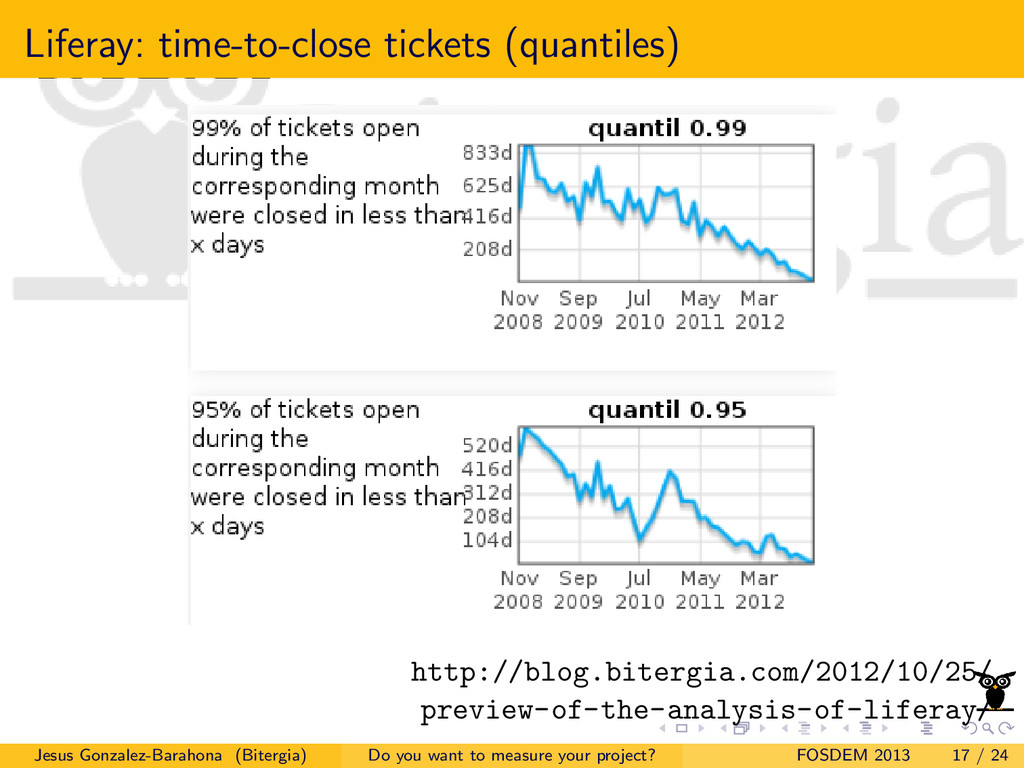
- How has evolved the time-to-fix for bug reports over the whole history of a project?
- Which companies are contributing to a project, and to which extent?
- How technical decisions affect attraction of new developers, time-to-attend for bug reports, or time to review changes to code?
- How can it be done a dynamic visualization of the evolution of a project?.

The talk will show how in fact it is easy to have answers to this questions, and will enter into the details of how to answer them, with plenty of practical examples of the analysis of real projects. Some insight about how to work on extensions and complementary tools will also be provided.

Jesus M. Gonzalez-Barahona

February 03, 2013
Tweet

More Decks by Jesus M. Gonzalez-Barahona

Other Decks in Programming

Transcript

  1. Do you want to measure your project? An introduction to

    MetricsGrimoire and vizGrimoire Jesus M. Gonzalez-Barahona [email protected] http://identi.ca/jgbarah http://twitter.com/jgbarah Bitergia GSyC/LibreSoft (Universidad Rey Juan Carlos) FOSDEM, Brussels, February 3rd, 2013 Jesus Gonzalez-Barahona (Bitergia) Do you want to measure your project? FOSDEM 2013 1 / 24
  2. c 2012, 2013 Bitergia Some rights reserved. This presentation is

    distributed under the “Attribution-ShareAlike 3.0” license, by Creative Commons, available at http://creativecommons.org/licenses/by-sa/3.0/ Jesus Gonzalez-Barahona (Bitergia) Do you want to measure your project? FOSDEM 2013 2 / 24
  3. Measuring, measuring, measuring Information about code, community, development for free

    / open source software projects can usually be retrieved, organized, analyzed Let’s do it! Jesus Gonzalez-Barahona (Bitergia) Do you want to measure your project? FOSDEM 2013 3 / 24
  4. Data has to be extracted, mined Data lives in repositories

    usually not designed to release it easily: tools are needed to retrieve and extract Data includes many complexities and details tools are needed to assist in mining, analysis Jesus Gonzalez-Barahona (Bitergia) Do you want to measure your project? FOSDEM 2013 4 / 24
  5. The MetricsGrimoire approach Set of tools specialized in retrieving information

    from different kinds of repositories. Among them: CVSAnalY: source code management (CVS, Subversion, git, etc.) Bicho: issue tracking systems (Bugzilla, Jira, SourceForge, Allura, Launchpad, Google Code, etc.) MLStats: mailing lists (mbox files, Mailman archives, etc.) Store all the information in SQL databases Analyze free software with free software! http://metricsgrimoire.github.com Jesus Gonzalez-Barahona (Bitergia) Do you want to measure your project? FOSDEM 2013 5 / 24
  6. MetricsGrimoire: CVSAnalY Browses an SCM repo producing a database with:

    All metainformation (commit records, etc.) Metrics for each release of each file Produces some tables suitable for specific analysis Multiple SCMs: CVS, svn, git (Bazaar partially) Whole history in the database, it’s possible to rebuild the files tree for any revision Support for tags & branches Extensions system, incremental capabilities Multiple database system support (MySQL and SQLite) Jesus Gonzalez-Barahona (Bitergia) Do you want to measure your project? FOSDEM 2013 6 / 24
  7. MetricsGrimoire: Bicho Parsing issue tracking systems Results stored in a

    MySQL database Information about each issue (ticket), and its modifications Currently supported: SourceForge (HTML parsing) BugZilla: GNOME, KDE, others Jira, Google Code, Allura, Launchpad (API) Incremental Jesus Gonzalez-Barahona (Bitergia) Do you want to measure your project? FOSDEM 2013 7 / 24
  8. MetricsGrimoire: MailingListStats Parses mbox information (RFC 822) Deals with Mailman

    archives Stores results (headers, body) in a MySQL database: Sender, CCs, etc. Time / Date Subject ... Incremental Multiple projects stored in a single database Jesus Gonzalez-Barahona (Bitergia) Do you want to measure your project? FOSDEM 2013 8 / 24
  9. vizGrimoire: Milking the databases Once information is retrieved, and in

    suitable format for querying: it can be queried directly in the database it can be analyzed from R it can be filtered, manually inspected, improved it can be combined, cross-analyzed it can be visualized Set of tools to simplify & automate all of this https://vizgrimoire.github.com Jesus Gonzalez-Barahona (Bitergia) Do you want to measure your project? FOSDEM 2013 9 / 24
  10. vizGrimoireR: statistics, charts R package specialized in managing MetricsGrimoire information

    Connects directly to the database and: gets the information from it filters & massages it does statistical analysis on it produces charts and WebGL 3D graphs produces JSON files to export to other tools ...and lets you unleash all the potential of R Jesus Gonzalez-Barahona (Bitergia) Do you want to measure your project? FOSDEM 2013 10 / 24
  11. vizGrimoireJS: visualization JavaScript library producing visualizations Retrieves JSON files and

    produces: live charts: evolution, pies, bars, etc. tables and text comparative charts soon to support replacement in screen soon to support links to information in forge Integration with HTML5 applications Jesus Gonzalez-Barahona (Bitergia) Do you want to measure your project? FOSDEM 2013 11 / 24
  12. (Simple) analytics of a project [Create databases cvsanalydb bichodb mlstatsdb]

    cvsanaly2 -u user -p XXX -d cvsanalydb \ --extensions=Months git_repo bicho -d 1 --db-user-out=user --db-password-out=XXX \ --db-database-out=bichodb github github_url mlstats --db-user user --db-password XXX \ --db-name mlstatsdb http://maiman/url git clone [email protected]:VizGrimoire/VizGrimoireJS.git cd VizGrimoireJS/browser/data/json [Fill in project-info-milestone0.json] R --vanilla --args cvsanalydb user XXX path/scm-milestone0.R R --vanilla --args cvsanalydb user XXX path/its-milestone0.R R --vanilla --args cvsanalydb user XXX path/mls-milestone0.R Now, export vizGrimoireJS via HTTP Jesus Gonzalez-Barahona (Bitergia) Do you want to measure your project? FOSDEM 2013 12 / 24
  13. OpenStack: Opening / closing tickets Folsom release cycle, 2012 http://blog.bitergia.com/2012/09/27/

    how-the-new-release-of-openstack-was-built/ Jesus Gonzalez-Barahona (Bitergia) Do you want to measure your project? FOSDEM 2013 15 / 24
  14. KDevelop: time-to-close tickets (quantiles) Time 0.99 (black) / 0.95 (green)

    / 0.5 (red) / 0.25 (blue) 2000 2002 2004 2006 2008 2010 2012 2 3 4 5 6 Time in minutes, log 10 scale http://blog.bitergia.com/2012/08/07/updated-data-about-kdevelop/ Jesus Gonzalez-Barahona (Bitergia) Do you want to measure your project? FOSDEM 2013 16 / 24
  15. Example: integration with the Alert project The project: mining the

    repositories of a project... ...to provide useful information to developers Eg: which bug reports could be of my interest Eg: tickets similar to a given ticket (likely dups) *Grimoire: MetricsGrimoire used to retrieve information from repos vizGRimoire used to provide a user interface based on charts http://alert-project.eu Jesus Gonzalez-Barahona (Bitergia) Do you want to measure your project? FOSDEM 2013 20 / 24
  16. In summary... Development repositories have a wealth of information We

    all can do our own analysis Free software to analyze free software development Let’s define common formats to interface to different tools We can incrementally develop a powerful platform What would you like to know about your pet project? Jesus Gonzalez-Barahona (Bitergia) Do you want to measure your project? FOSDEM 2013 21 / 24
  17. Bitergia: an spin-off Started operations in July 2012 Builds on

    the experience of LibreSoft R&D group Offering professional products and services Focused on: Metrics about software development (including community metrics) Specialized support for development forges (including metrics for projects) http://bitergia.com Jesus Gonzalez-Barahona (Bitergia) Do you want to measure your project? FOSDEM 2013 22 / 24
  18. Credits Thanks go to... Many LibreSoft developers who developed MetricsGrimoire

    The (small) community maintaining MetricsGrimoire Some Bitergia developers producing vizGrimoire The (future) community maintaining vizGrimoire The many free software developers that produced all the software on which these tools rely The many free software developers that produced all the software that gives us projects to analyze http://libresoft.es http://bitergia.com Jesus Gonzalez-Barahona (Bitergia) Do you want to measure your project? FOSDEM 2013 23 / 24
  19. This is the end, my friend Have you learned something

    useful? [I would love to know what interested you the most] [...and the least] Final note: You can use *Grimoire, contribute to *Grimoire Jesus Gonzalez-Barahona (Bitergia) Do you want to measure your project? FOSDEM 2013 24 / 24