Upgrade to Pro — share decks privately, control downloads, hide ads and more …

Leadership and Mileposts at Secondary

Avatar for Summit 2015 Summit 2015
June 02, 2015
21

Leadership and Mileposts at Secondary

This session is geared for school administrators or district-level administrators who want to unlock the potential in Mileposts to focus on student achievement and growth. Silverback Learning, with Mileposts, has created a powerful tool that allows administrators to “drill down” into the smallest pockets of student achievement data to make a difference in establishing personalized student learning goals.

Avatar for Summit 2015

Summit 2015

June 02, 2015

Transcript

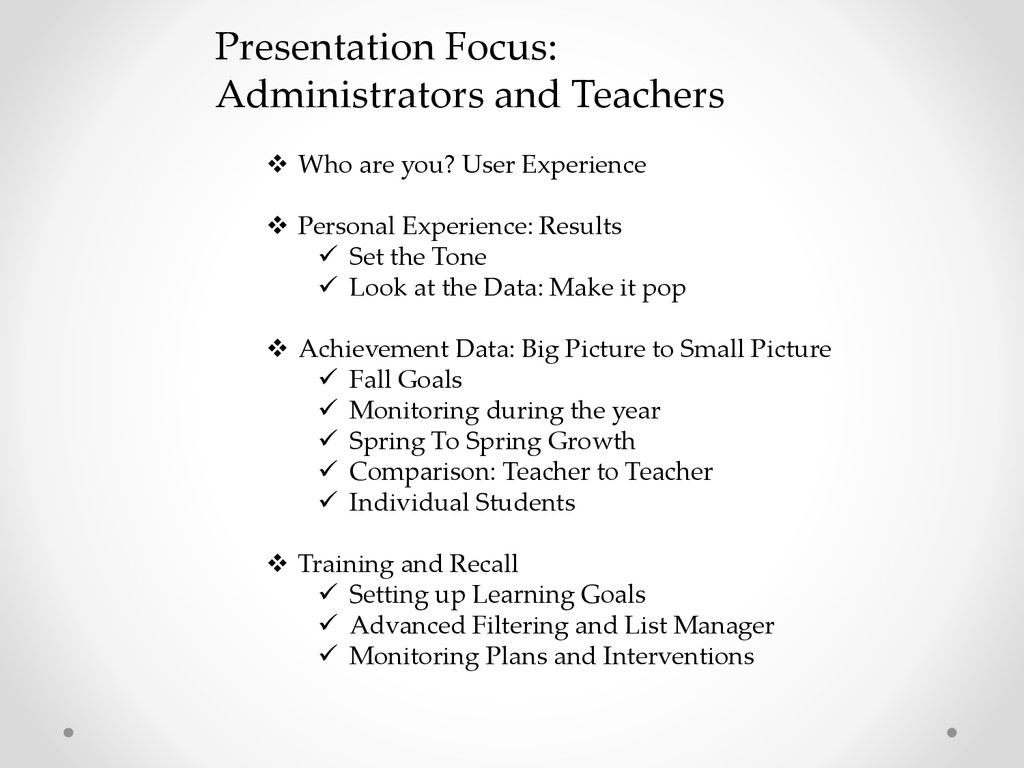
  1. Presentation Focus: Administrators and Teachers  Who are you? User

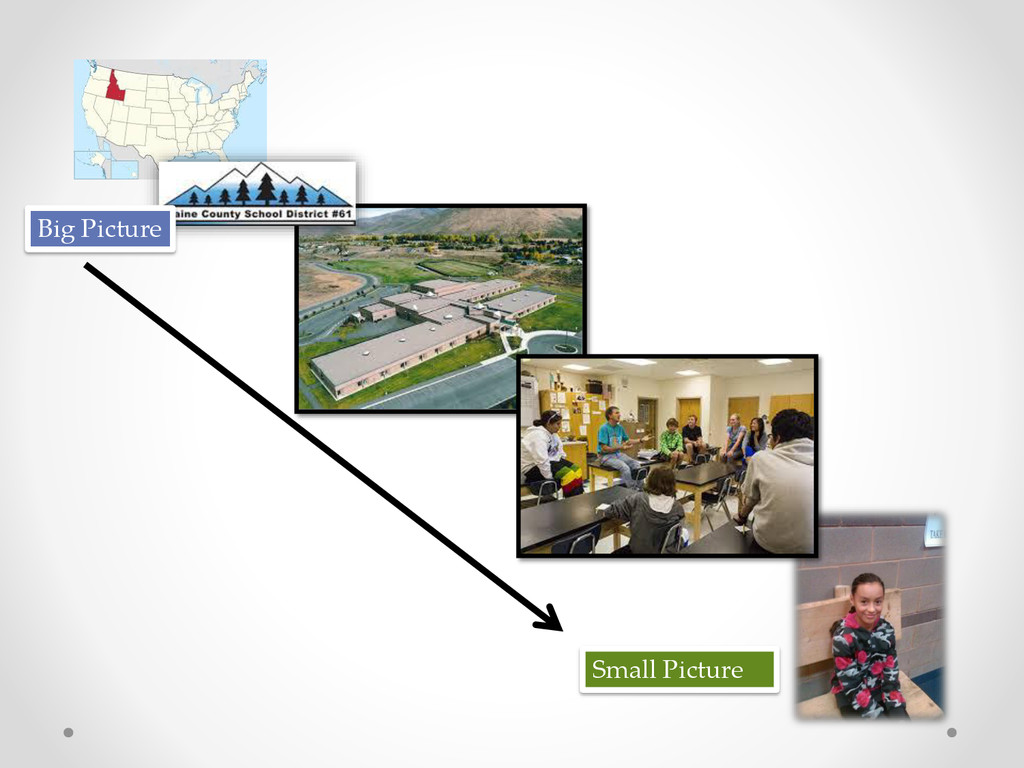
    Experience  Personal Experience: Results  Set the Tone  Look at the Data: Make it pop  Achievement Data: Big Picture to Small Picture  Fall Goals  Monitoring during the year  Spring To Spring Growth  Comparison: Teacher to Teacher  Individual Students  Training and Recall  Setting up Learning Goals  Advanced Filtering and List Manager  Monitoring Plans and Interventions
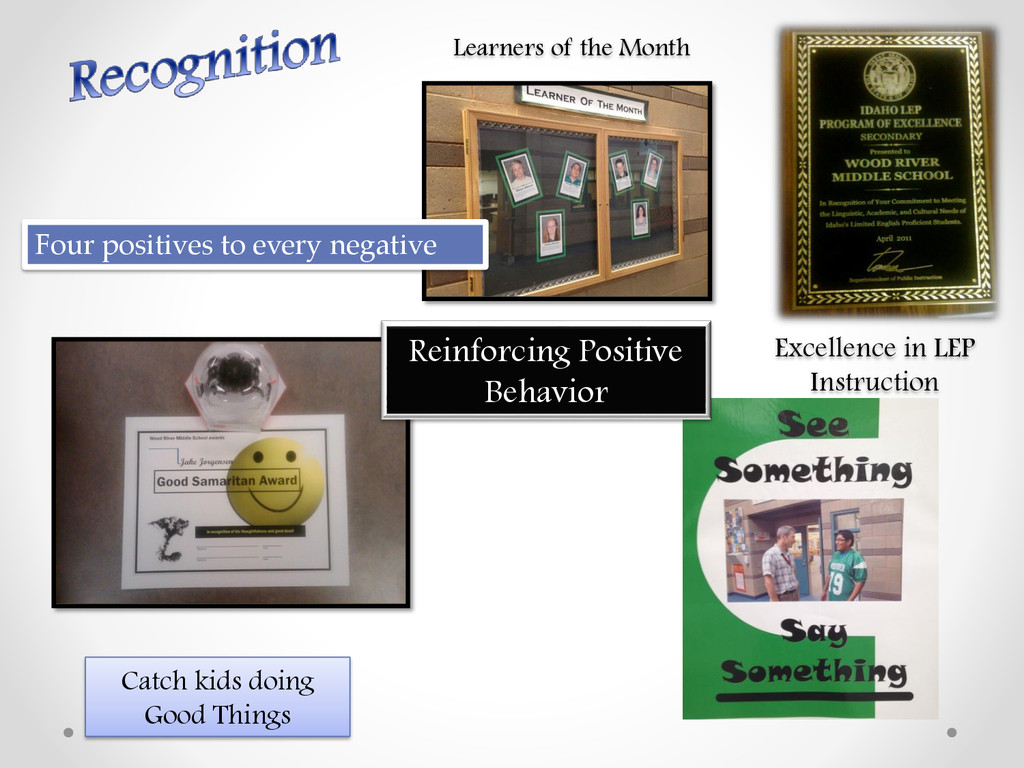
  2. Excellence in LEP Instruction Reinforcing Positive Behavior Catch kids doing

    Good Things Learners of the Month Four positives to every negative
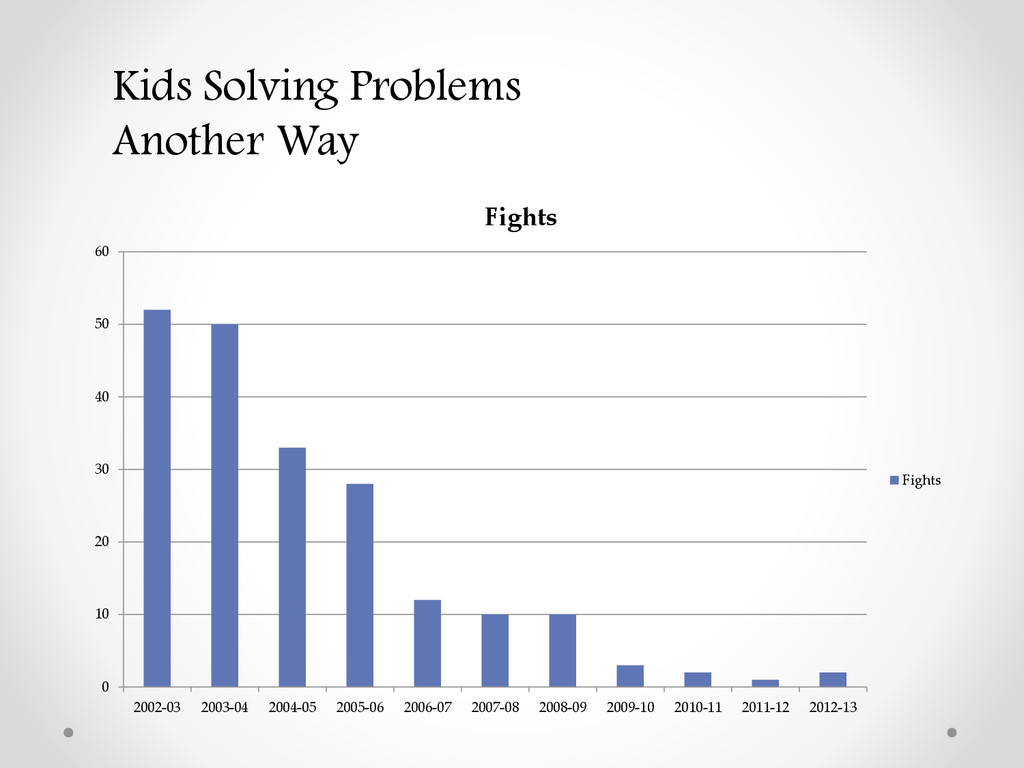
  3. 0 10 20 30 40 50 60 2002-03 2003-04 2004-05

    2005-06 2006-07 2007-08 2008-09 2009-10 2010-11 2011-12 2012-13 Fights Fights Kids Solving Problems Another Way
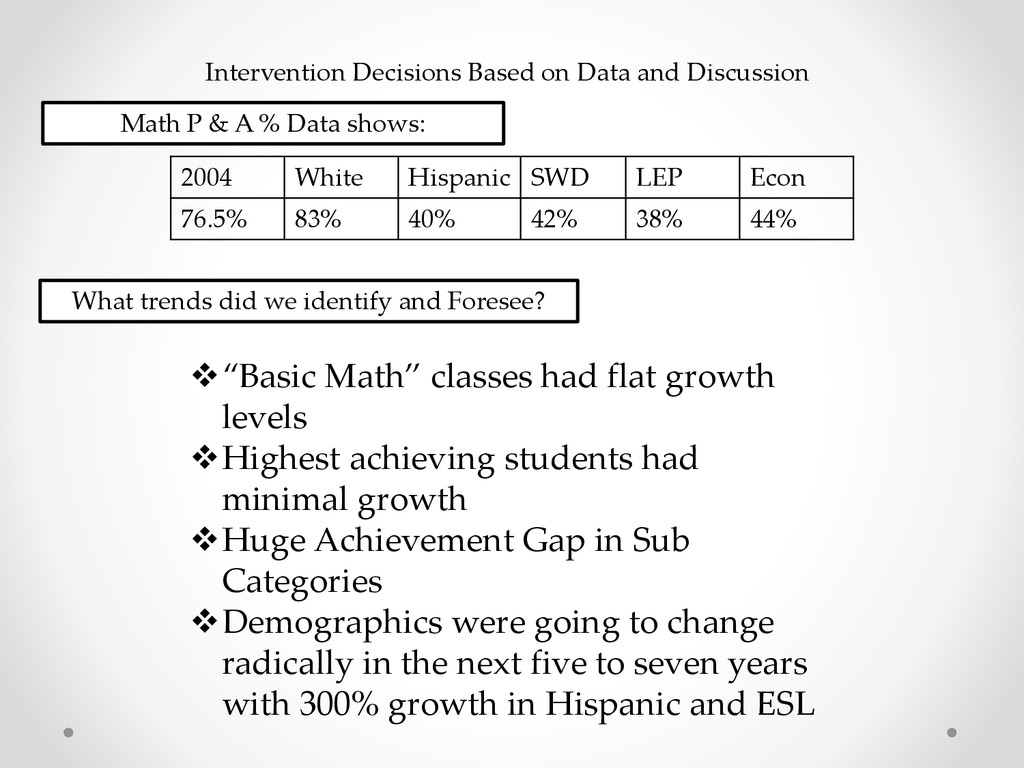
  4. Intervention Decisions Based on Data and Discussion Math P &

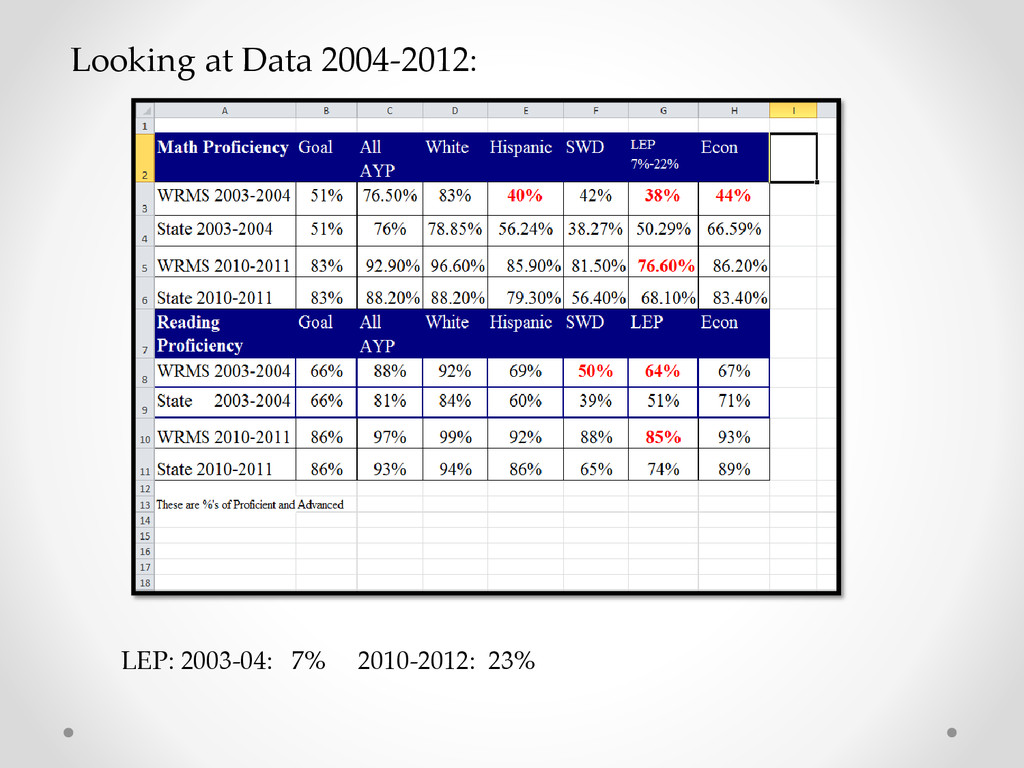
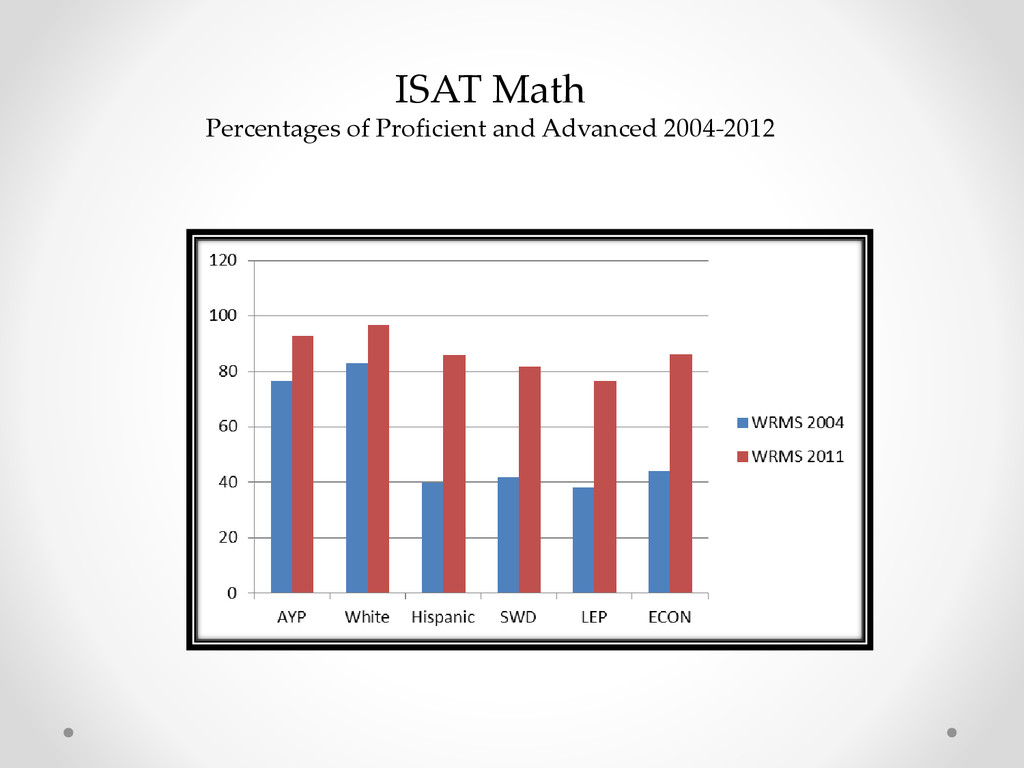
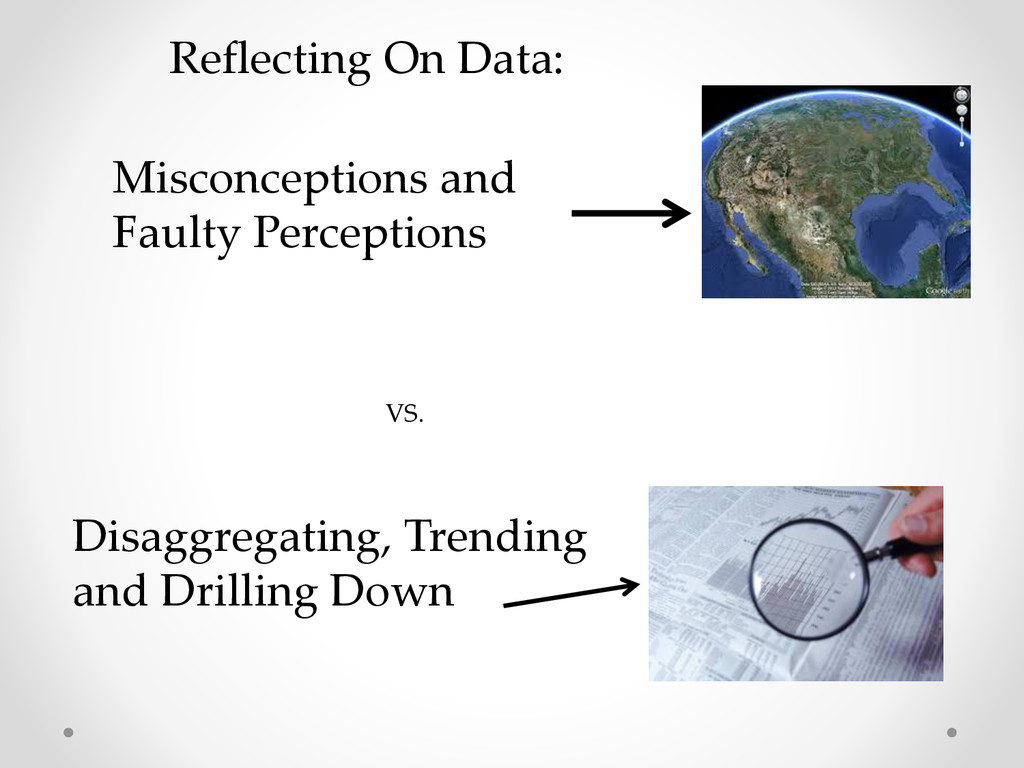
    A % Data shows: 2004 White Hispanic SWD LEP Econ 76.5% 83% 40% 42% 38% 44% What trends did we identify and Foresee? “Basic Math” classes had flat growth levels Highest achieving students had minimal growth Huge Achievement Gap in Sub Categories Demographics were going to change radically in the next five to seven years with 300% growth in Hispanic and ESL
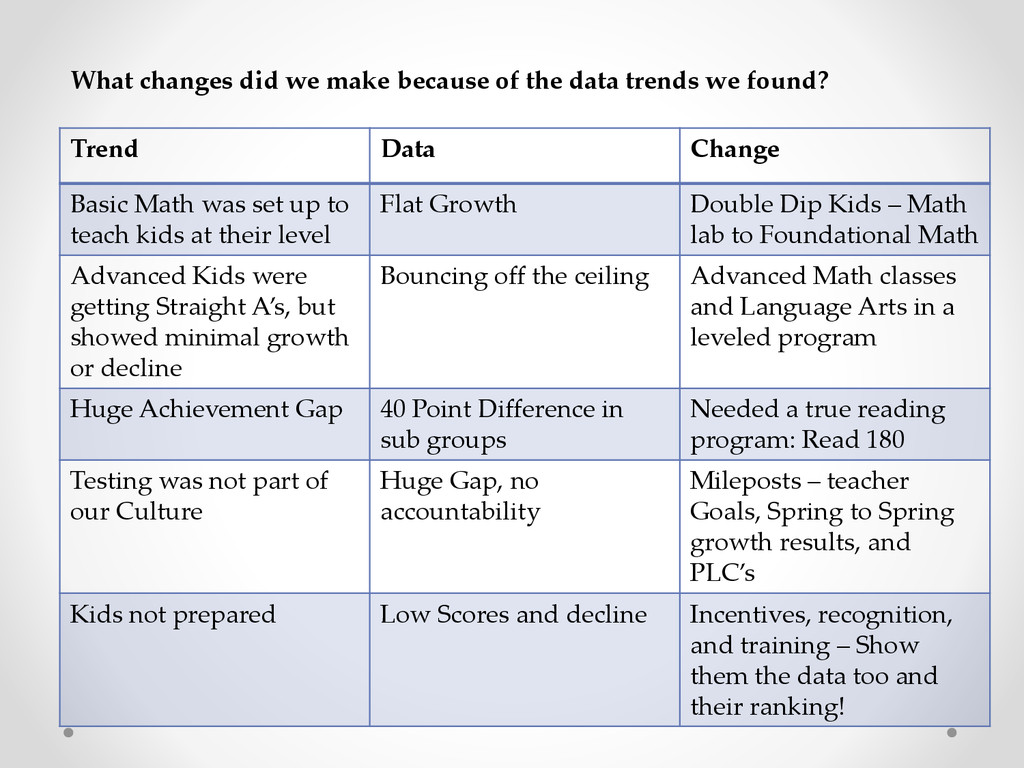
  5. What changes did we make because of the data trends

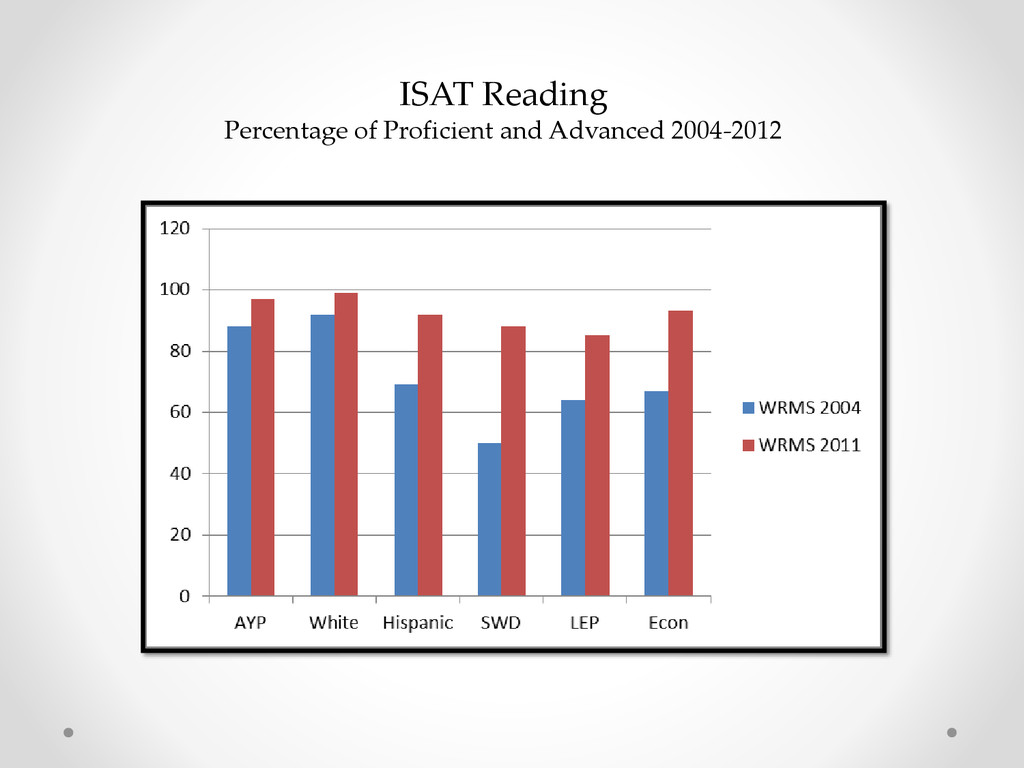
    we found? Trend Data Change Basic Math was set up to teach kids at their level Flat Growth Double Dip Kids – Math lab to Foundational Math Advanced Kids were getting Straight A’s, but showed minimal growth or decline Bouncing off the ceiling Advanced Math classes and Language Arts in a leveled program Huge Achievement Gap 40 Point Difference in sub groups Needed a true reading program: Read 180 Testing was not part of our Culture Huge Gap, no accountability Mileposts – teacher Goals, Spring to Spring growth results, and PLC’s Kids not prepared Low Scores and decline Incentives, recognition, and training – Show them the data too and their ranking!
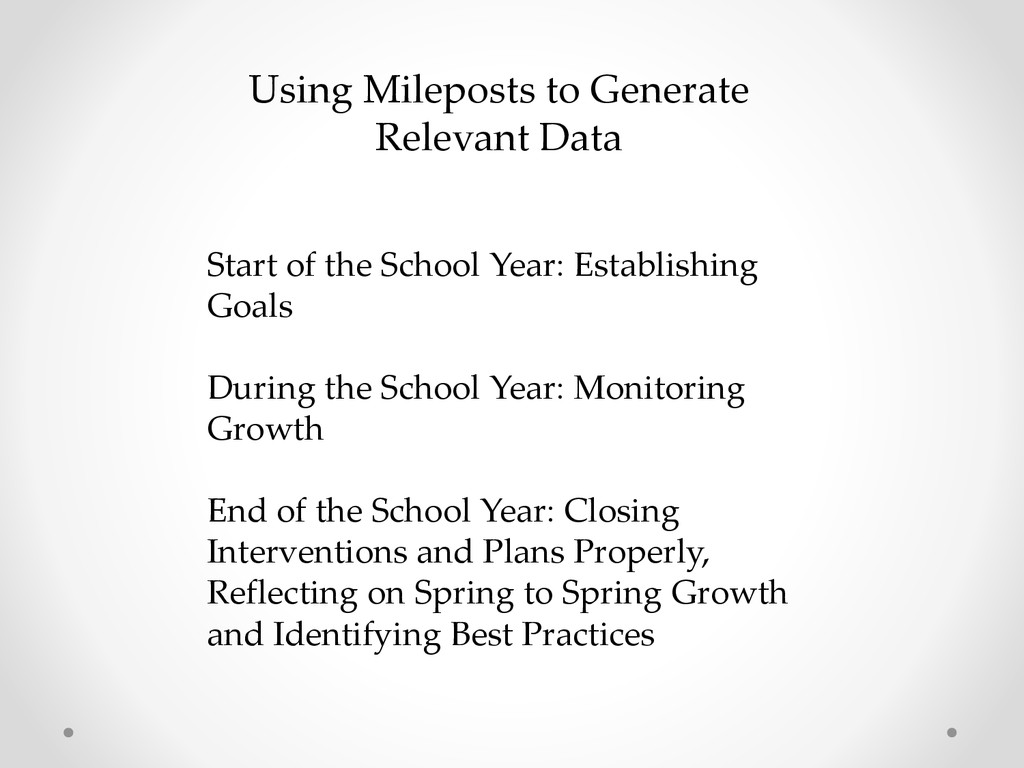
  6. Using Mileposts to Generate Relevant Data Start of the School

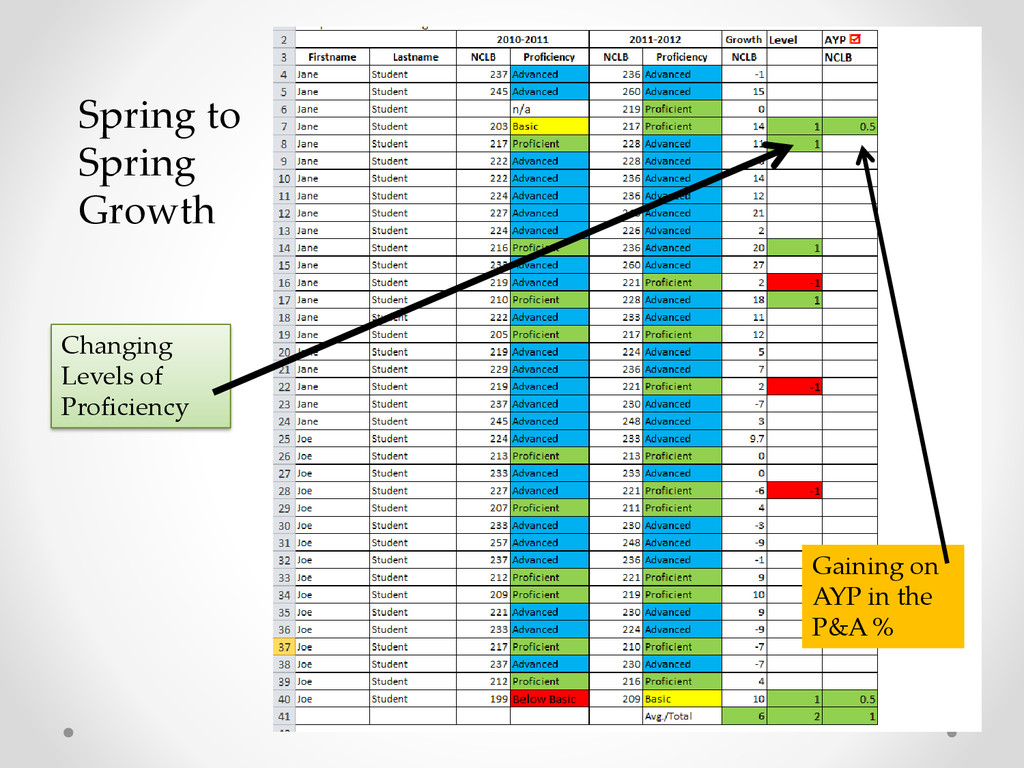
    Year: Establishing Goals During the School Year: Monitoring Growth End of the School Year: Closing Interventions and Plans Properly, Reflecting on Spring to Spring Growth and Identifying Best Practices
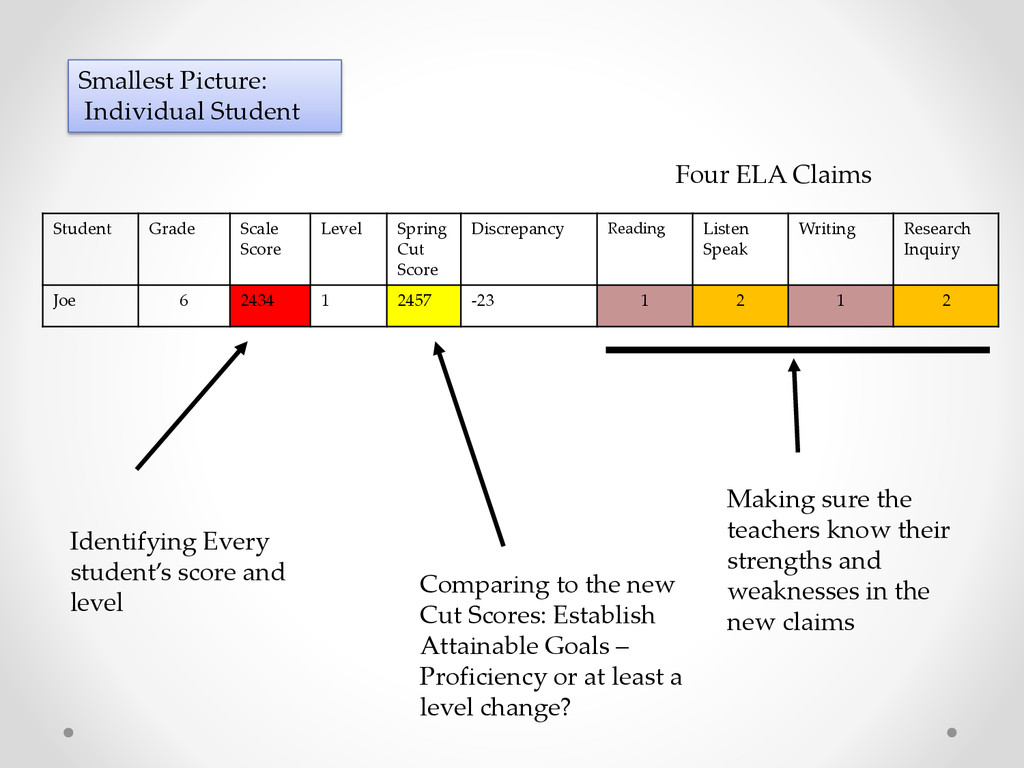
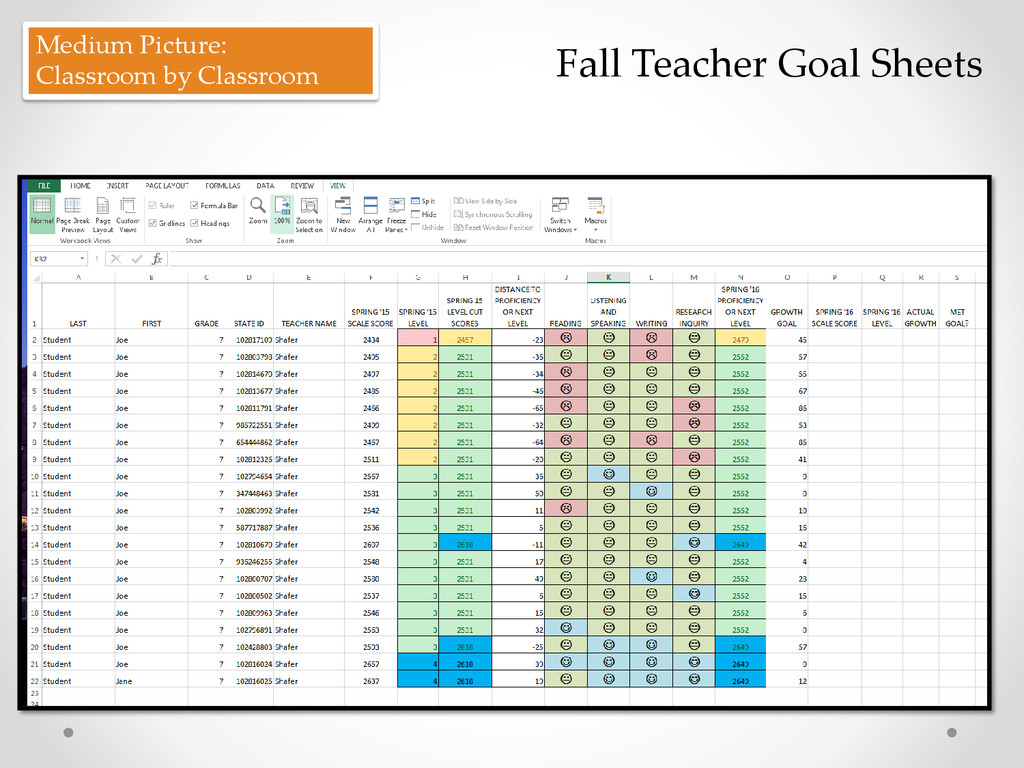
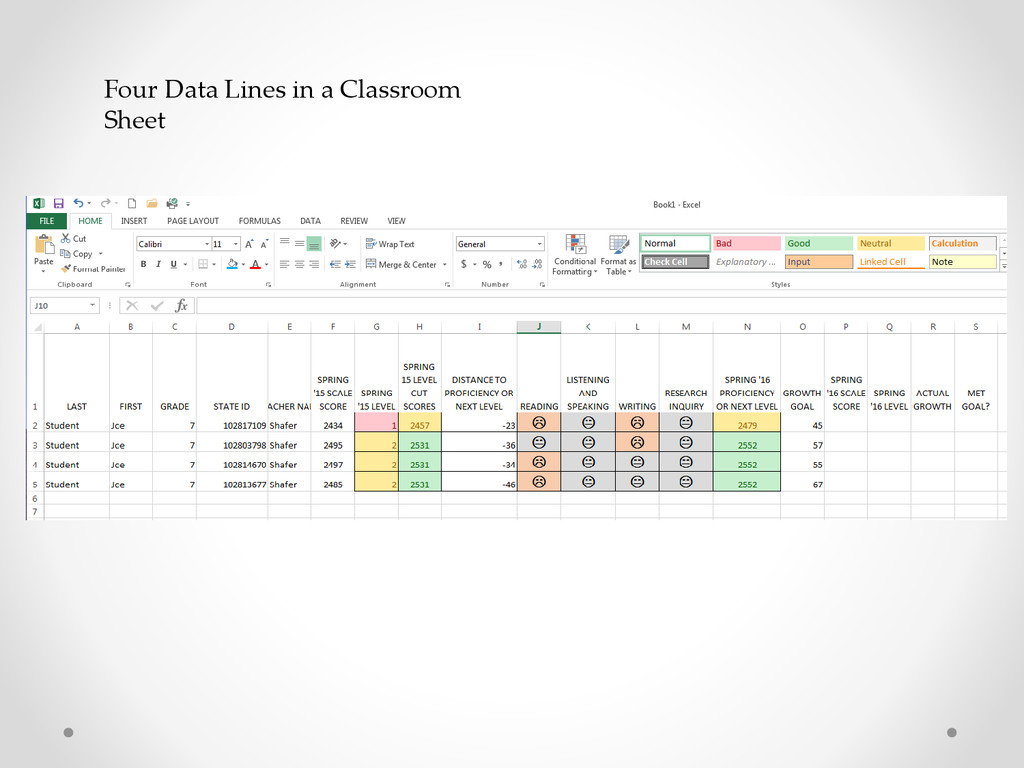
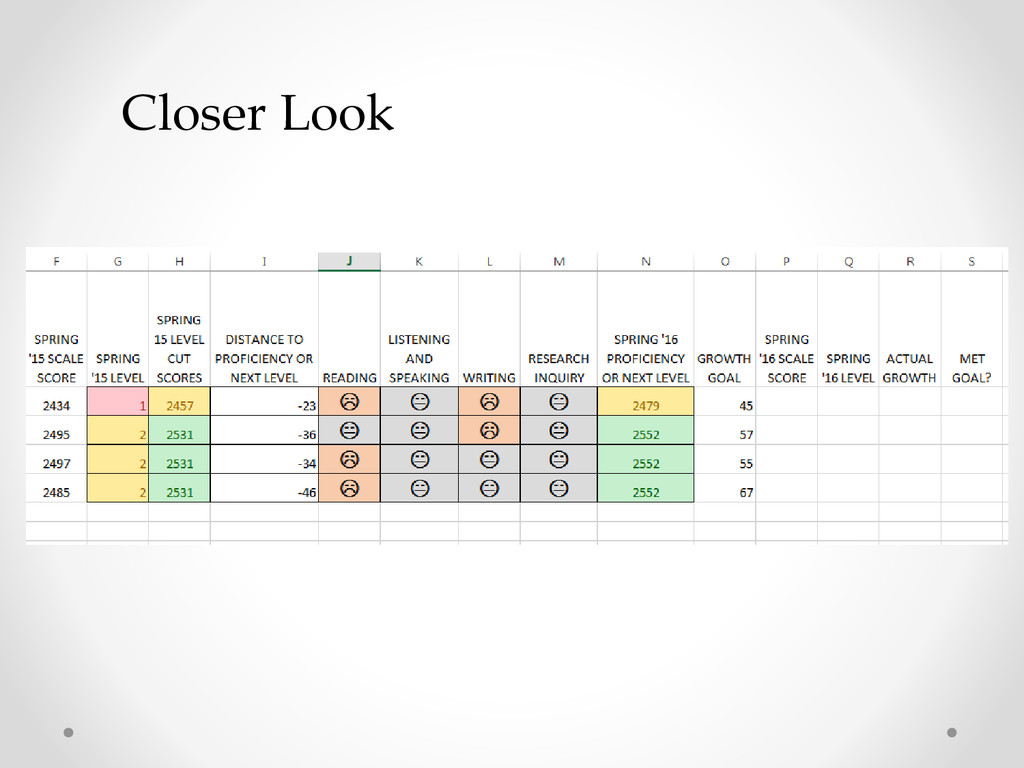
  7. Smallest Picture: Individual Student Student Grade Scale Score Level Spring

    Cut Score Discrepancy Reading Listen Speak Writing Research Inquiry Joe 6 2434 1 2457 -23 1 2 1 2 Identifying Every student’s score and level Comparing to the new Cut Scores: Establish Attainable Goals – Proficiency or at least a level change? Making sure the teachers know their strengths and weaknesses in the new claims Four ELA Claims
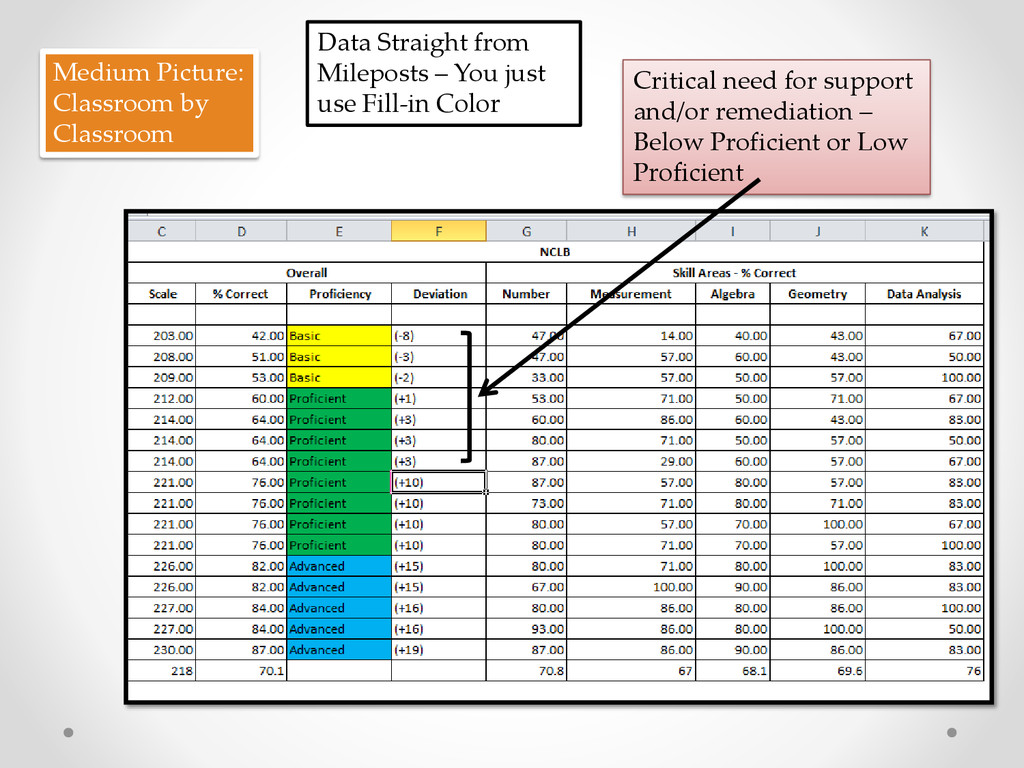
  8. Data Straight from Mileposts – You just use Fill-in Color

    Critical need for support and/or remediation – Below Proficient or Low Proficient Medium Picture: Classroom by Classroom
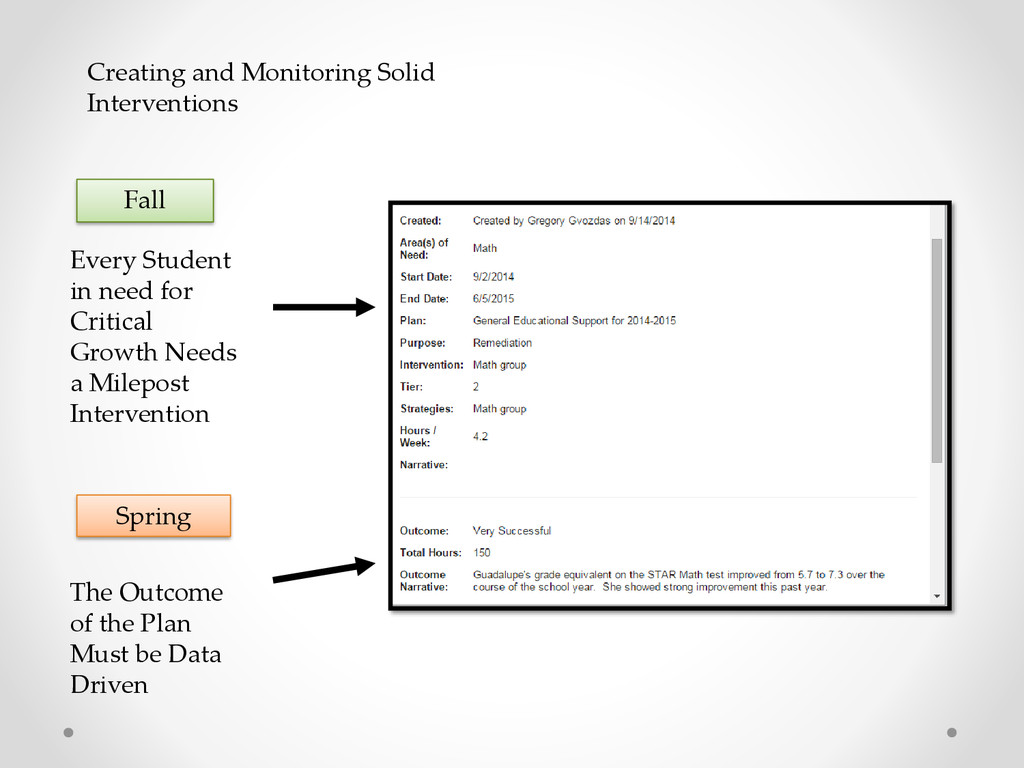
  9. Creating and Monitoring Solid Interventions Every Student in need for

    Critical Growth Needs a Milepost Intervention Fall Spring The Outcome of the Plan Must be Data Driven
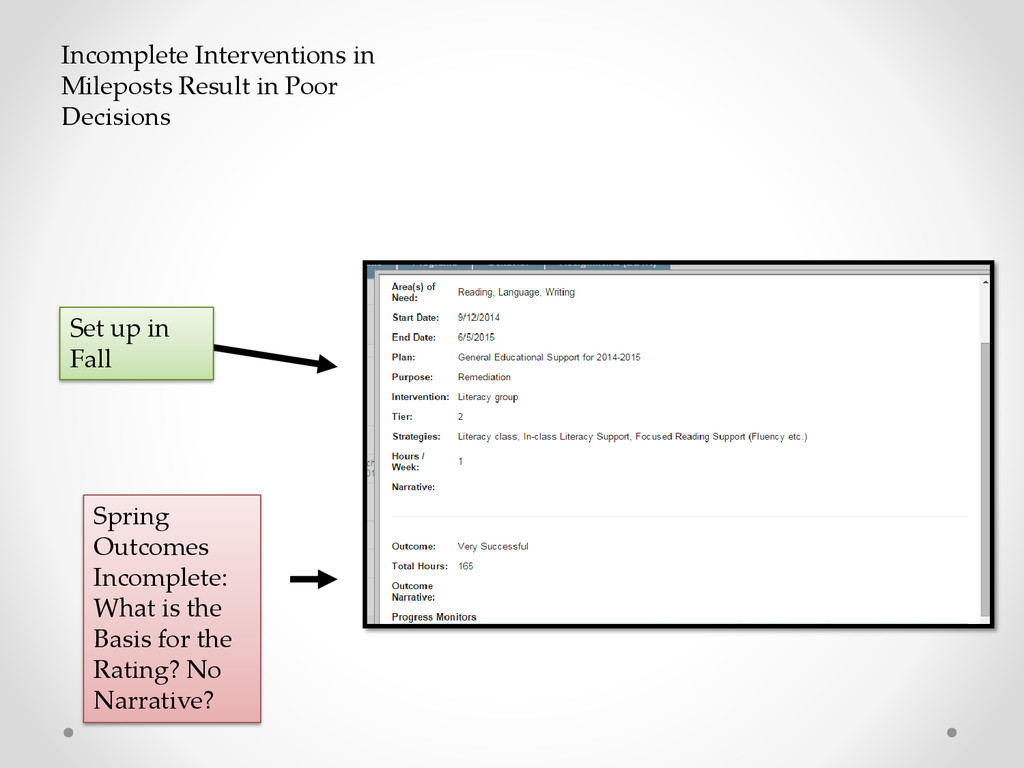
  10. Incomplete Interventions in Mileposts Result in Poor Decisions Set up

    in Fall Spring Outcomes Incomplete: What is the Basis for the Rating? No Narrative?
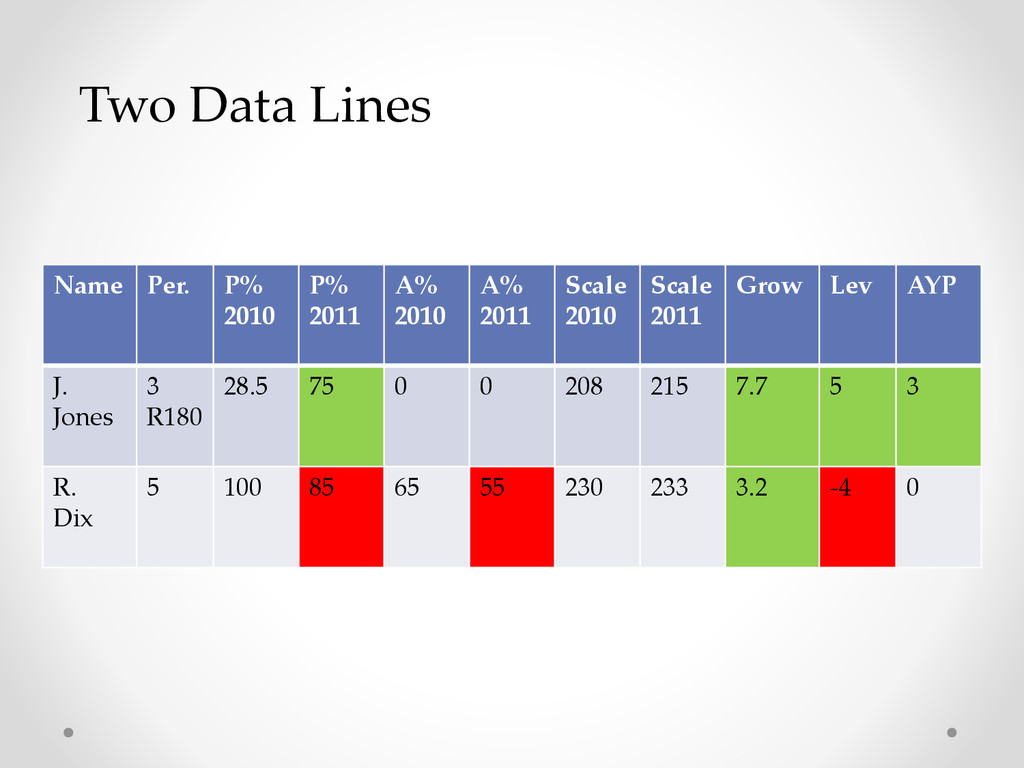
  11. Name Per. P% 2010 P% 2011 A% 2010 A% 2011

    Scale 2010 Scale 2011 Grow Lev AYP J. Jones 3 R180 28.5 75 0 0 208 215 7.7 5 3 R. Dix 5 100 85 65 55 230 233 3.2 -4 0 Two Data Lines
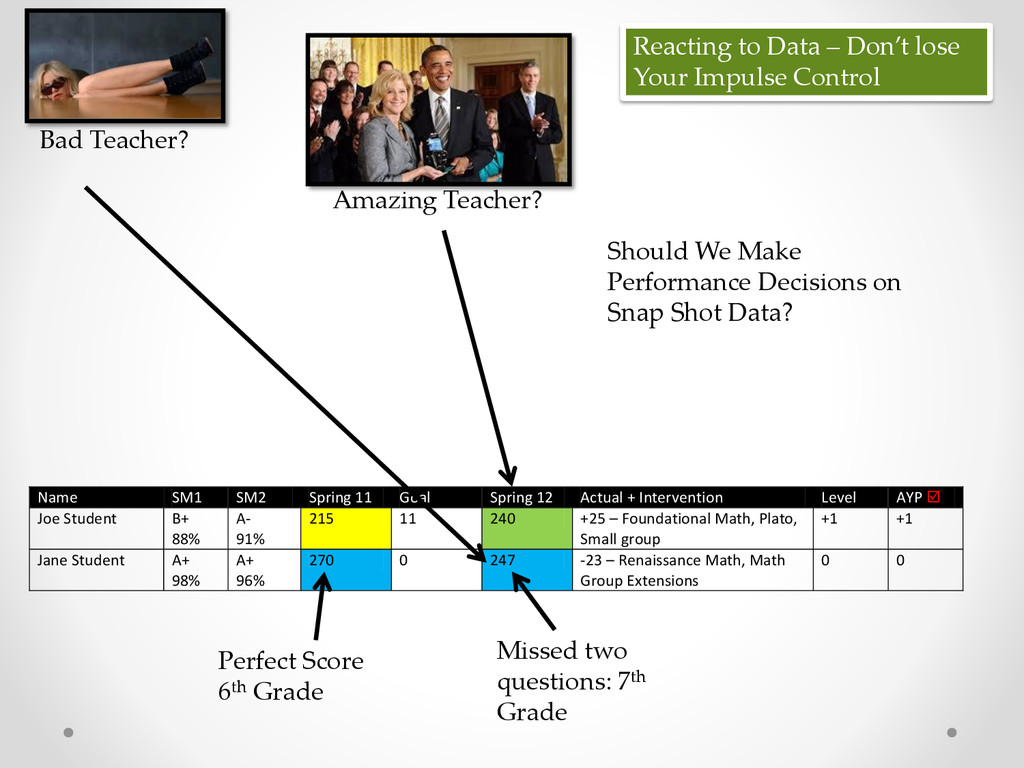
  12. Name SM1 SM2 Spring 11 Goal Spring 12 Actual +

    Intervention Level AYP  Joe Student B+ 88% A- 91% 215 11 240 +25 – Foundational Math, Plato, Small group +1 +1 Jane Student A+ 98% A+ 96% 270 0 247 -23 – Renaissance Math, Math Group Extensions 0 0 Reacting to Data – Don’t lose Your Impulse Control Bad Teacher? Amazing Teacher? Perfect Score 6th Grade Missed two questions: 7th Grade Should We Make Performance Decisions on Snap Shot Data?
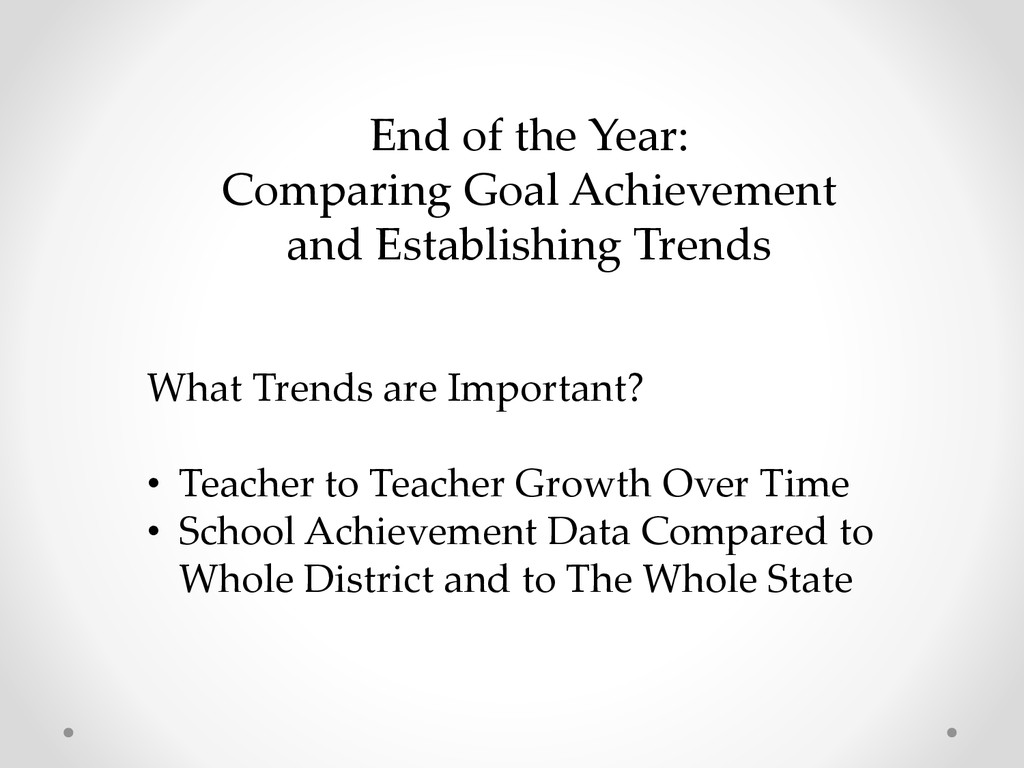
  13. End of the Year: Comparing Goal Achievement and Establishing Trends

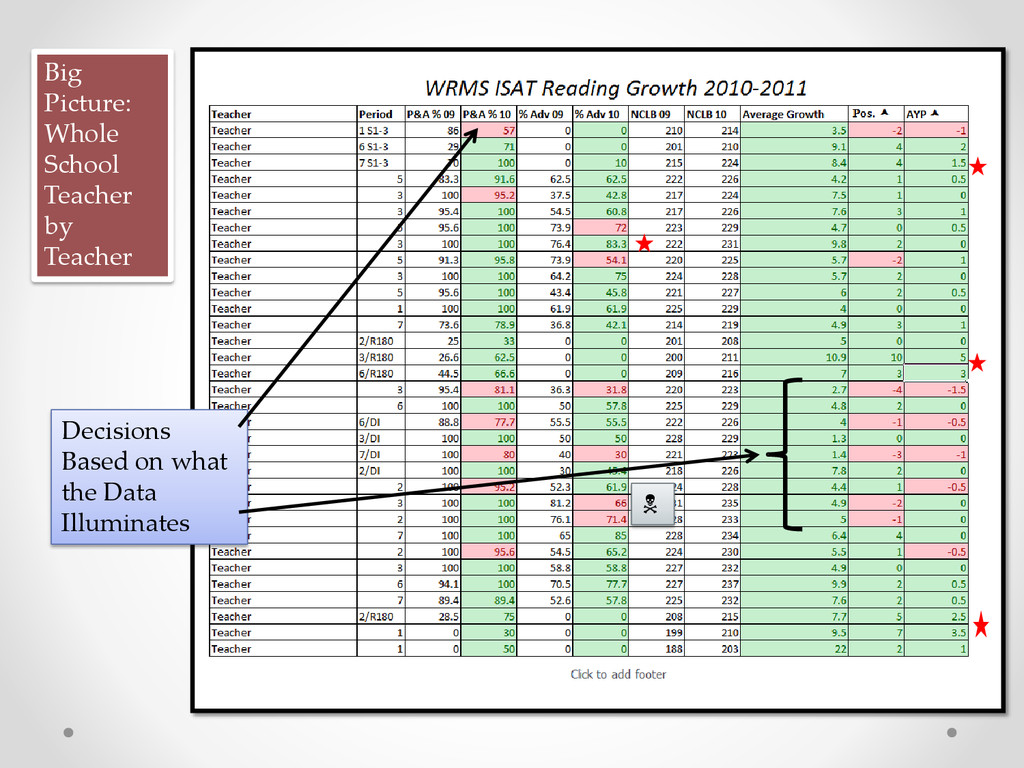
    What Trends are Important? • Teacher to Teacher Growth Over Time • School Achievement Data Compared to Whole District and to The Whole State
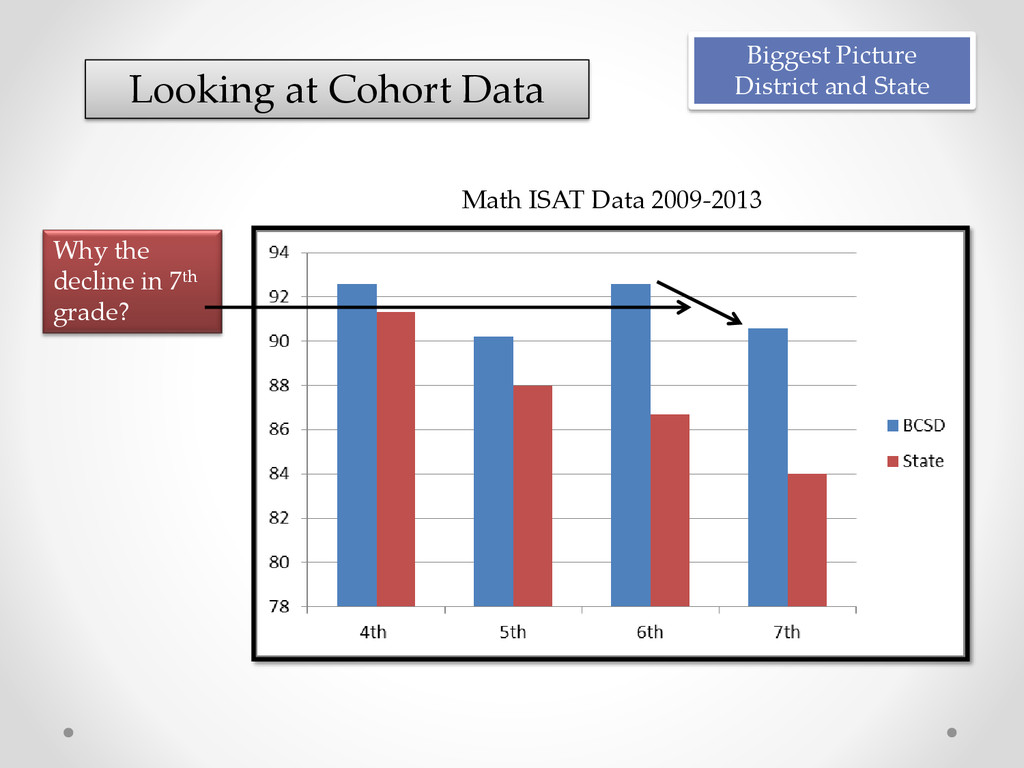
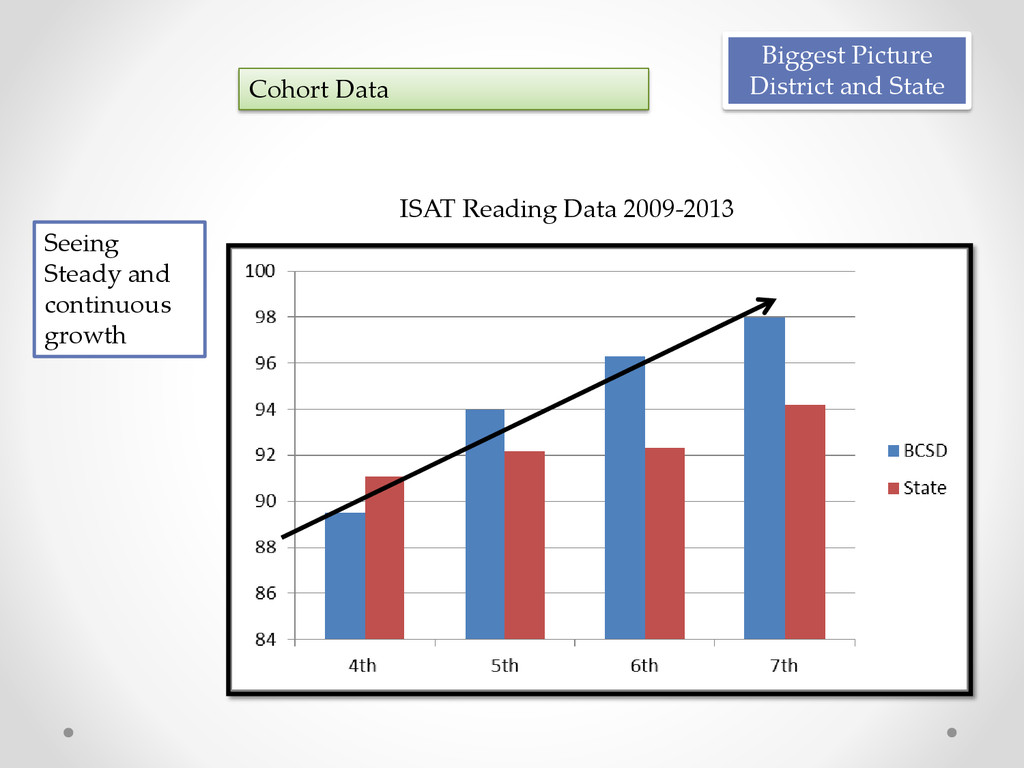
  14. Looking at Cohort Data Math ISAT Data 2009-2013 Why the

    decline in 7th grade? Biggest Picture District and State
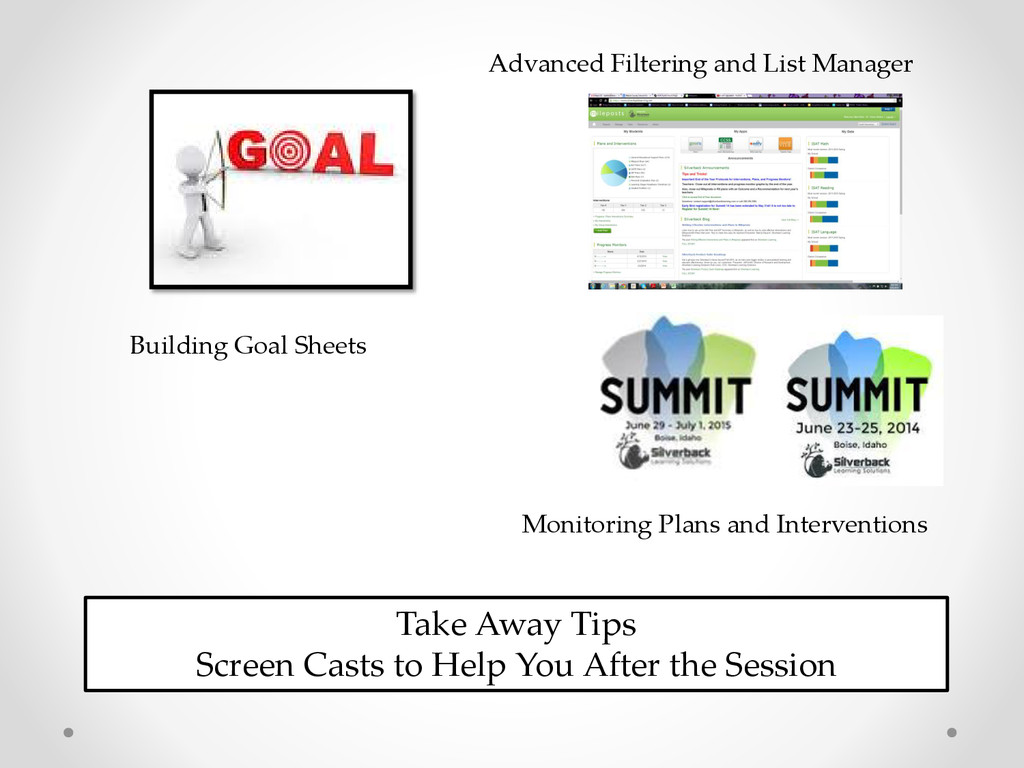
  15. Take Away Tips Screen Casts to Help You After the

    Session Building Goal Sheets Advanced Filtering and List Manager Monitoring Plans and Interventions