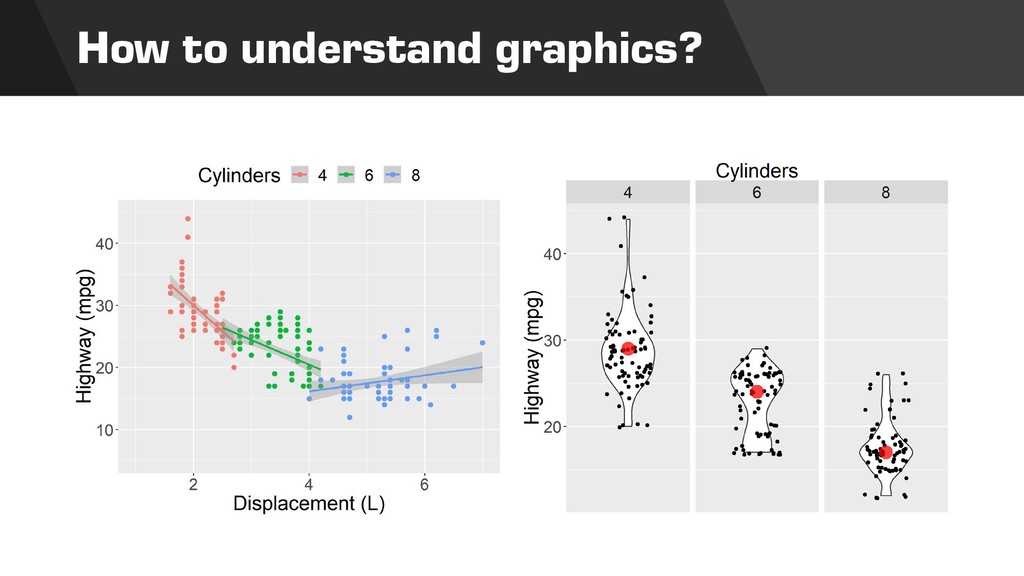
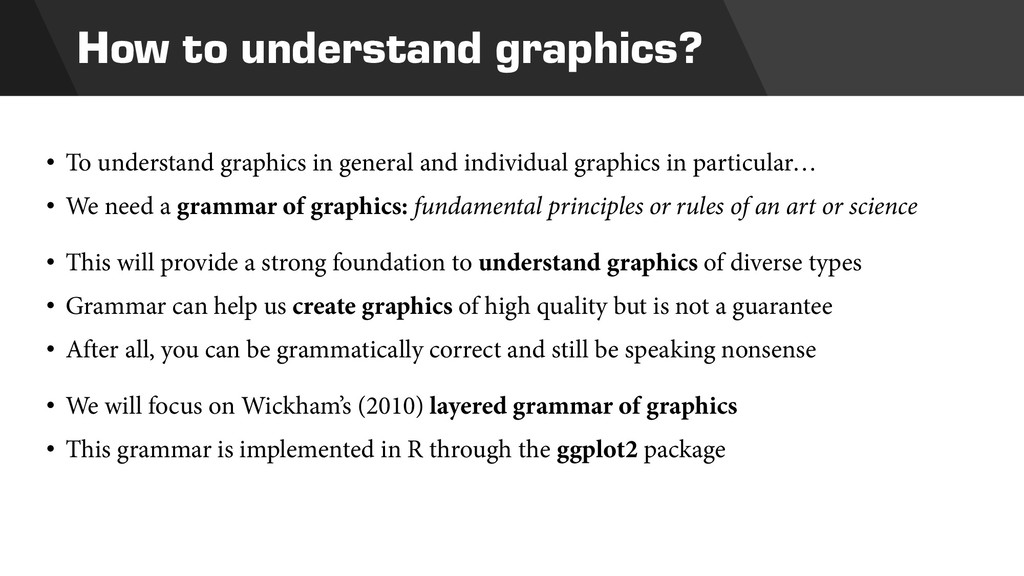
and individual graphics in particular… • We need a grammar of graphics: fundamental principles or rules of an art or science • This will provide a strong foundation to understand graphics of diverse types • Grammar can help us create graphics of high quality but is not a guarantee • After all, you can be grammatically correct and still be speaking nonsense • We will focus on Wickham’s (2010) layered grammar of graphics • This grammar is implemented in R through the ggplot2 package
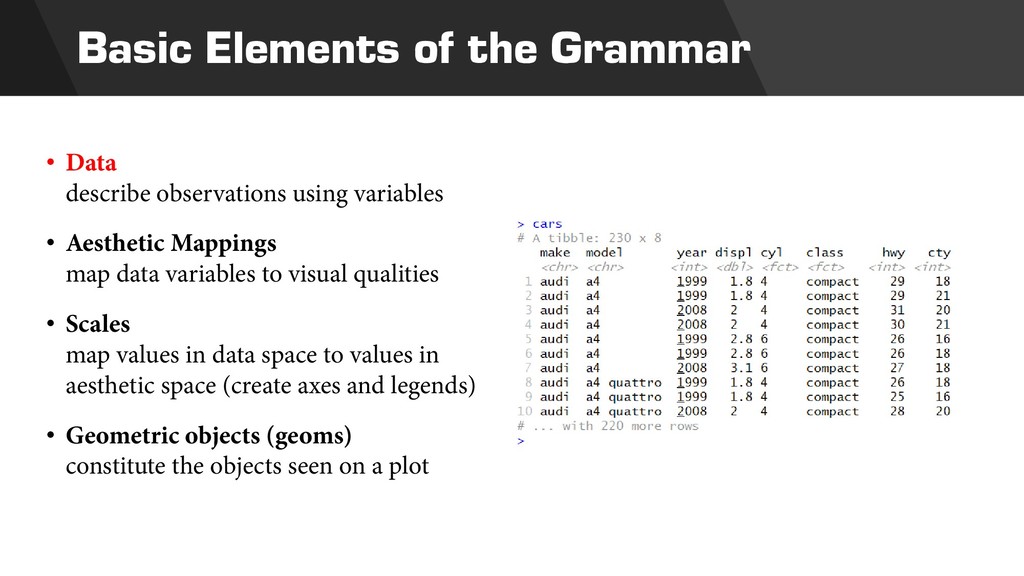
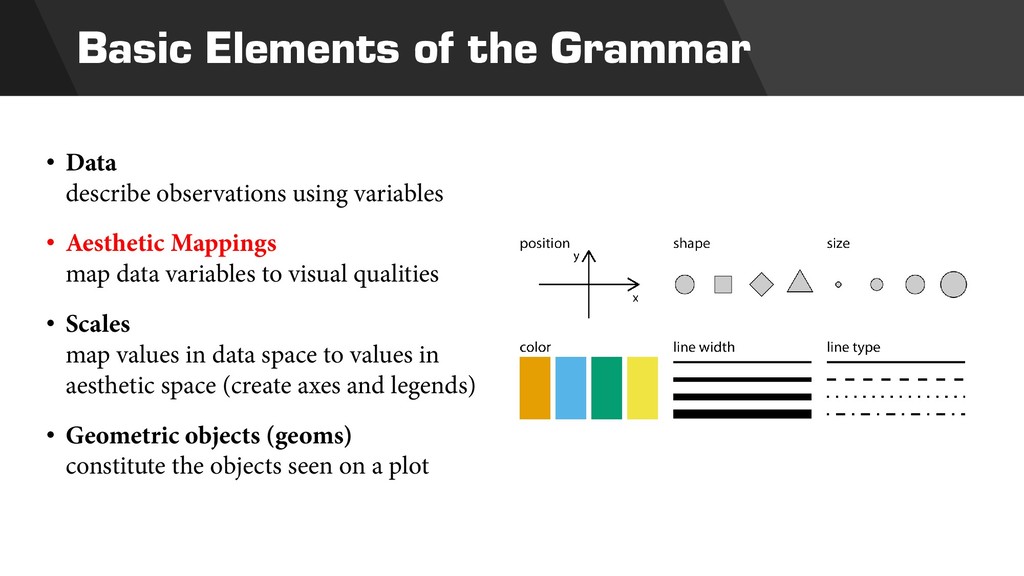
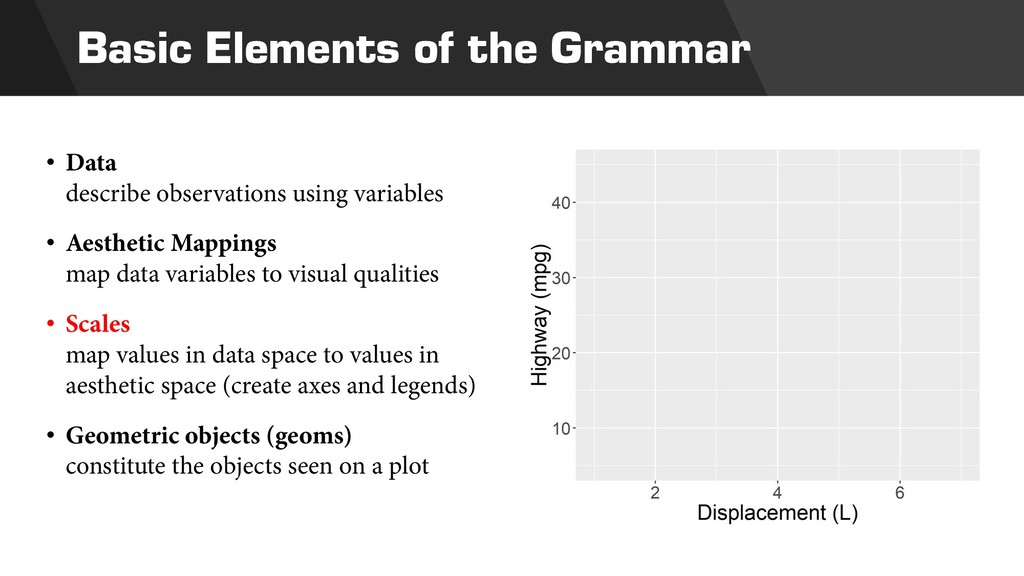
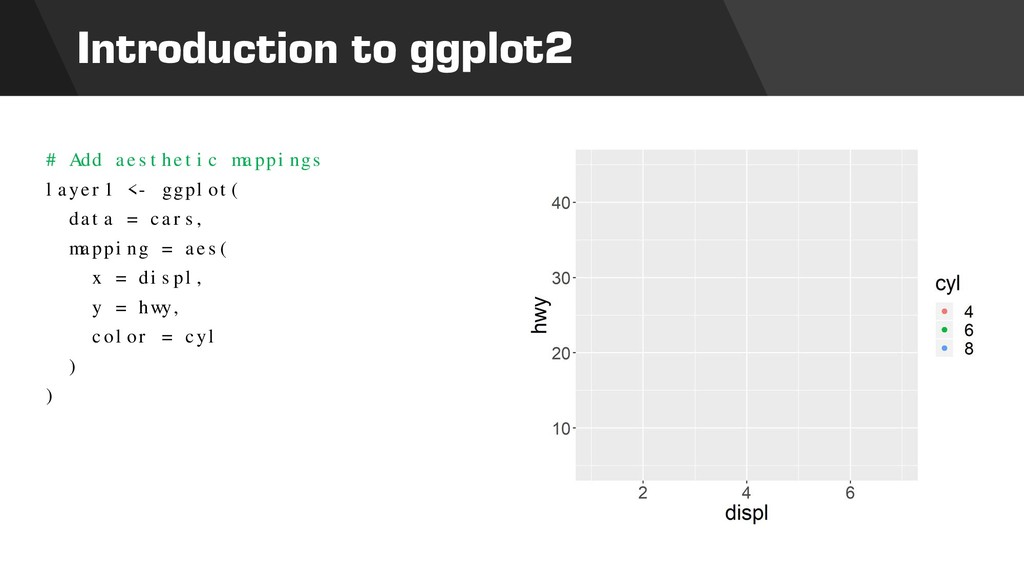
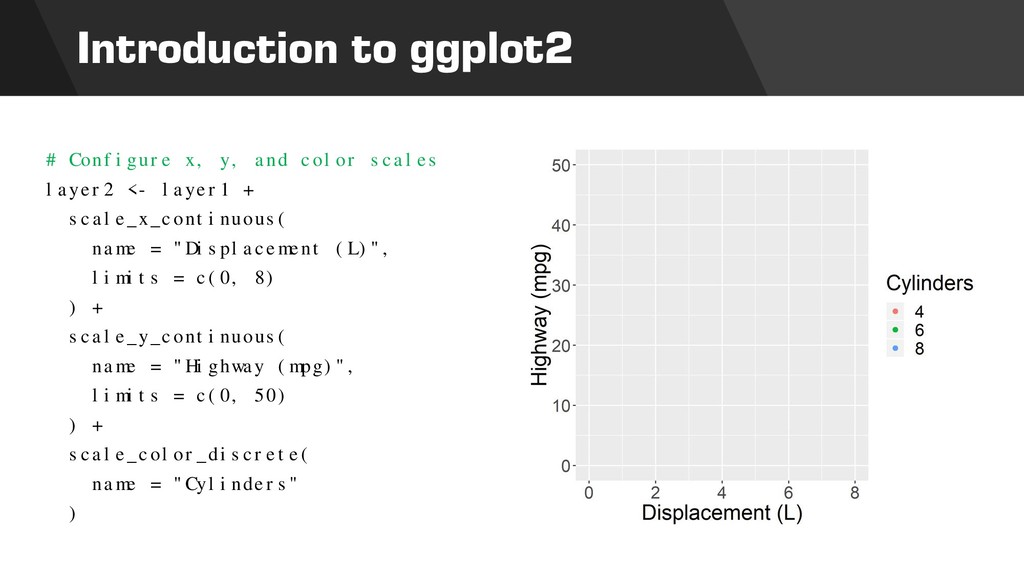
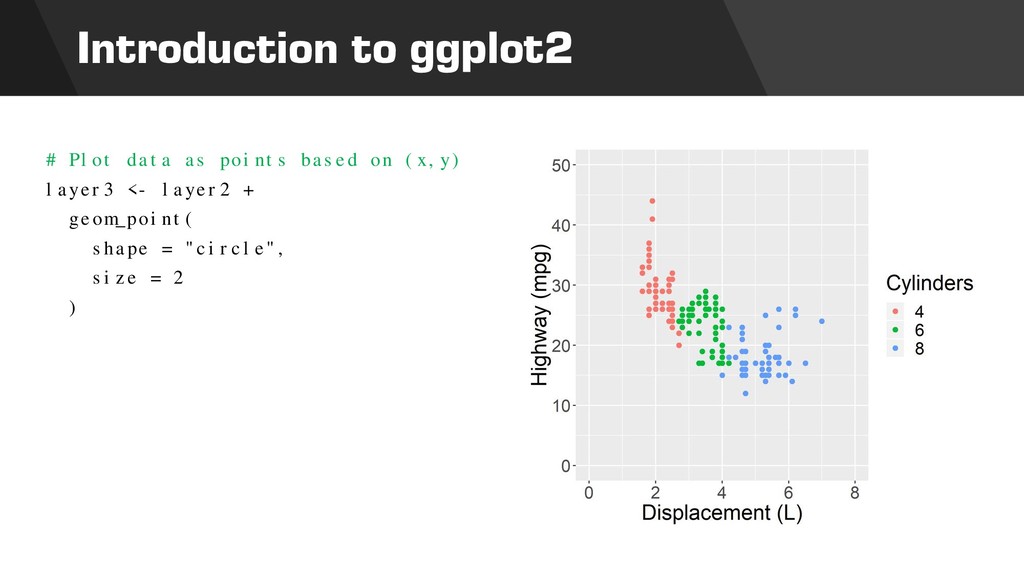
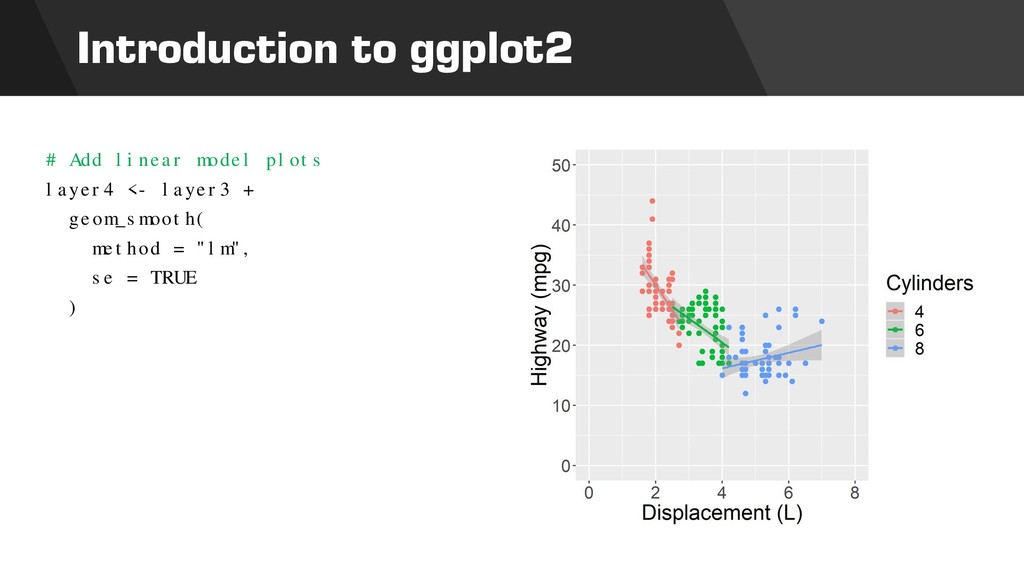
variables • Aesthetic Mappings map data variables to visual qualities • Scales map values in data space to values in aesthetic space (create axes and legends) • Geometric objects (geoms) constitute the objects seen on a plot
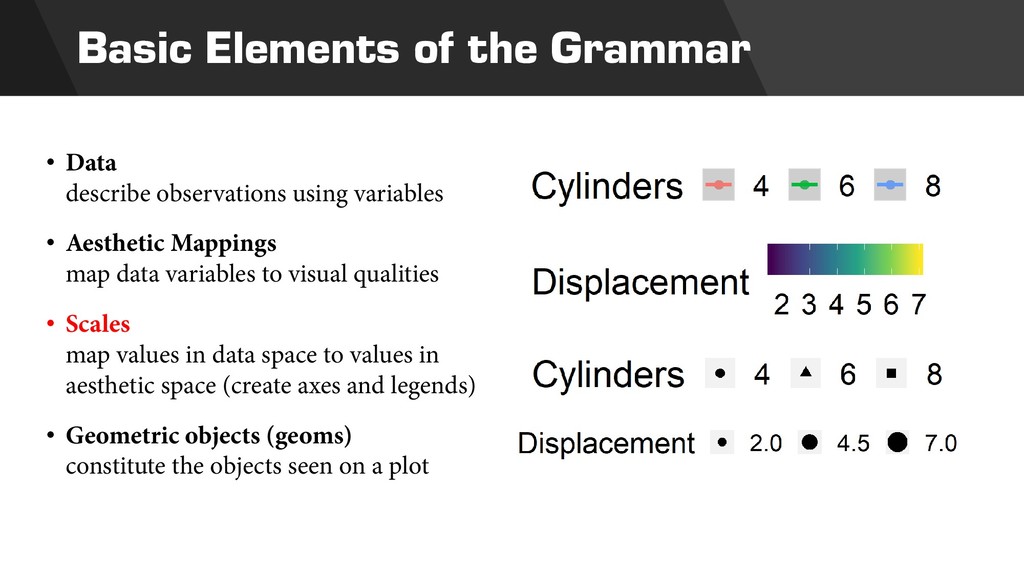
variables • Aesthetic Mappings map data variables to visual qualities • Scales map values in data space to values in aesthetic space (create axes and legends) • Geometric objects (geoms) constitute the objects seen on a plot
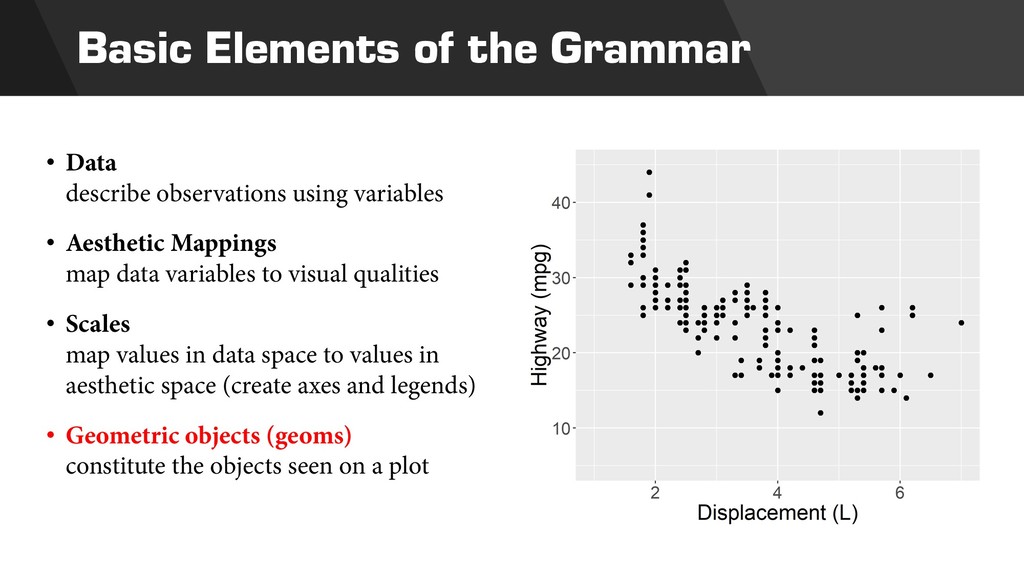
variables • Aesthetic Mappings map data variables to visual qualities • Scales map values in data space to values in aesthetic space (create axes and legends) • Geometric objects (geoms) constitute the objects seen on a plot
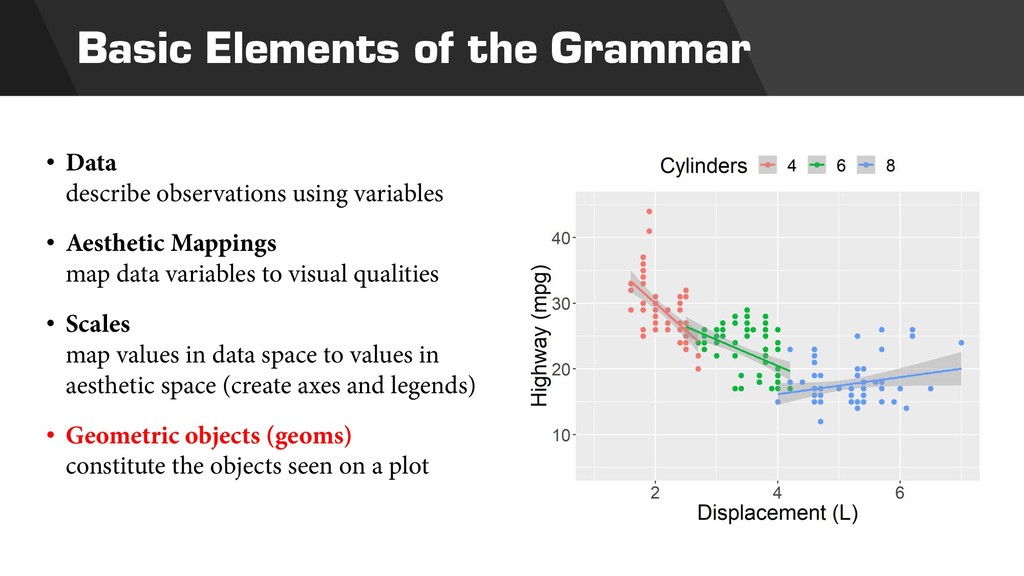
variables • Aesthetic Mappings map data variables to visual qualities • Scales map values in data space to values in aesthetic space (create axes and legends) • Geometric objects (geoms) constitute the objects seen on a plot
variables • Aesthetic Mappings map data variables to visual qualities • Scales map values in data space to values in aesthetic space (create axes and legends) • Geometric objects (geoms) constitute the objects seen on a plot
variables • Aesthetic Mappings map data variables to visual qualities • Scales map values in data space to values in aesthetic space (create axes and legends) • Geometric objects (geoms) constitute the objects seen on a plot
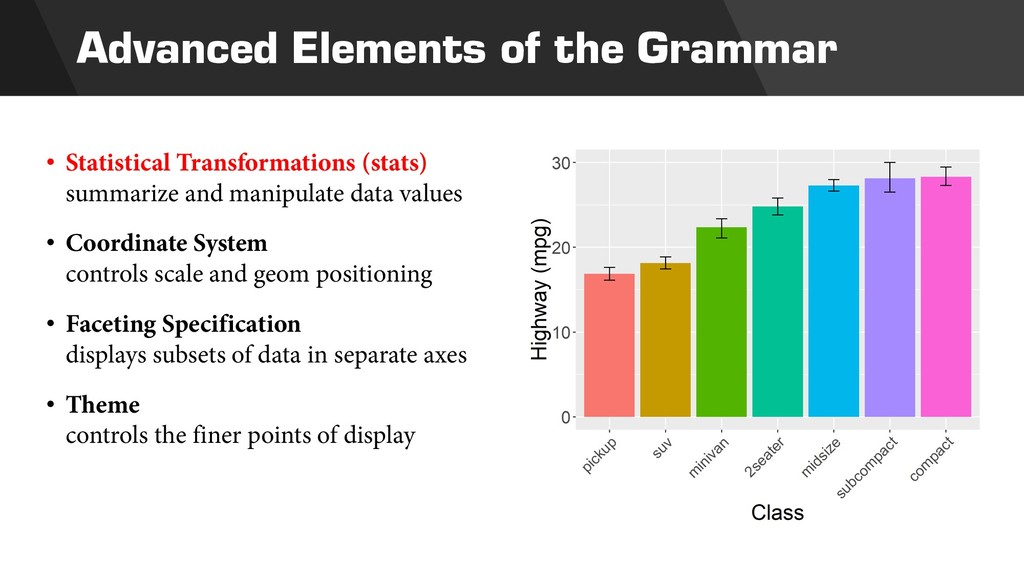
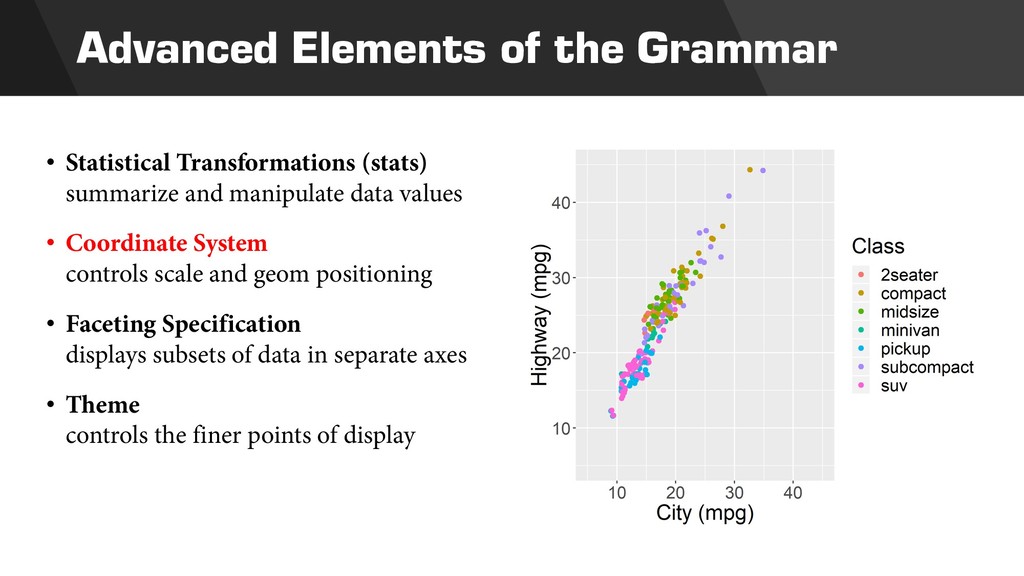
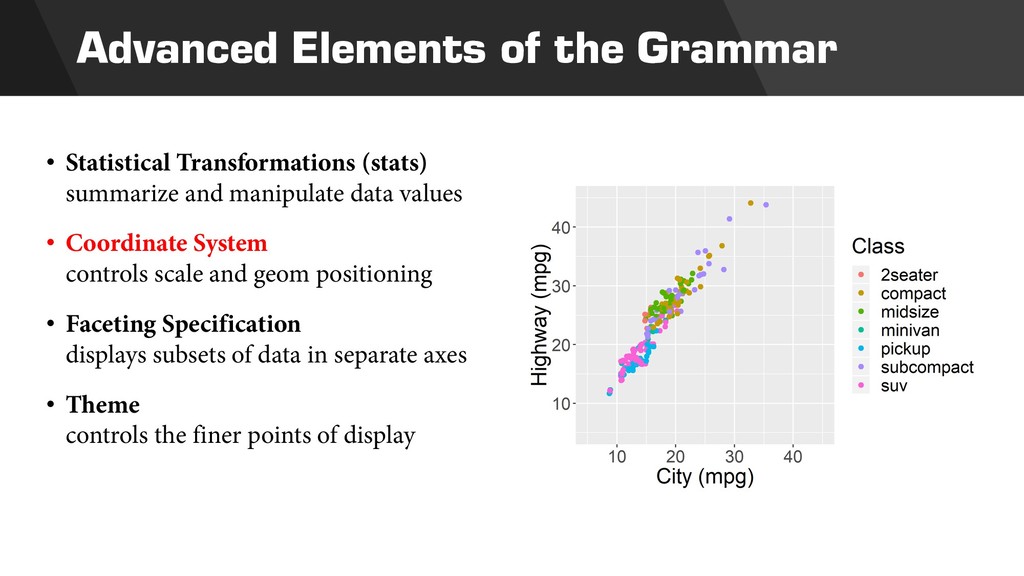
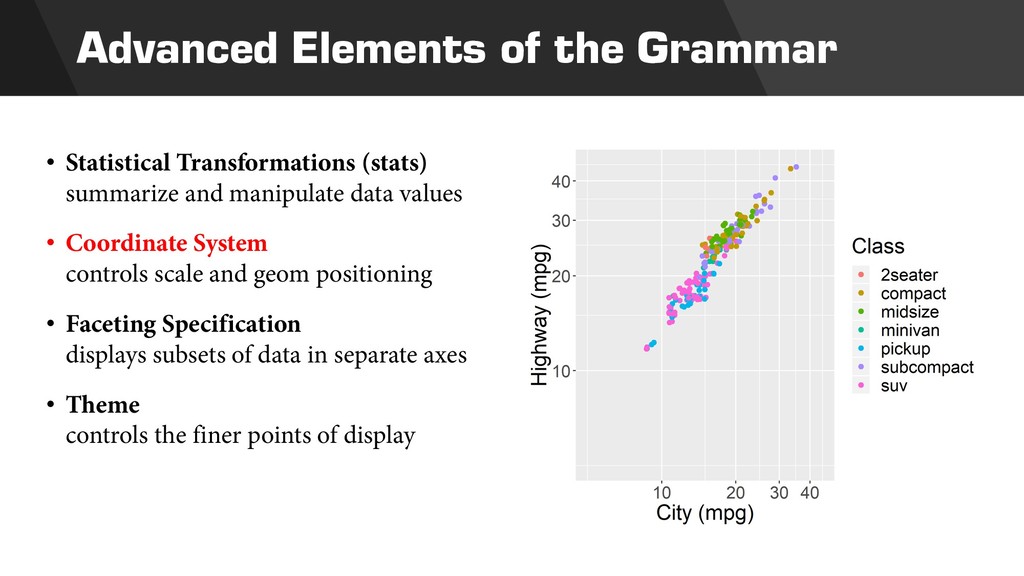
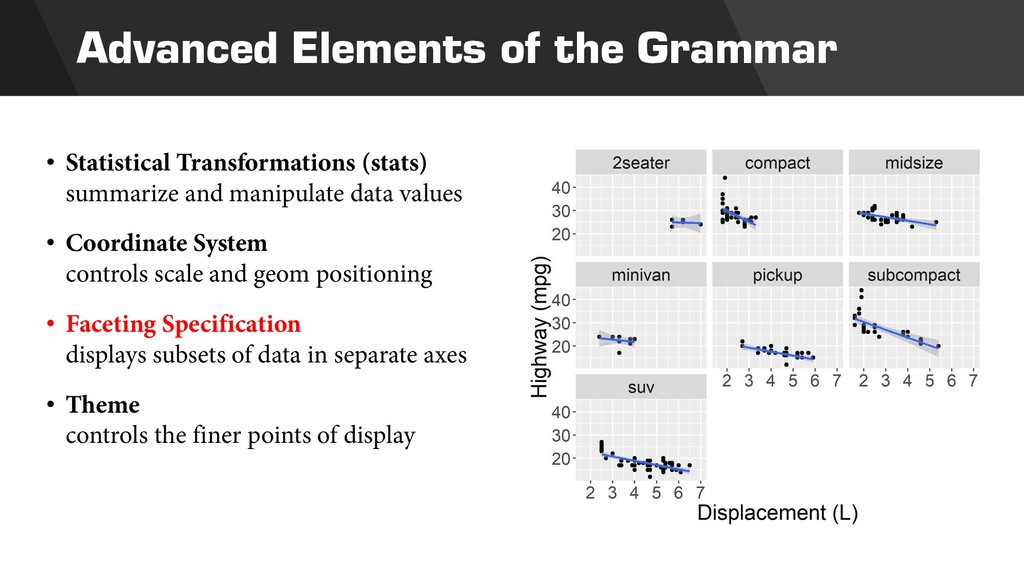
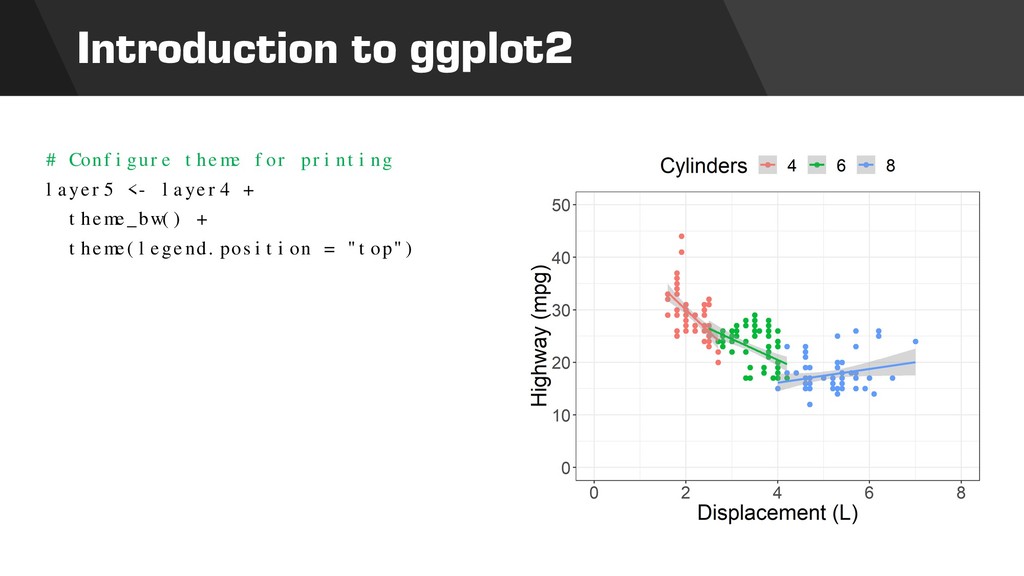
and manipulate data values • Coordinate System controls scale and geom positioning • Faceting Specification displays subsets of data in separate axes • Theme controls the finer points of display
and manipulate data values • Coordinate System controls scale and geom positioning • Faceting Specification displays subsets of data in separate axes • Theme controls the finer points of display
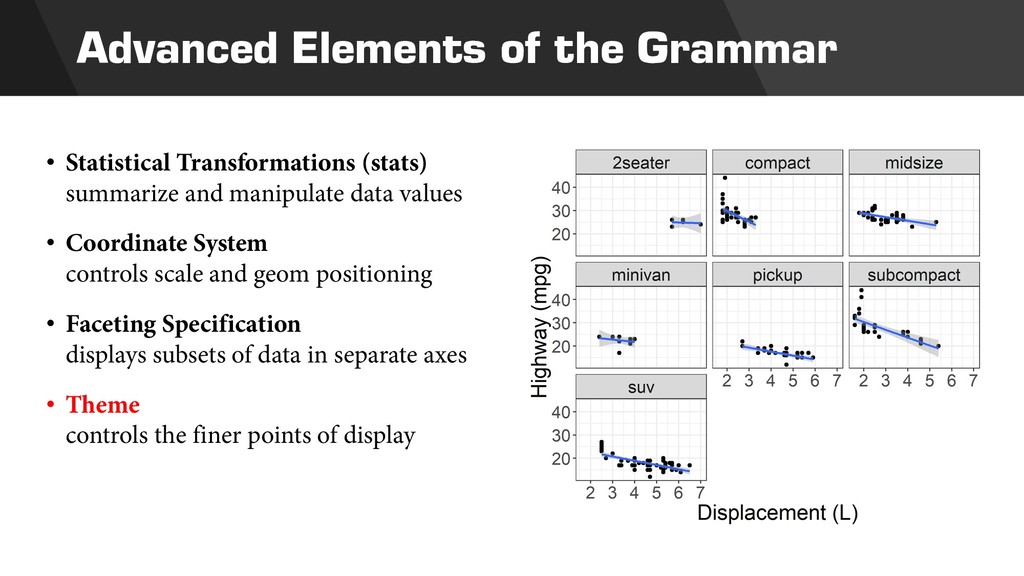
and manipulate data values • Coordinate System controls scale and geom positioning • Faceting Specification displays subsets of data in separate axes • Theme controls the finer points of display
and manipulate data values • Coordinate System controls scale and geom positioning • Faceting Specification displays subsets of data in separate axes • Theme controls the finer points of display
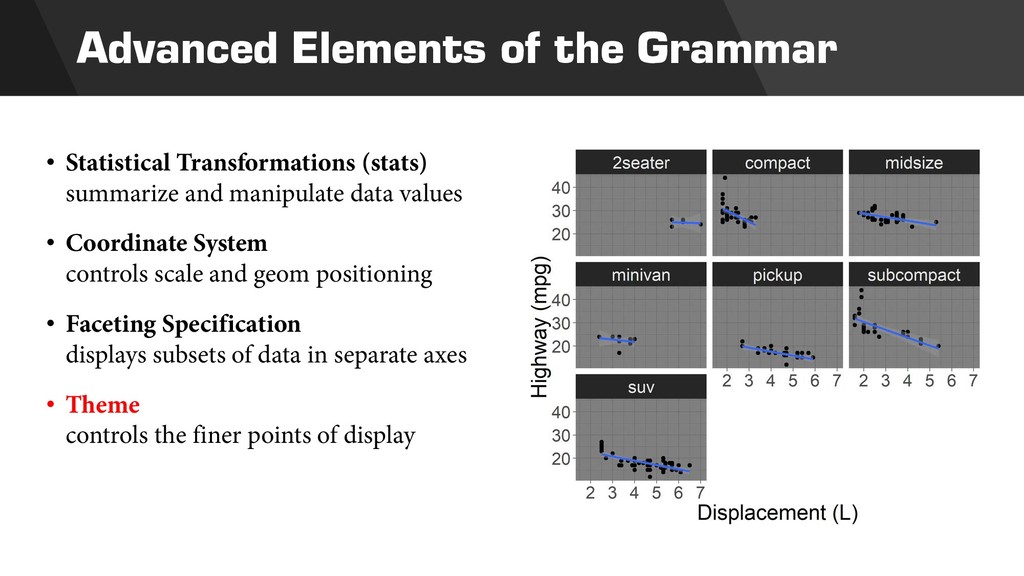
and manipulate data values • Coordinate System controls scale and geom positioning • Faceting Specification displays subsets of data in separate axes • Theme controls the finer points of display
and manipulate data values • Coordinate System controls scale and geom positioning • Faceting Specification displays subsets of data in separate axes • Theme controls the finer points of display
and manipulate data values • Coordinate System controls scale and geom positioning • Faceting Specification displays subsets of data in separate axes • Theme controls the finer points of display
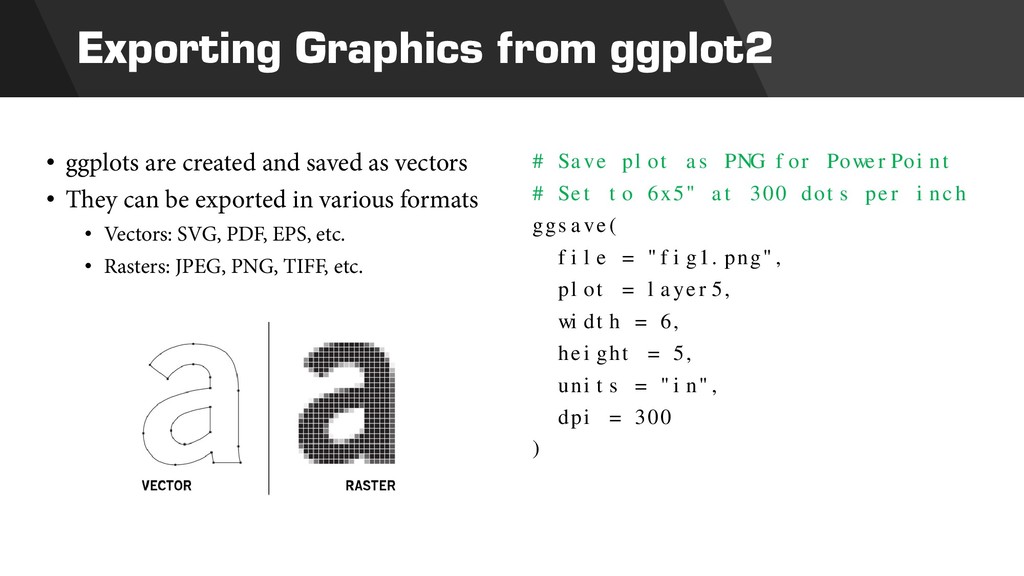
as vectors • They can be exported in various formats • Vectors: SVG, PDF, EPS, etc. • Rasters: JPEG, PNG, TIFF, etc. # Save plot as PNG for PowerPoint # Set to 6x5" at 300 dots per inch ggsave( file = "fig1.png", plot = layer5, width = 6, height = 5, units = "in", dpi = 300 )
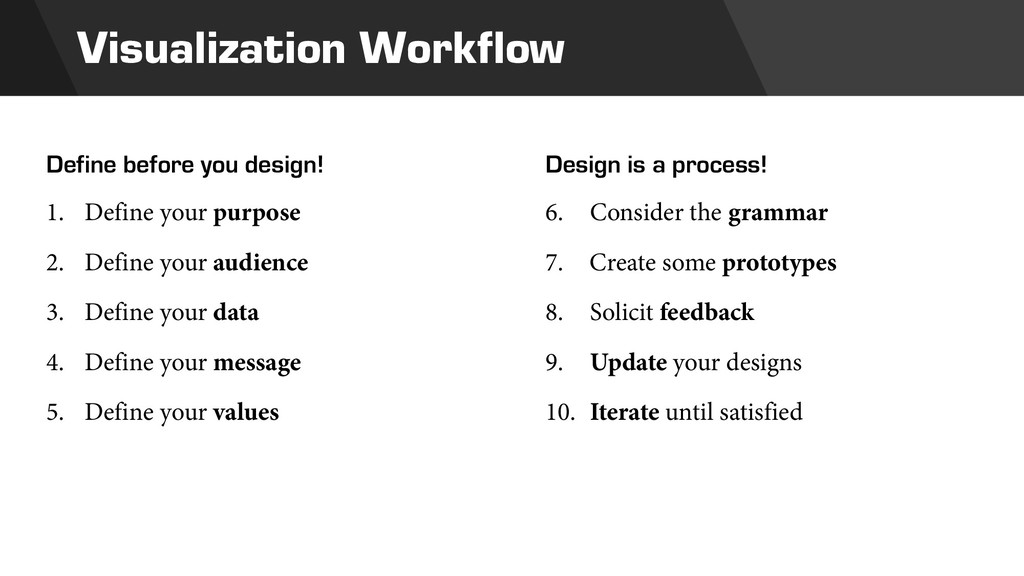
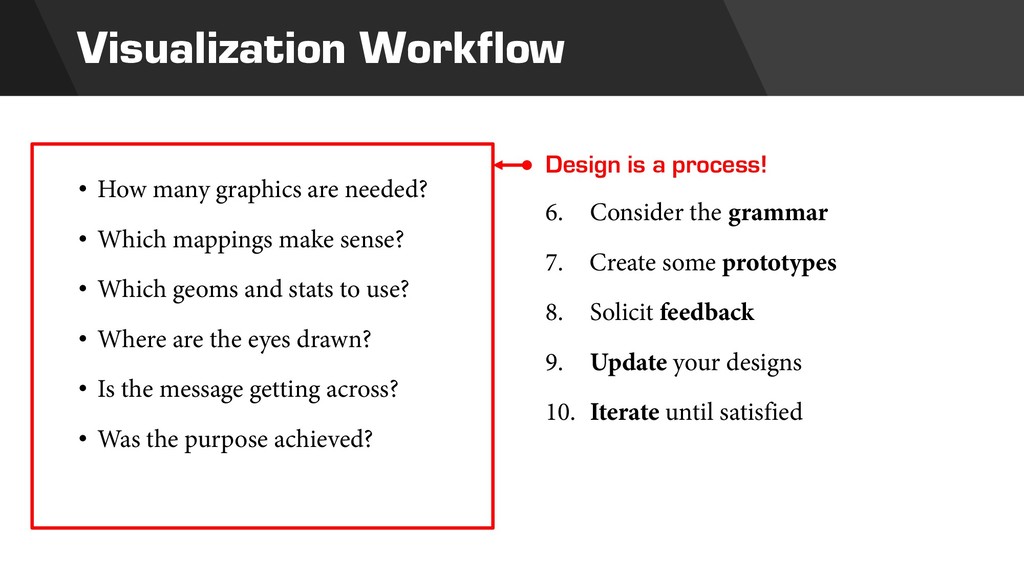
2. Define your audience 3. Define your data 4. Define your message 5. Define your values Design is a process! 6. Consider the grammar 7. Create some prototypes 8. Solicit feedback 9. Update your designs 10. Iterate until satisfied
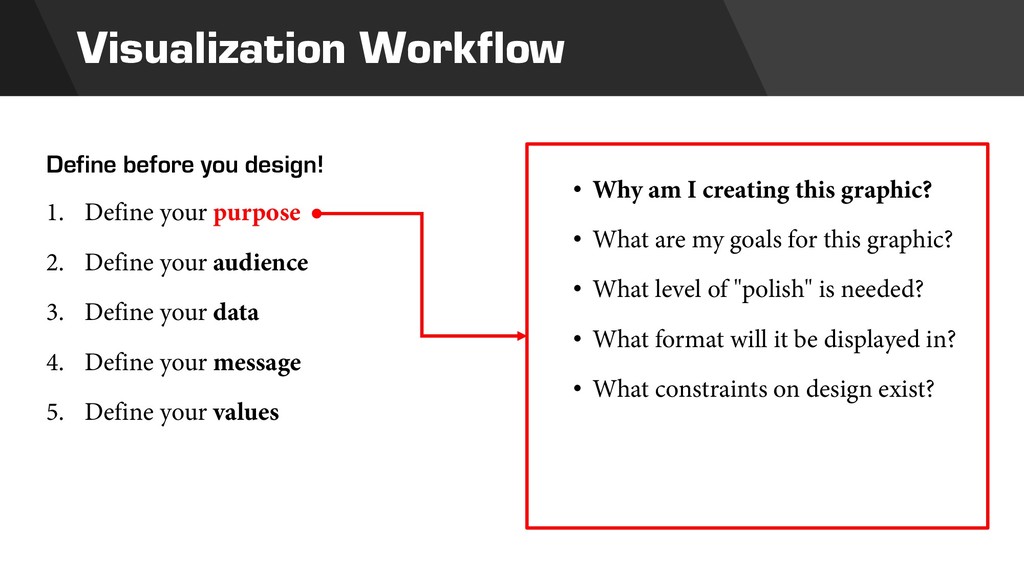
2. Define your audience 3. Define your data 4. Define your message 5. Define your values • Why am I creating this graphic? • What are my goals for this graphic? • What level of "polish" is needed? • What format will it be displayed in? • What constraints on design exist?
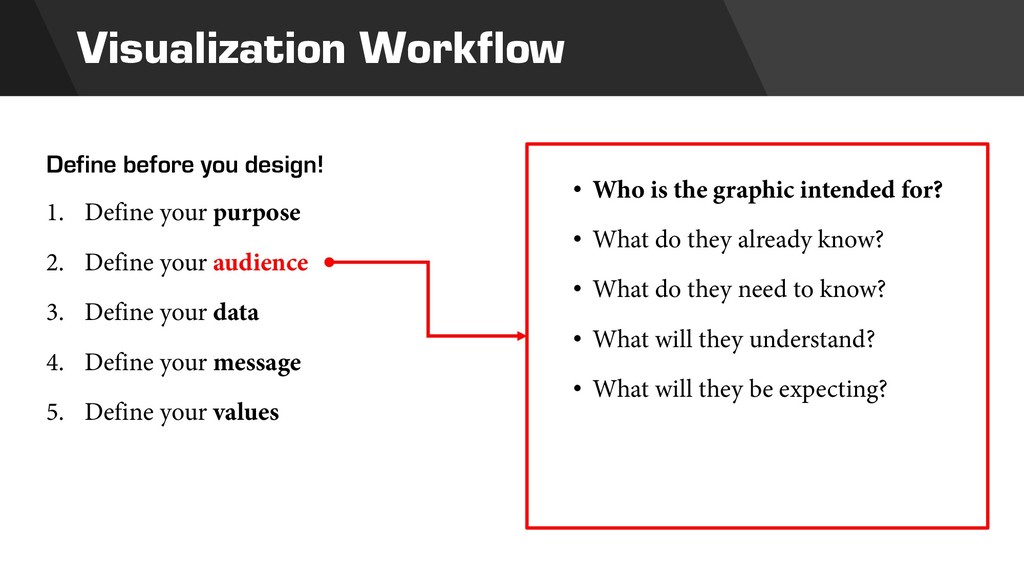
2. Define your audience 3. Define your data 4. Define your message 5. Define your values • Who is the graphic intended for? • What do they already know? • What do they need to know? • What will they understand? • What will they be expecting?
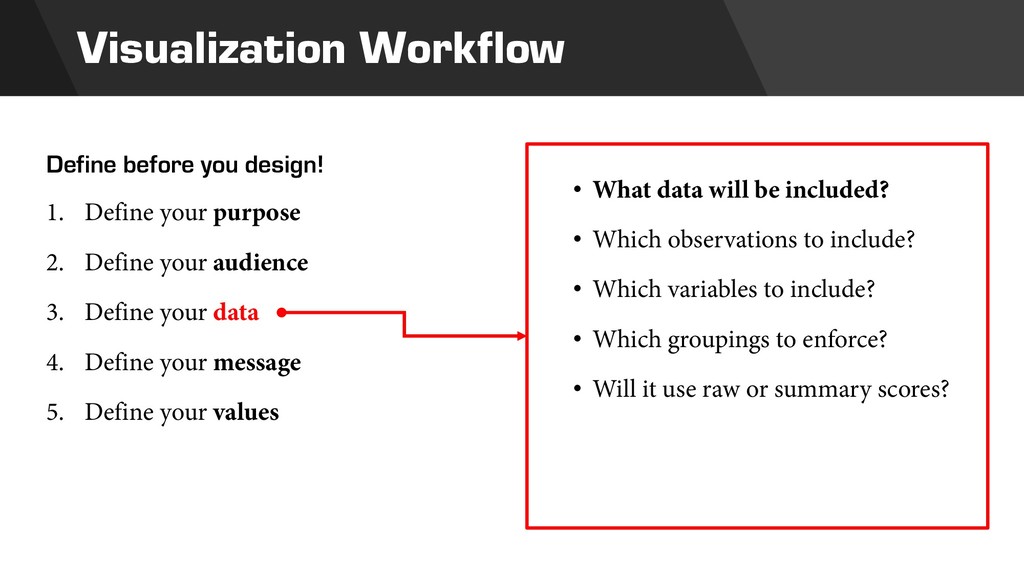
2. Define your audience 3. Define your data 4. Define your message 5. Define your values • What data will be included? • Which observations to include? • Which variables to include? • Which groupings to enforce? • Will it use raw or summary scores?
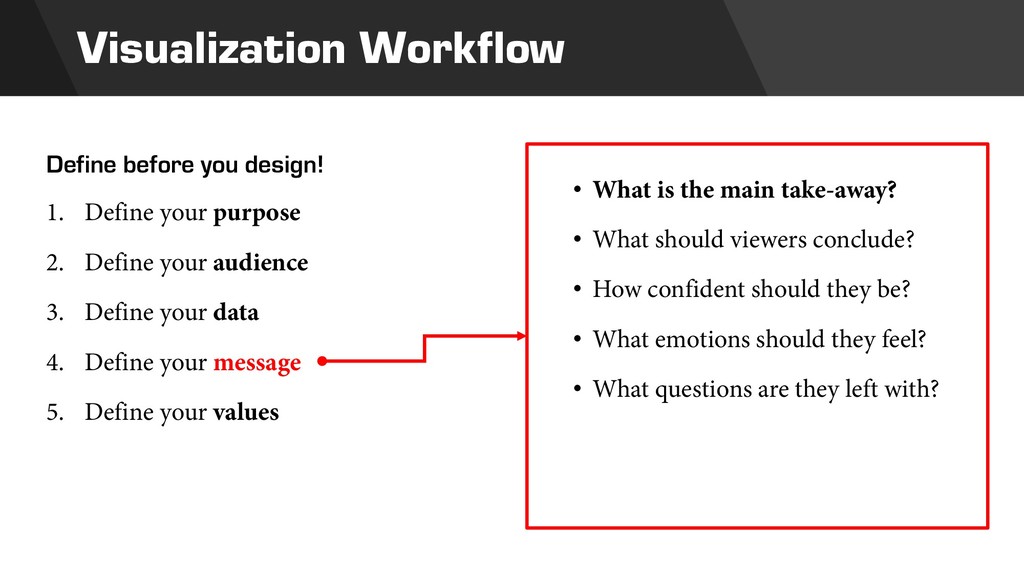
2. Define your audience 3. Define your data 4. Define your message 5. Define your values • What is the main take-away? • What should viewers conclude? • How confident should they be? • What emotions should they feel? • What questions are they left with?
2. Define your audience 3. Define your data 4. Define your message 5. Define your values • What values are to be emphasized? • What techniques can achieve them? Honesty Accessibility Clarity Beauty Flexibility
7. Create some prototypes 8. Solicit feedback 9. Update your designs 10. Iterate until satisfied • How many graphics are needed? • Which mappings make sense? • Which geoms and stats to use? • Where are the eyes drawn? • Is the message getting across? • Was the purpose achieved?
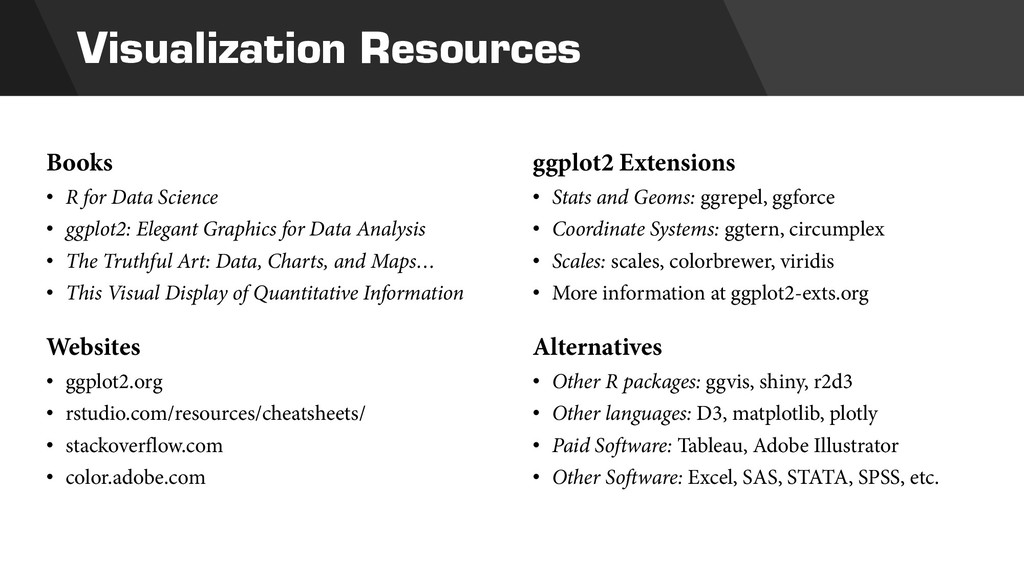
Elegant Graphics for Data Analysis • The Truthful Art: Data, Charts, and Maps… • This Visual Display of Quantitative Information Websites • ggplot2.org • rstudio.com/resources/cheatsheets/ • stackoverflow.com • color.adobe.com ggplot2 Extensions • Stats and Geoms: ggrepel, ggforce • Coordinate Systems: ggtern, circumplex • Scales: scales, colorbrewer, viridis • More information at ggplot2-exts.org Alternatives • Other R packages: ggvis, shiny, r2d3 • Other languages: D3, matplotlib, plotly • Paid Software: Tableau, Adobe Illustrator • Other Software: Excel, SAS, STATA, SPSS, etc.