Upgrade to Pro — share decks privately, control downloads, hide ads and more …

Profiling for Grown-Ups

Profiling for Grown-Ups

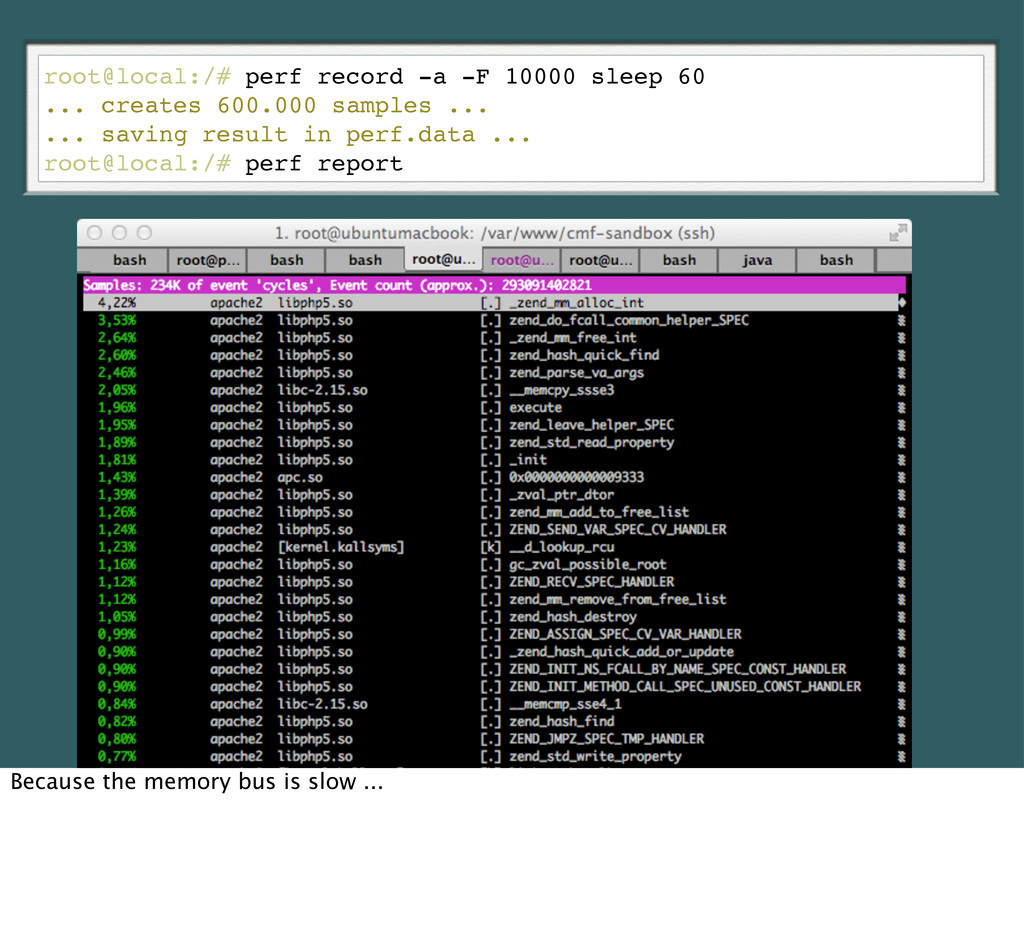
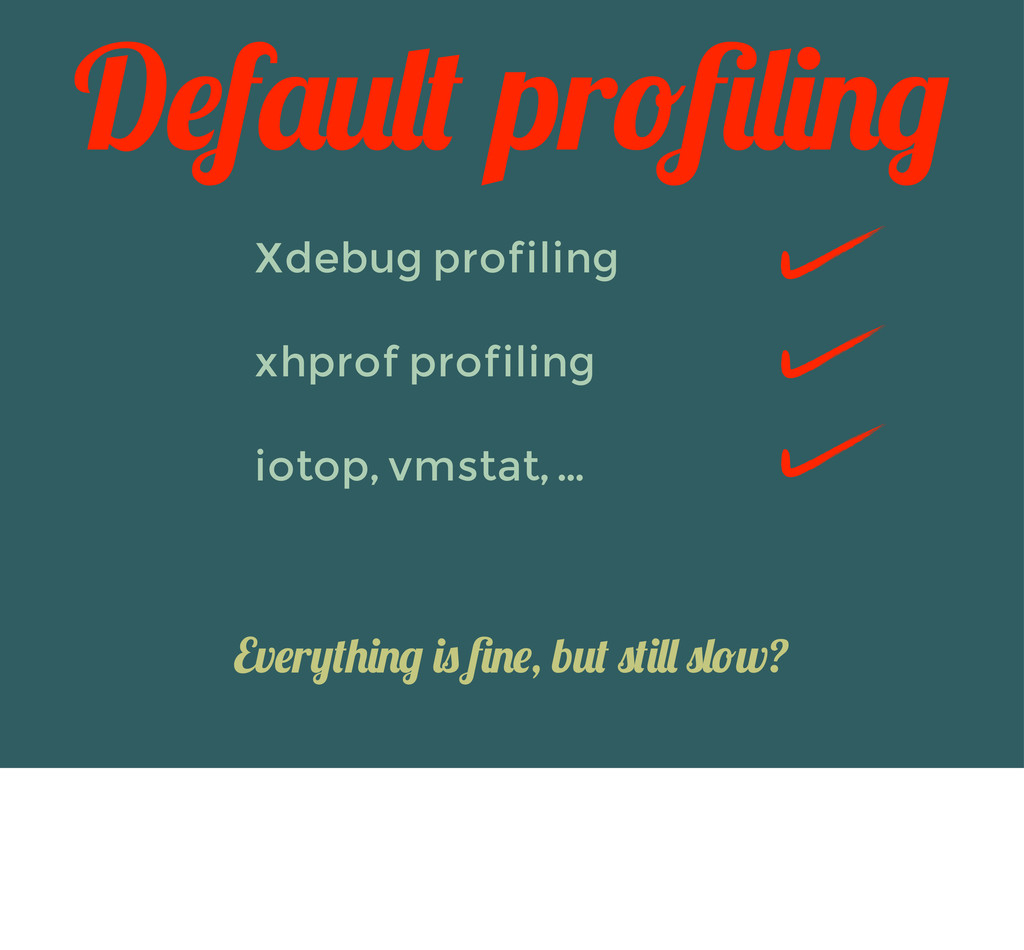
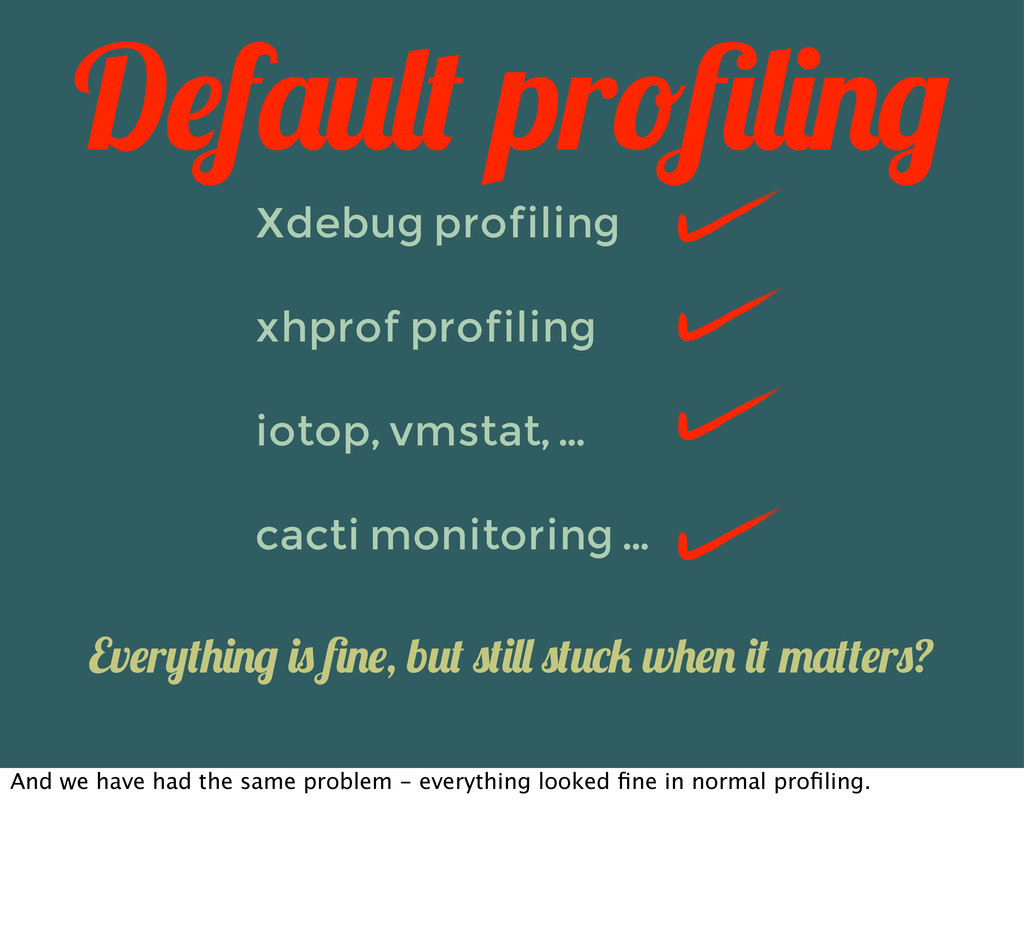
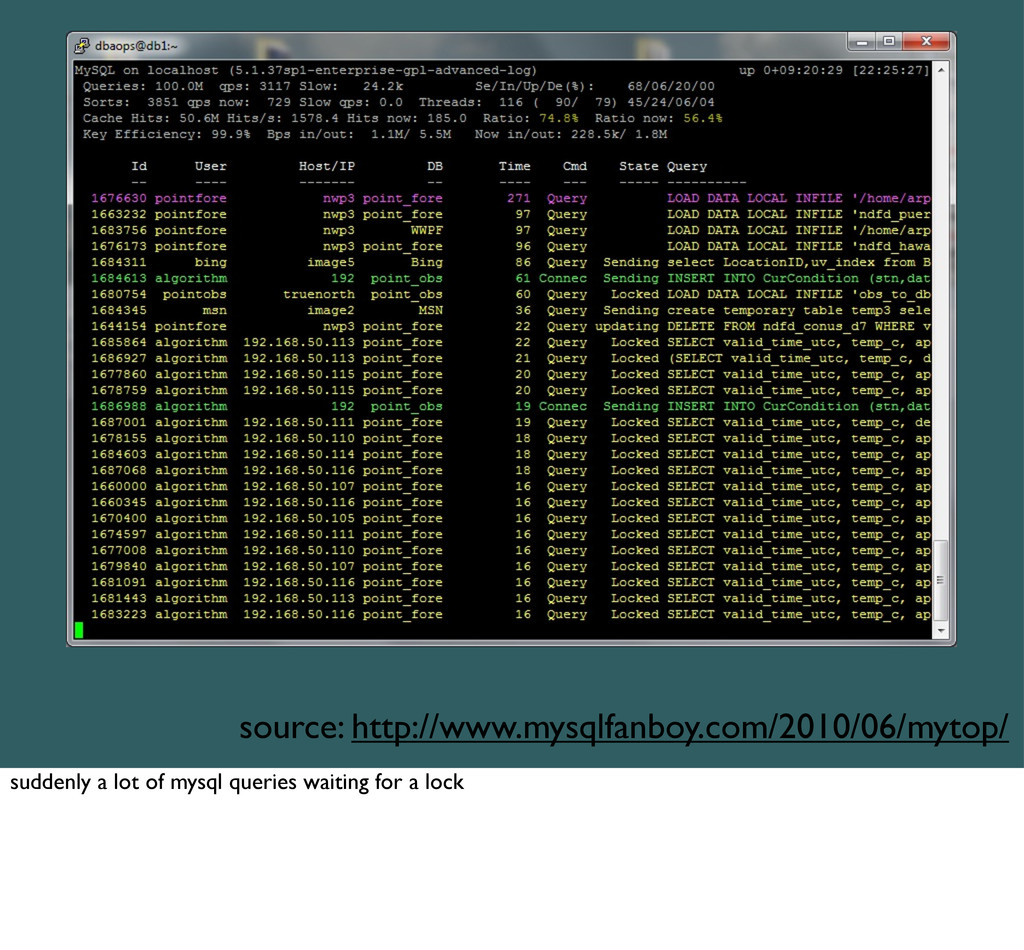
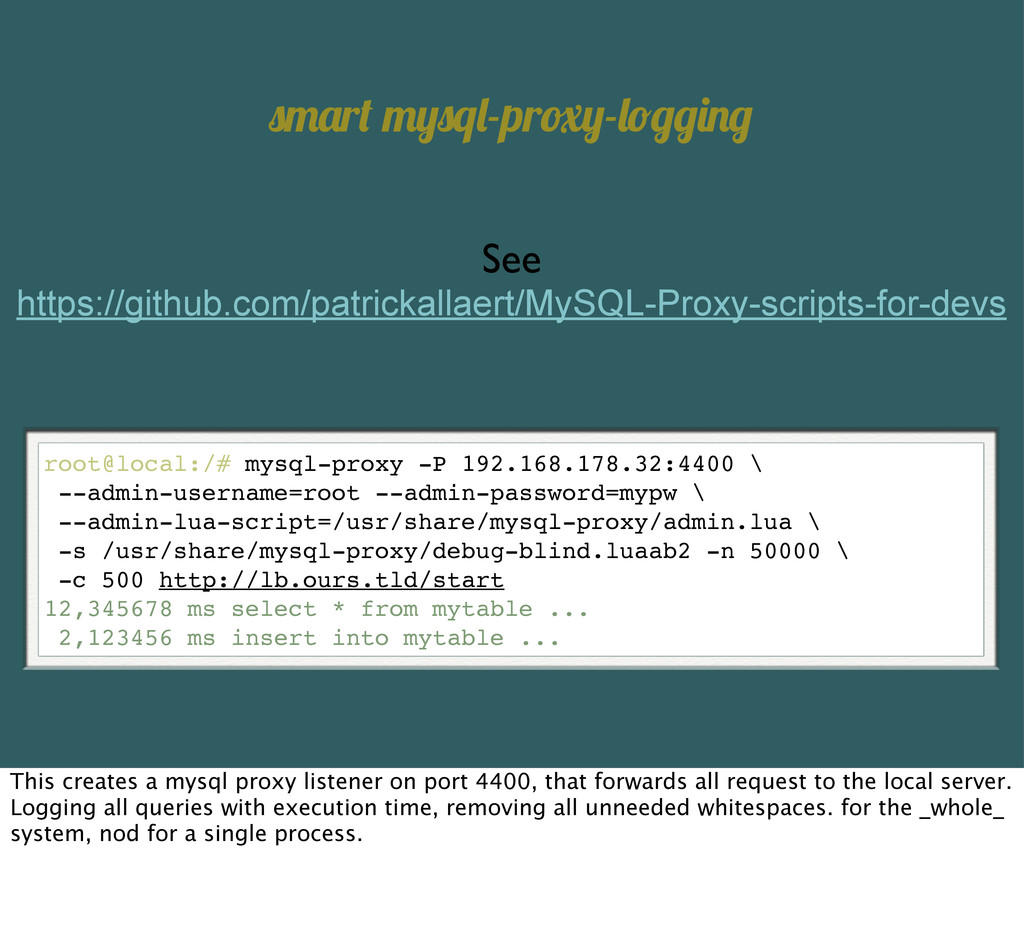
If you profile your applications, symfonys builtin profiler, the web debug bar and the xhprof bundle provide a lot of service to introspect your application. But what happens if you can't optimize your php code anymore? If there is no clear bottleneck inside the database or in the php code? If the system only slows down under certain, "phase of the moon" circumstances? This talk shows profiling solutions beyond sql-logs, xdebug and xhprof. It demonstrates how to get an overview of everything that happens inside your webserver or database nodes. Tools like cachegrind, callgrind, sysprof, mytop and perf are shown.

Johann-Peter Hartmann

November 22, 2012
Tweet

More Decks by Johann-Peter Hartmann

Other Decks in Technology

Transcript

  1. L&'‘$ w(%' #"'%) &v&r*b!+* %$ $&('&+ - !r )&, :-)

    Let‘s wait until everybody is here. Actually i haven‘t enough slides, so i try to spend some time useless slides.
  2. H%, -r&(' '! $&& Y!# .&r&! A, so that‘s why

    we waited. Great you came, too.
  3. Y&(., % (0 '%r&+, '!! Yep, me too. That‘s the

    bad thing about berlin. In munich - where i am from - you get enough sleep because there is no
  4. W%'. ( $.!r' $'!r*. I am old. And you know

    what old people do. They tell you war stories
  5. Big On-Demand V%+&! S'r&(0%"- Platform It was one of the

    first video on demand platforms around. Large scale, with some unique licensed live events that were only streamed using this platform.
  6. B($&+ !" (" &"'&rpr%$& &1!00&r1& $!)#'%!" To build a solid

    solution they decided to use an enterprise ecommerce solution as the core. So basic performance problems shouldn‘t happen, since it was already enterprise.
  7. W& (r& pr!f&$$%!"()$! The other reason it should scale was

    us. they wanted to have mayflower in the team to care about performance und scaling issues.
  8. Server Setup +!"& r%-.' So we cared about the server

    setup. We implemented a small testing environment, benchmarked the resource usage and calculated that we‘d need 12 4-core machines for a start.
  9. Performance Testing +!"& r%-.', '!! When the cluster was ready.

    We did a classic check to see if it does scale.
  10. root@local:/# ab2 -n 50000 -c 500 http://lb.ours.tld/start This is ApacheBench,

    Version 2.3 <$Revision: 655654 $> Copyright 1996 Adam Twiss, Zeus Technology Ltd, http:// www.zeustech.net/ Licensed to The Apache Software Foundation, http:// www.apache.org/ ... Requests per second: A_LOT [#/sec] (mean) Time per request: REALLY_FAST [ms] (mean) Time per request: EVEN_FASTER [ms] (mean, across all concurrent requests) We first run Apache-Bench. Everything looked pretty good.
  11. C)!#+ Pr!3&1' 100% Hipster It was a classic hipster cloud

    project. Yes, there is a memcache, a rabbitmq,mogilefs, ejabberd, varnish, nginx and cloud! Uh, and a deployment pipeline, of course, all managed by puppet.
  12. I"'&r"() C)!#+ We started on our internal cloud - based

    on eucalyptus 1.6. Anybody else worked with eucalyptus? Hate it? However, we developed it there. It was fast and snappy. We were happy, and so was our customer.
  13. At some day it went live, and it worked great.

    Just like we expected it to work. Just a bit less snappy. Responsivity wasn‘t as good.
  14. F$1/%"- S)!w Actually, it was very slow, more than 2

    seconds for the start page, more than a second for every logged in page.
  15. P&rf!r0("1& Op'%04('%!" FTW! MemCache APC ORM-Level-Caching Template-Caching So we did

    a lot of work. There was a caching-layer. And another one to support it. And one in the ORM. And one for the database data. And so on.
  16. S'%)) $)!!!!!!w. But it still was slow. We tried it

    again at our local cloud, where it was fast.
  17. T&$': Put it on 1 Laptop So we took an

    really old Lenovo R61 Laptop, and installed everything on it. MySQL, MogileFS, RabbitMQ, eJabberD, and the whole set of production data.
  18. B)5%"-)* f($' (-(%". And it was blazingly fast again. On

    a laptop, with 4G ram, not even a SSD was installed.
  19. And we were like „What the fuck?“ This was a

    solid medium sized amazon ec2 installation, mostly based on large vms. and it was slower than an old laptop?
  20. S!, '.('‘$ w.(' '.%$ '()/ %$ (b!#'. Stuff about profiling

    we never wanted to know. That were the stories i wanted to tell. It‘s about the things i never wanted to know about profiling
  21. J!.(""-P&'&r H(r'0("": H(1/&r-'#r"&+-M("(-&r H(1/&r (' .&(r'. C!0p("*: M(*6!w&r G0bH (f!#"+&+

    S&/'%!"E%"$ G0bH, '!!) I am actually an old school php hacker, i even did a talk at the first php conference ever in 2000. Now i am the CTO of mayflower gmbh, we do php development. a number of php release manager has been working for our company. we love php. I founded sektioneins together with stefan esser, too. Ask me about security.
  22. A"+ '.%$ %$ !#r )!-! +!"& w%'. b(1!". And this

    is the mayflower logo, done with bacon! We do agile, devops, slacktime with nodecopter projects.
  23. Ev&r* "&w %0p!r'("' pr!3&1' %$ +!"& w%'. $*0f!"* 2. We

    do every new, important project with symfony 2.
  24. S*0f!"* 2: I‘v& -!' !")* b($%1 /"!w)&+-& S*0f!"* CMF $("+b7

    w($ '.& !ffi1%() )(b r(' f!r '.%$ '()/ But i don‘t know a lot about it. My colleagues do, like paul, who is going to do a short talk about fancy reactive programming symfony stutt tomorrow.
  25. Z&"+ Fr(0&w!r/ 1: ( )!' !f /"!w)&+-& i did a

    lot of stuff with zend framework, though, maybe that‘s the reason i end up with a profiling talk here :-) For sure it‘s one of the reasons we do symfony now :-)
  26. Pr!2)%"- Who in here uses the zend Profiler? Who uses

    XDebug? Who xhprof? Symfony web debug toolbar? Web Debug toolbar with xhprof? Server site profiling like Valgrind? Sysprof? oprofile?
  27. T! 2-#r& !#' .!w '! $#rv%v& '.& )(#"1. / #p+('&

    / "&w p!p#)(r%'* Reason No 1 First, you really want to survive the launch. or a new version update. or a tv spot for your website tonight.
  28. Reason No 2 T! 2-#r& !#' w.* *!# +%+ "!'

    $#rv%v& '.& )(#"1. / #p+('& / "&w p!p#)(r%'* Second reason: you want to know why it did not work out.
  29. The first moment You are certain about your applications performance

    is one day after the launch 9& #-)* 'r#'. (b!#' pr!2)%"-: The bad thing about profiling is that you really, really want to know if your website stays online, all of your customers are happy and everything is up and running. Even with a television campaign. But you won‘t get a guarantee anyway, and in fact everybody knows this.
  30. 9('$ w.* *!#r b:$ '.%"/$ %'‘$ '.& r&$p!"$%b%)%'* !f '.&

    $!,w(r& -#*$. And that‘s why your boss thinks you are the one to blame. Maybe some very stupid feature just needs a lot of computation work to be done, the reason for a bad responsivity of the server is always slow code, not a slow feature.
  31. 9('$ w.* *!# '.%"/ %'‘$ '.& r&$p!"$%b%)%'* !f '.& !p&r('%!"

    -#*$. And, of course, there is the operations team and the operations infrastructure. If the system slows down, it‘s their job to make it fast again. So if their hardware is not fast enough, they should get some faster iron.
  32. O" '.& !'.&r .("+ $%+&, '.& !p&r('%!" -#*$ '.%"/ '.&

    +&v&)!p&r$ +!"‘' 1(r& (b!#' p&rf!r0("1& ("*w(*. On the other hand site the ops guys thinks that the software developers simply write slow code. which, in a lot of cases, they actually do.
  33. W& +! 300 R&q/$! And we do a little benchmark

    based on apachebench. And we prove that we are able to service 300 requests in one second. How great we are!
  34. U")&$$ $!0&b!+* ... ... .(1/&+ *!#r "&'w!r/ ... $'(r'&+ 50

    w30 %" p(r())&) ("+ ... pr&$$&+ „r&)!(+“ 6 '%0&$ ( $&1!"+
  35. 1 Real Test Scenario B&1(#$& 1 r&q#&$' != 1 !#'

    !f 1000 r&q#&$'$ First you need a test scenario that is close to your current or expected reality.
  36. 1 JMeter Virtual Users (Personas) First: use a proper Load

    generation tool like jmeter, webload, silk performer or similar. Create different thread groups . Personas: In marketing and user-centered design, personas are fictional characters created to represent the different user types within a targeted demographic, attitude and/or behavior set that might use a site, brand or product in a similar way.
  37. 1 If *!#‘r& ()r&(+* !")%"& If you already launched it‘s

    easy to answer. Simply take a look at your existing web traffic.
  38. W&bA"()*'%1$ f!r V()%+('%!" Google Analytics Webalizer Analog AWStats If you

    already know what is happening on your website: great.Just do a webalizer or analogue run on the access_log of a normal hour, and another one done with your benchmark. If the result looks similar, you are generating the right kind of traffic.
  39. C!rr&)('%!": 99,5% In a few cases we did some validation

    using proper statistics, where we did analyzed the correlation.
  40. 1 If *!# .(v&"‘' )(#"1.&+ *&' If you haven‘t got

    any data, and we are not talking about an intranet application for exactly 50 people who start working at 9 am, than you have to guess was is going to happen
  41. 1 Create Scenarios based on Personas: 1 Worst Case Users

    doing all the expensive stuff 2 Expected Average „Normal“ user behavior Since you don‘t know where you are going to end up, simply create 3 scenarios that try to show the range of your applications performance.
  42. Monitoring C(1'% 1 M#"%" JM&'&r-P&rf0!" On the other hand side

    you need to figure out what happens on the server side. Maybe you already got a monitoring solution installed, like cacti or munin. Cacti anybody? Planning to change? Jmeter provides an agent based monitoring solution, it‘s part of the jmeter plugin package.
  43. Interesting Stuff CPU User, System, IOWait, Interrupts, Context switches, Forks

    M&0!r* PageFaults, Swap, Free Memory IO Network,Connections, Harddisk, SSD
  44. A lot of consoles. And of course a lot of

    consoles. To monitor everything. I am not talking about game consoles, btw. :_
  45. top iotop vmstat sysprof T!!)$ '! +! $!0& ("()*$%$: Top

    - everybody should know this one. iotop: a small python script, already part of all mayor distributions vmstat display was originally about virtual memory statistics (hence the name), but does processes, interrupts, paging, block io and a lot of device statistics as well. Sysprof is a statistical, systemwide profiler i‘ll show later.
  46. Ramp up? app/console does the cache warming! Now test all

    your scenarios. you don‘t need any ramp up since your favourite framework already does the cache warmup :-)
  47. Application still works System is stable Good service quality P:%'%v&

    !#'1!0& Maybe there is some high load at the beginning, but maybe the systems get stable again. If everything is alright, we probably bought too much hardware.
  48. N!w w& .(v& ( $&'#p f!r r&()%$'%1 pr!2)%"- But that‘s

    cool, that‘s the perfect starting point for realistic profiling.
  49. Application still works System is stable Good service quality N&-('%v&

    !#'1!0& But what happens if it goes wrong? if we are not able to provide the scalability or responsitivity needed?
  50. N!w w& .(v& ( "&&+ f!r r&()%$'%1 pr!2)%"- Now we

    have to do some profiling anyway :-)
  51. H&*, %'‘$ ()r&(+* %" 0* IDE! A"+ !" 0* Server!

    Default By default you do the profiling while development in your IDE. Who has a profiler enabled? On your local or on a close-to-production system? Lets have a closer look.
  52. Ev&r*'.%"- %$ #p '! 12 '%0&$ $)!w&r B#' .&*, %'‘$

    r&)('%v& p&rf!r0("1&! A' )&($' '.('‘$ w.(' !#r b&"1.0(r/$ '&)). We did some benchmarking in different environments, and the slowdown caused by xdebug was up to 12 times. That‘s quite a big difference. Now you could say: yeah, but that is just relative.
  53. 20 0$ +('(b($& q#&r* %" ( 100 0$ r&q#&$' v$

    20 0$ +('(b($& q#&r* %" ( 1.200 0$ r&q#&$' 20% vs 1.6 % The problem is, that this makes it close to impossible to find race conditions. or to measure the influence of external inout. See the example: a slow query my result in 20% of the request time, or in below 2% in yur profiling environment.
  54. H&*, %'‘$ '.& A#'!)!(+&r! What does really happen in your

    application? So, what does really happen in your application. You can see it here - xdebugs callgrind- format export. Who knows this one? Obviously most of the time is spend inside the autoloader. That‘s wellknown, i know. So, do we know everything that is happening there?
  55. Wall Clock Time W& /"!w '.(' '%0& w($ $p&"', b#'

    w& +!"‘' /"!w .!w '.& '%0& w($ $p&"' xdebug measures wall clock time, and that is fine. but that means you only know that time was spent, not how it was spent.
  56. I"$'()) v()-r%"+ ("+ ()) "&&+&+ +&b#--%"--$*0b!)$ $'(r' '.& 30&'&r '&$'

    r#" !"& (p(1.& 1.%)+ $&p(r('&)* valgrind --tool=callgrind /usr/sbin/apache2 -f /etc/apache2/apache2_single.conf -X So let‘s have a look at valgrind / callgrind /cachegrind. It‘s nice to have all debugging symbols installed to see what‘s happening. Start a single apache child in valgrind while the jmeter test is running. Attention: this single request is a lot slower, just like xdebug.
  57. H&*, %'‘$ '.& P(r$&r! What does really happen in your

    application? Again we see what really happens - now most of the (self) time is spend inside the parser.
  58. APC FTW! Luckily both issues can be fixed with APC

    and the ApcUniversalClassLoader
  59. Sysprof Pr!2)%"- '.& &"'%r& )%"< $*$'&0, #$&r- ("+ /&r"&)$p(1& f($'

    pr!2)&r w%'. )!w 2"-&rpr%"' Sysprof tells you about everything that is happening inside your cpu. and, the performance impact is okeyish
  60. root@local:/# sysprof-cli myoutfile ... wait some seconds to gather enough

    data ... ... stop with ctrl-c when you are done ... root@local:/# sysprof myoutfile And that‘s how it works: when the jmeter test is running, sysprof-cli is started for some time. It‘s stopped with ctrl-c and writes the data to the filesystem. this file can be viewed with sysprof itself, which is a X11 software.
  61. 18% of the time spent to look at the watch?!

    T&$' r#" w%'. =+&b#- )!(+&+ Most of the time is spent within PHP, and that‘s expected to happe. but half of the time is spent within gettimeofday, a system call that is rather slow, especially when used in 32bit environments. so 18% of the whole cpu time is used to look at the wallclock.
  62. root@local:/# perf record -a -F 10000 sleep 60 ... creates

    600.000 samples ... ... saving result in perf.data ... root@local:/# perf report Because the memory bus is slow ...
  63. page_fault is the reason?! $*$pr!f R&($!": XEN 0&0!r* $.(r%"- !"

    (05!" &12 We saw a lot of page_faults. but there was no swapping. So this should not happen?! _very_ expensive page_faults due to memory sharing in XEN Solution: memory sharing, pages marked as read_only -> page_fault and this very page_fault was slow in 32bit guests in 64bit hosts.
  64. Everything was 2"&. Until 10 minutes before the life event.

    Then everything was $'#1/. You remember? Where we went not only live, but dead.
  65. Xdebug profiling xhprof profiling iotop, vmstat, ... cacti monitoring ...

    D&f(#)' pr!2)%"- Ev&r*'.%"- %$ 2"&, b#' $'%)) $'#1/ w.&" %' 0(''&r$? And we have had the same problem - everything looked fine in normal profiling.
  66. 50 terminals running top, atop, htop, iotop, mytop etc W(%'

    f!r 'r!#b)& And we waited, and when the next wave hit us we could see it in mytop: next slide
  67. $0(r' 0*$q)-pr7*-)!--%"- See https://github.com/patrickallaert/MySQL-Proxy-scripts-for-devs root@local:/# mysql-proxy -P 192.168.178.32:4400 \ --admin-username=root

    --admin-password=mypw \ --admin-lua-script=/usr/share/mysql-proxy/admin.lua \ -s /usr/share/mysql-proxy/debug-blind.luaab2 -n 50000 \ -c 500 http://lb.ours.tld/start 12,345678 ms select * from mytable ... 2,123456 ms insert into mytable ... This creates a mysql proxy listener on port 4400, that forwards all request to the local server. Logging all queries with execution time, removing all unneeded whitespaces. for the _whole_ system, nod for a single process.
  68. > 500 r&-%$'&r%"- ("+ > 1000 )!--%"- %" #$&r$ %"

    '.& $(0& 0%"#'& == T(b)& )!1/#p (Yep, solution was simple: MyISAM -> InnoDB)
  69. O'.&r w(r $'!r%&$: IBM /&r"&) 0!+#)& $1r&w%"- IO %" 1!"1#rr&"1*,

    b#' .%+%"- ("* %!w(%' I"-0&0!r*-C(1.%"- )(*&r$ +!&$ 0!r& b(+ '.(" -!!+ We‘ve got more war stories of this kind, mostly fixed with tools like oprofile, sysprof, vmstat and the like.
  70. W.* $.!#)+ % 1(r&? B&1(#$&: T!+(*$ $*$'&0 (r1.%'&1'#r& %$ 1r&('&+

    b* +&v&)!p&r$ D&vOp$: Y!# (r& r&$p!"$%b)& f!r pr!+#1'%!", '!! Y!# 1("‘' ; ( !p&r('%!"() b#- 1(#$&+ b* (pp)%1('%!" 1!+& !'.&rw%$& Now you might ask: why should i care? i am a developer, not a system administrator? Because:
  71. Setup: Symfony CMF sandbox 1400 requests with concurrency 20 W.('‘$

    %" f!r *!#? A recommended setup (but not very surprising)
  72. 0 1250 2500 3750 5000 Low Average High Pure PHP

    With APC With Xdebug 6 APC With APC, with New Relic With APC,XHProf 2698 new relic is too slow for production right now.