Upgrade to Pro — share decks privately, control downloads, hide ads and more …

Embracing Performance Optimization

Jon Bellah
October 08, 2013

Embracing Performance Optimization

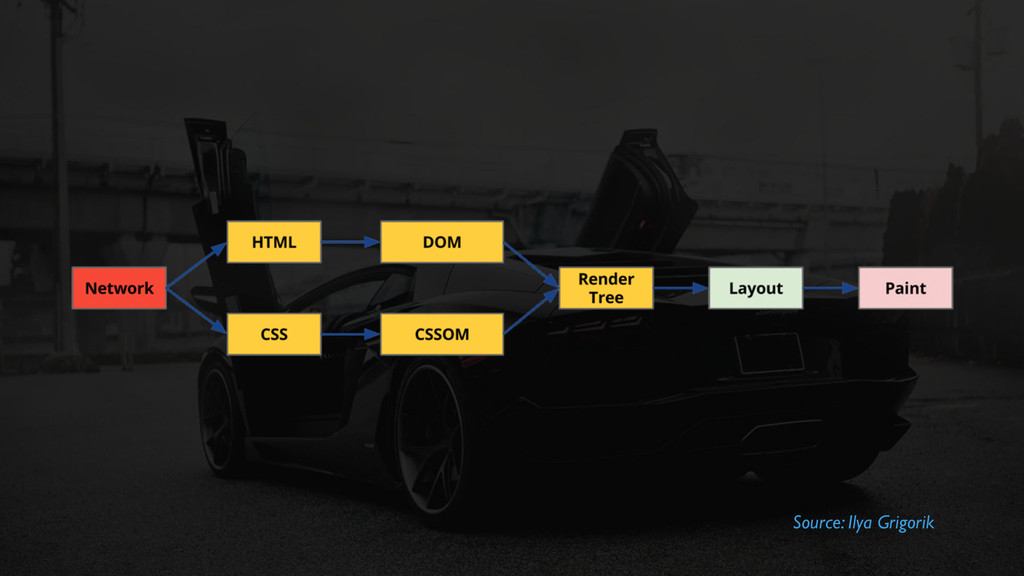
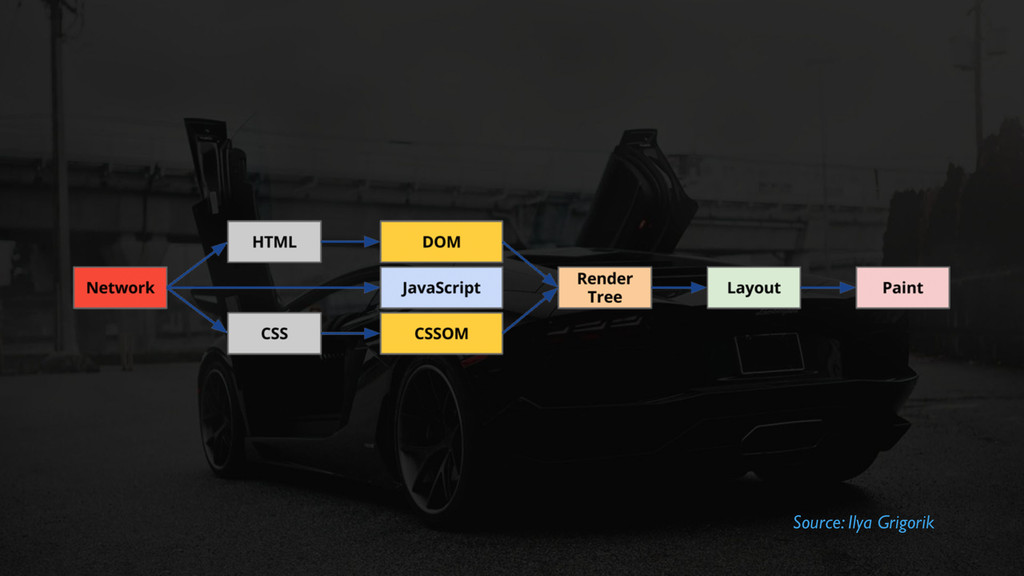
Optimizing the critical rendering path, eliminating unnecessary roundtrips, and employing other optimization tactics can have a huge impact on scalability, user experience and your bottom line. In this session, we'll take a look at some of the ways you can improve the performance of your websites.

Jon Bellah

October 08, 2013
Tweet

More Decks by Jon Bellah

Other Decks in Programming

Transcript

  1. Embracing Performance Optimization
    making the web faster

    View Slide

  2. @jonbellah

    View Slide

  3. What is performance optimization?
    The science of making websites faster.

    View Slide

  4. Perceived speed vs. Actual speed

    View Slide

  5. 3 Critical Limits
    • 0.1 Second - limit for having the user feel the system is reacting.
    • 1.0 Second - limit for the users flow of thought to remain
    uninterrupted.
    • 10 Seconds - limit for keeping the users attention on the dialogue.
    Source: Nielsen Norman Group, 1993

    View Slide

  6. How does performance affect
    the bottom line?

    View Slide

  7. • Increased search results from 10 to 30.
    • Load speed went from 0.4s to 0.9s.
    • Traffic and revenue from searchers in the experimental group dropped
    by 20%.
    Source: Marissa Mayer, 2006 Web 2.0 Conference
    Google Experiment

    View Slide

  8. • Reduced Google Maps payload by 30%.
    • Resulted in a 30% increase in requests.
    Source: Marissa Mayer, 2008 Google I/O
    Google Maps Optimization

    View Slide

  9. • Predicted that a 1 second reduction in load speed would improve
    downloads and conversions by 2.7%.
    • In reality, they reduced page load speed by 2.2 seconds and saw a
    15.4% increase in downloads and conversions.
    • With 275,000 daily visitors, that increase translated into over 10
    million extra downloads every year.
    Source: Mozilla Blog, 2010
    Mozilla Performance Optimization

    View Slide

  10. What is our benchmark?
    Sub-second rendering.

    View Slide

  11. The Critical Rendering Path
    The users path from following a link to the first
    impression to the working experience.

    View Slide

  12. Source: Ilya Grigorik

    View Slide

  13. Source: Ilya Grigorik

    View Slide

  14. The Overview

    View Slide

  15. • Minimize requests and round-trip times.
    • Optimize the critical rendering path.
    • Leverage browser caching.
    • Reduce payload.
    • Compress and serve scaled images.
    • Maximize parallelization.
    • Prefetch resources.
    Performance Optimization Overview

    View Slide

  16. Minimize Requests and Round-trip Times

    View Slide

  17. • Initial connection requires a minimum of 3 RTTs (1 for DNS, 1 for
    TCP connection, 1 for HTTP request).
    • The server can only send ~14kb in the first round-trip.
    • Avoid redirects.
    • Concatenate CSS and JavaScript to reduce requests.
    Minimize Round-trip Times (RTTs)

    View Slide

  18. View Slide

  19. Optimize the Critical Rendering Path

    View Slide

  20. • Allows the page to render progressively.
    • Scripts block subsequent downloads, but those already in progress will
    continue.
    • Browsers can’t process CSS incrementally, so it all needs to arrive
    before the browser begins to paint.
    CSS at the top, JavaScript at the bottom

    View Slide

  21. View Slide

  22. • Don’t load CSS from an asset domain.
    • Avoid duplicate rulesets and otherwise bloated CSS.
    • Don’t use @import in CSS, each occurrence is a new HTTP request.
    • Inline CSS above-the-fold.
    Optimizing CSS

    View Slide

  23. View Slide

  24. X

    View Slide

  25. Leverage Browser Caching

    View Slide

  26. • Cache rules everything around me.
    Leverage Browser Caching

    View Slide

  27. View Slide

  28. • Cache rules everything around me.
    Leverage Browser Caching
    • Cache resources using far-future Expires or Cache-control max-age
    headers.
    • Specify a Last-Modified or ETag for each cacheable resource.
    • Load major libraries from Google Hosted Libraries.

    View Slide

  29. Text
    ExpiresActive On
    ExpiresByType text/html "access plus 1 day"
    ExpiresByType image/gif "access plus 10 years"
    ExpiresByType image/jpeg "access plus 10 years"
    ExpiresByType image/png "access plus 10 years"
    ExpiresByType text/css "access plus 10 years"
    ExpiresByType text/javascript "access plus 10 years"
    ExpiresByType application/x-javascript "access plus 10 years"

    View Slide

  30. Reduce Payload

    View Slide

  31. • Gzip compresses based on repeated or repeatable strings.
    • Generally reduces file size by around 70%.
    • Minifying removes unnecessary comments and spacing, reducing
    overall file size.
    Reduce Payload

    View Slide

  32. Compress and Scale Images

    View Slide

  33. • Sprites.
    • 220% JPEG at 0 quality.
    • Picturefill /
    • Srcset
    Compress and Serve Scaled Images

    View Slide

  34. • Baseline renders top-to-bottom.
    Baseline vs. Progressive JPEGs

    View Slide

  35. View Slide

  36. • Baseline renders top-to-bottom.
    Baseline vs. Progressive JPEGs
    • Progressive renders layered scans of increasing quality.
    • Perceived Speed vs. Actual Speed

    View Slide

  37. Maximize Parallelization

    View Slide

  38. • HTTP/1.1 suggests that browsers only download two components in
    parallel per hostname.
    • Asset domains allows you to fetch more resources in parallel.
    Maximize Parallelization

    View Slide

  39. Prefetch Resources

    View Slide

  40. • Lets you tell the browser to start fetching a DNS a fraction of a
    second before it’s needed.
    • Especially helpful in combination with the look-ahead preloader.
    Prefetching Resources

    View Slide

  41. How do we test all this stuff?

    View Slide

  42. Waterfalls
    Allow you to see the series of actions that occur
    between a user and your server in order for a user
    to view a page.

    View Slide

  43. View Slide

  44. View Slide

  45. Real User Monitoring (RUM)
    Captures time spent on front-end and back-end,
    geographic origin, browser type and version, and
    many other performance-related metrics.

    View Slide

  46. • PageSpeed Insights
    • Y-Slow
    • Pingdom
    Other Performance Testing Tools

    View Slide

  47. Questions?

    View Slide