Upgrade to Pro — share decks privately, control downloads, hide ads and more …

Performance Improvements in Kubernetes

Performance Improvements in Kubernetes

Hongchao Deng presents methods and measurements of making Kubernetes faster at the CoreOS SF Meetup, March 10, 2016.

Josh Wood

March 10, 2016
Tweet

More Decks by Josh Wood

Other Decks in Technology

Transcript

  1. Kubernetes Overview • Runs and manages containers • Inspired and

    informed by Google’s Borg • Supports multiple container runtimes (docker, rkt) • Open source, written in Go
  2. Feature Highlights • Service ◦ A group of backend pods

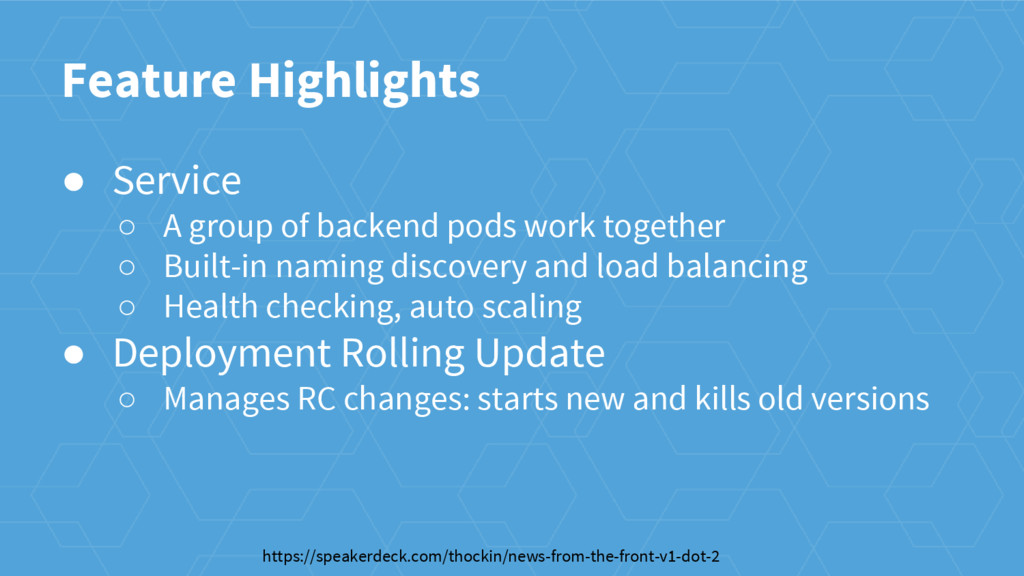
    work together ◦ Built-in naming discovery and load balancing ◦ Health checking, auto scaling • Deployment Rolling Update ◦ Manages RC changes: starts new and kills old versions https://speakerdeck.com/thockin/news-from-the-front-v1-dot-2
  3. Kubernetes Architecture • Scheduler: ◦ make decisions of binding pods

    to nodes • API Server: ◦ REST services, cluster states
  4. Questions • What are the current performance metrics of large

    cluster? • Where are the bottlenecks? Specifically, we want to know any inefficient code paths that became the bottlenecks.
  5. Testing Strategy • Simulated Experiment ◦ Reproducible ◦ Specific target

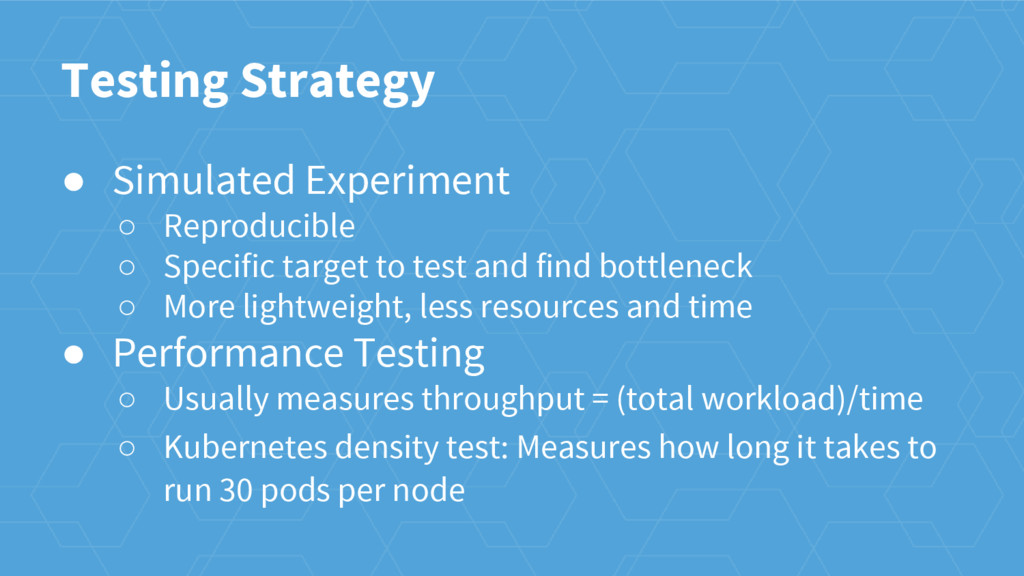
    to test and find bottleneck ◦ More lightweight, less resources and time • Performance Testing ◦ Usually measures throughput = (total workload)/time ◦ Kubernetes density test: Measures how long it takes to run 30 pods per node
  6. Density Test Pods: 229 out of 3000 created, 211 running,

    18 pending, 0 waiting Pods: 429 out of 3000 created, 412 running, 17 pending, 0 waiting Pods: 622 out of 3000 created, 604 running, 17 pending, 1 waiting ... Pods: 2578 out of 3000 created, 2561 running, 17 pending, 0 waiting Pods: 2779 out of 3000 created, 2761 running, 18 pending, 0 waiting Pods: 2979 out of 3000 created, 2962 running, 16 pending, 1 waiting Pods: 3000 out of 3000 created, 3000 running, 0 pending, 0 waiting
  7. • Hardware ◦ Perhaps a hardware resource was starved ◦

    If it was, we could improve the performance by simply adding more resources Performance Debugging
  8. Top None of the physical resources were fully utilized. This

    implied the bottleneck was a software issue.
  9. • Hardware • Metrics ◦ A convenient view into the

    system ◦ Latency metrics can help us find low hanging fruit ◦ Add more metrics to narrow down problem scope Performance Debugging
  10. Prometheus Metrics # HELP scheduler_e2e_scheduling_latency_microseconds E2e scheduling ... # TYPE

    scheduler_e2e_scheduling_latency_microseconds summary scheduler_e2e_scheduling_latency_microseconds{quantile="0.5"} 23207 scheduler_e2e_scheduling_latency_microseconds{quantile="0.9"} 35112 scheduler_e2e_scheduling_latency_microseconds{quantile="0.99"} 40268
  11. CreatePod() ReplicaSetController API Server REST For Client Latency: 1ms Scheduler

    Client CreatePod() Usual Latency: 1ms Spike Latency: 50ms Scheduling Latency: 7ms Poll Pods: Latency: 1ms
  12. CreatePod() ReplicaSetController API Server REST For Client Latency: 1ms Scheduler

    Client CreatePod() Usual Latency: 1ms Spike Latency: 50ms Scheduling Latency: 7ms Poll Pods: Latency: 1ms
  13. Digging Further • Problems with metrics ◦ Coarse-grained • We

    don’t want to read the entire codebase and imagine the runtime performance
  14. Performance Debugging • Hardware • Metrics • Fine-grained Profiling ◦

    Profiling provides insights into where cpu or memory was spent ◦ Trivial to do in Go
  15. Improve Perf By Profiling • The issues we used profiling

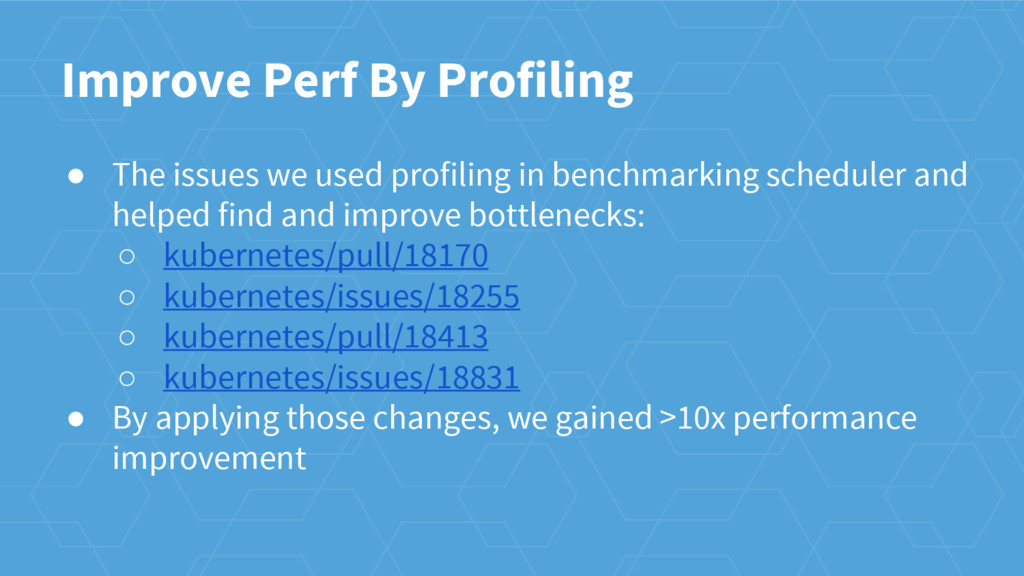
    in benchmarking scheduler and helped find and improve bottlenecks: ◦ kubernetes/pull/18170 ◦ kubernetes/issues/18255 ◦ kubernetes/pull/18413 ◦ kubernetes/issues/18831 • By applying those changes, we gained >10x performance improvement
  16. Performance Debugging • Hardware • Metrics • Fine-grained Profiling •

    Remote Profiling ◦ Get realtime profiling when server is running
  17. Main Steps • Enable profiling in server code ◦ https://golang.org/pkg/net/http/pprof/

    • Allow profiling port (6060) in firewall rules • go tool pprof ${URL} ◦ Windowed profiling result
  18. Benchmark VS Remote • Benchmark profiling ◦ Whole time ◦

    Write benchmark if needed ◦ Reproducible • Remote profiling ◦ Realtime ◦ Add code to enable profiling ◦ Not sure
  19. Takeaway • Check hardware first • Metrics provide a convenient

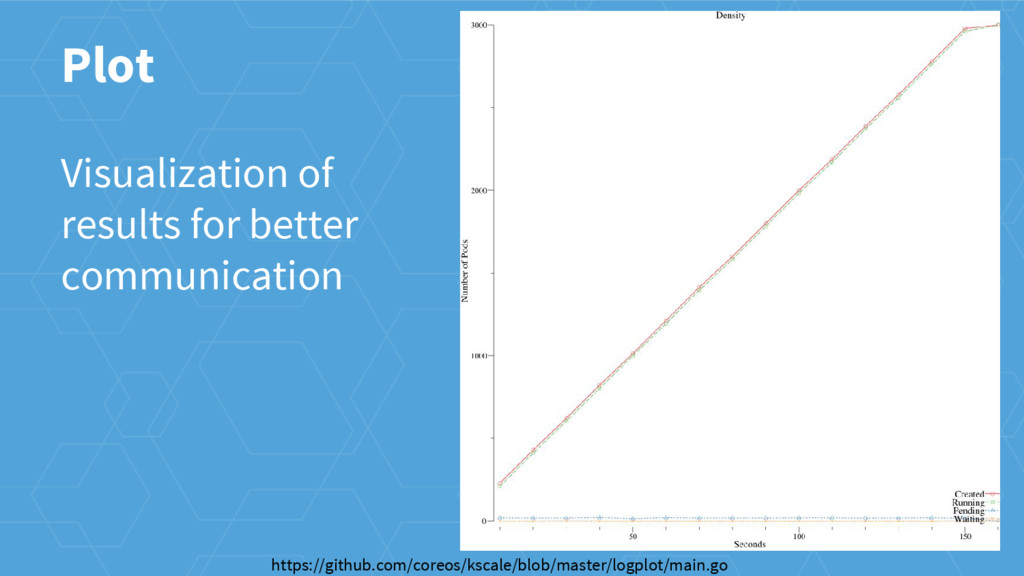
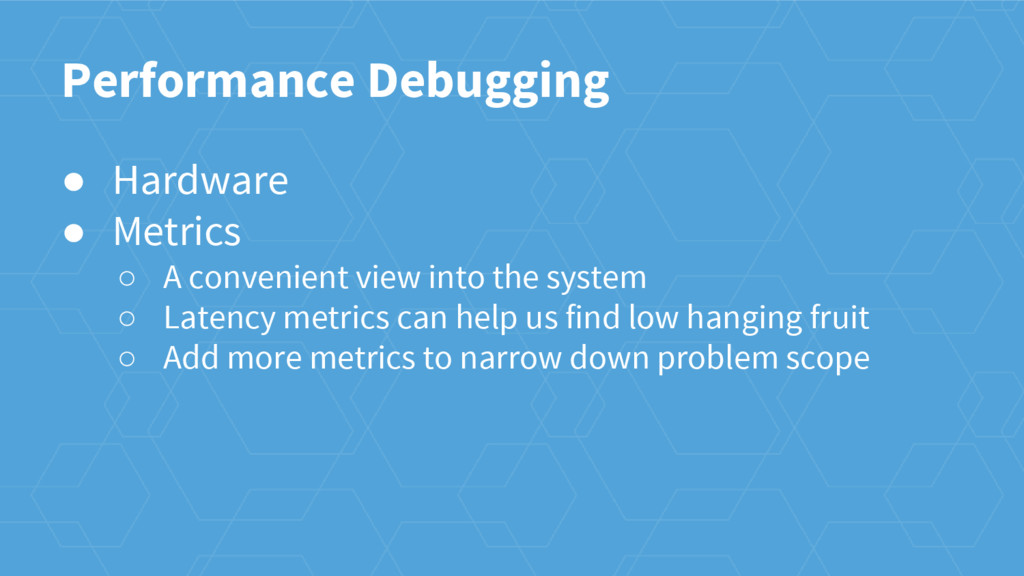
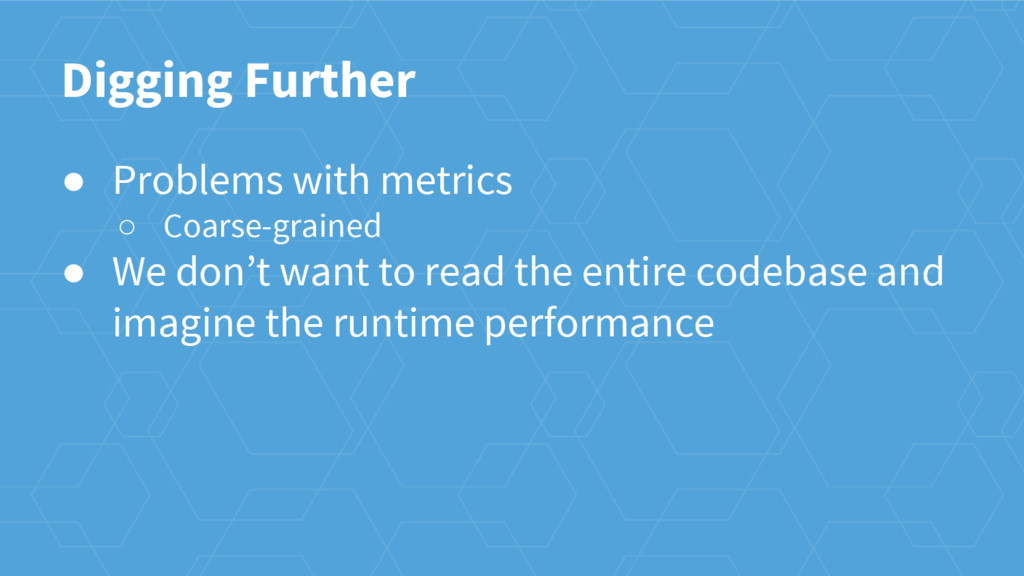
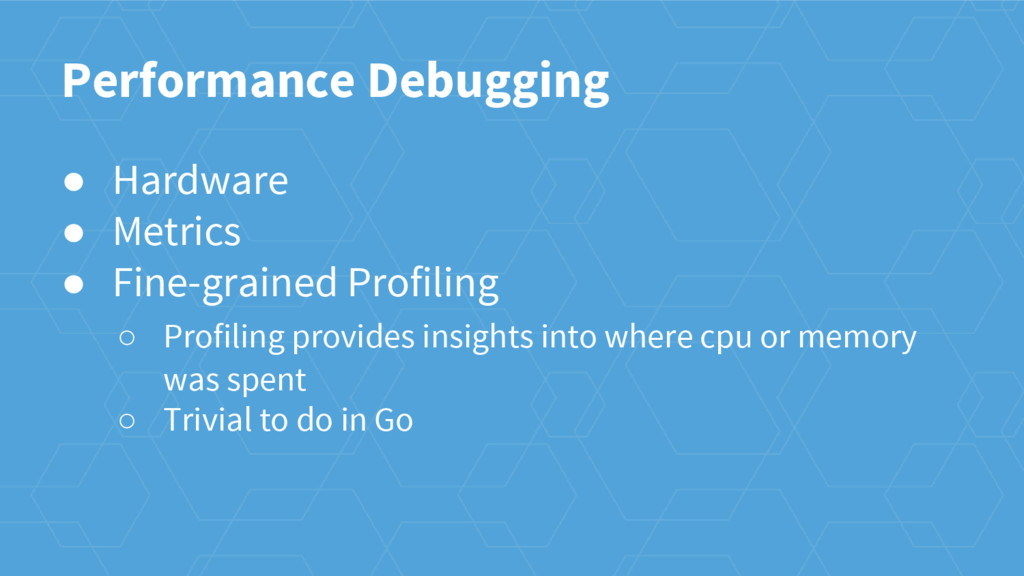
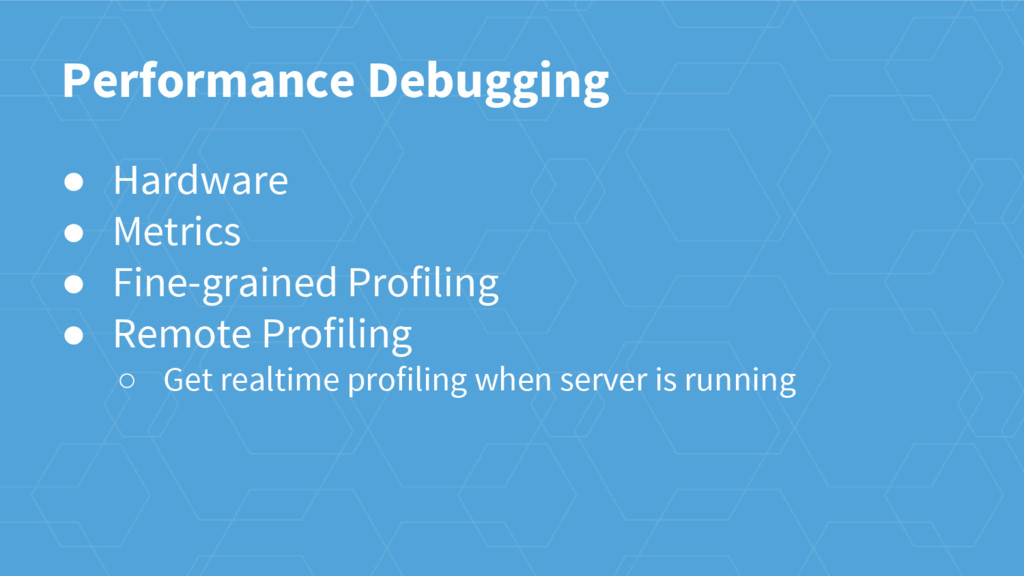
    view into system ◦ Without them, you are pretty much blind • Profiling to find bottlenecks • Benchmarking to convince and reveal • Plotting to illustrate
  20. What V3 Brings • Millions of Keys • Watch Progress

    • gRPC, Connection Reuse • Lease • Mini-Transaction • Reliability
  21. Integration with Kubernetes • Aim for 1.3 Release • Solves

    major problems and brings powerful features • Current Progress: ◦ kubernetes/issues/22448