Upgrade to Pro — share decks privately, control downloads, hide ads and more …

Data Visualization for Academic Writing

James Davenport
February 21, 2018

Data Visualization for Academic Writing

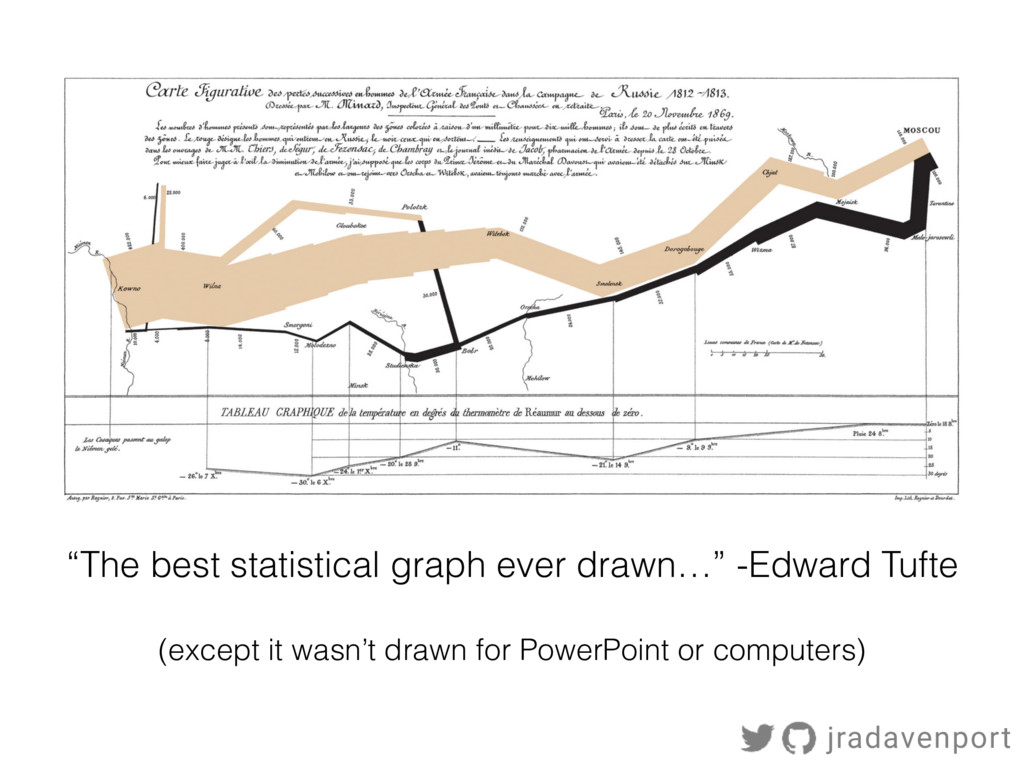
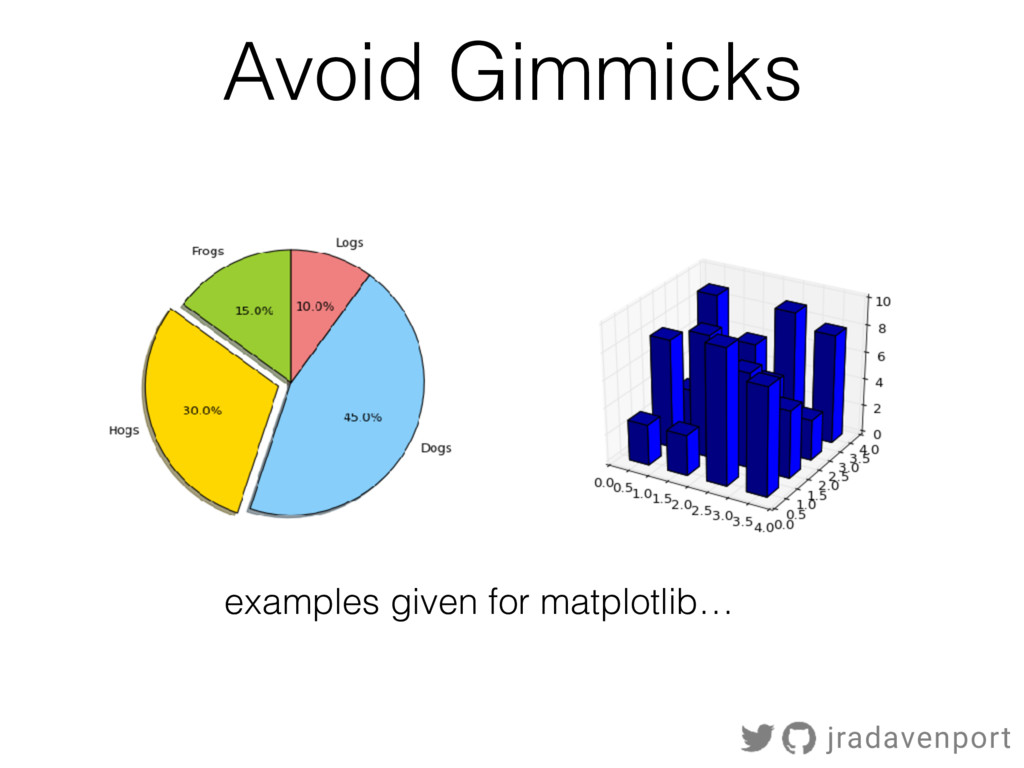
A talk given to the Scientific Writing Workshop graduate class (Astr597), taught by Prof. Dalcanton at the University of Washington

James Davenport

February 21, 2018
Tweet

More Decks by James Davenport

Other Decks in Design

Transcript

  1. Data Visualization for Academic Writing James R. A. Davenport NSF

    Astronomy & Astrophysics Postdoctoral Fellow, Western Washington University DIRAC Fellow, University of Washington jradavenport 1
  2. “The best statistical graph ever drawn…” -Edward Tufte (except it

    wasn’t drawn for PowerPoint or computers) jradavenport
  3. omg$ CO 2$ Temperature$ A great visualization: sells the message,

    worth 1000 words (or $1.2 Trillion annually) omg jradavenport
  4. What I won’t cover: - how to make graphs -

    types of graphs/plots - graphing languages What I want to cover: - why we make plots - why we publish plots - 5 points to consider jradavenport
  5. Why do we make plots? • Development • data exploration

    • idea generation • debug code • Presentation • talks • posters • papers Each use/format has unique concerns! jradavenport
  6. Anscombe’s Quartet All panels have the same - mean (in

    X and Y) - variance (in X and Y) - linear regression - “r” coefficient Development: Exploratory Data Analysis made popular by Tufte jradavenport
  7. Match Kepler to Gaia (DR1/TGAS) Select Main Sequence Filter out

    “junk” Davenport (2017) jradavenport Lecture Slide
  8. Your plots (need to) tell the story at a glance!

    Point #1 paper poster jradavenport
  9. The Dimensions of Art 65,000 pieces of art from the

    Tate Modern Width Height Width jradavenport
  10. One plot does not work for all audiences/needs 1st LIGO

    detection, Abbott et al. (2016) LIGO MAGAZINE First detection! LIGO Hanford signal 9:50:45 UTC, 14 September 2015 LIGO Livingston signal issue 8 3/2016 LIGO Scientific Collaboration LIGO Magazine, 2016 jradavenport
  11. Make multiple versions of a plot! Point #2 & make

    them available for people to use! jradavenport
  12. A brief aside…. Can you tell which is IDL, Python,

    Excel ? Kepler data from Davenport et al. (2014) jradavenport
  13. Keep it Clean !0.025& !0.02& !0.015& !0.01& !0.005& 0& 0.005&

    0.01& 0.015& 0.02& 120& 120.5& 121& 121.5& 122& 122.5& 123& 123.5& Series1& Series1' (0.025' (0.02' (0.015' (0.01' (0.005' 0' 0.005' 0.01' 0.015' 120.5377519' 120.7625304' 120.8238336' 120.885137' 120.9464403' 121.0077433' 121.0690467' 121.1303499' 121.1916532' 121.2938252' 121.3551285' 121.4164317' 121.477735' 121.5594728' 121.620776' 121.6820793' 121.7433826' 121.8046857' 121.8864234' 121.9477266' 122.0090298' 122.0703332' 122.1316365' 122.1929397' 122.254243' 122.3155463' 122.3768494' 122.4381527' 122.499456' 122.5607592' 122.6220625' 122.6833658' 122.744669' 122.8059722' 122.8672756' 122.9490132' 123.0103164' 123.0716198' Series1' Default plots from Excel jradavenport
  14. 0 50 100 150 200 April May June July Make

    things comparable jradavenport
  15. “… when data understanding is supported by perceptual rather than

    cognitive processes” — Enrico Bertini Visualization works … Daniela Huppenkothen, DIRAC
  16. brief vocabulary lesson Semiotics: the study of signs and symbols

    in communication Everything must have meaning jradavenport
  17. time height tall short birth death Everything must have meaning

    possible meanings: growth over time, growth-spurts, jradavenport
  18. time height tall short birth death Everything must have meaning

    possible meanings: …tall people die? Astronomers are notoriously bad at this! jradavenport
  19. Use value-added meaning when possible! Point #5 - Repeat layouts/designs

    - give colors/shapes meanings - re-use colors consistently jradavenport
  20. If they’re thinking about your plot, 
 they’re not thinking

    about your science Point #5 restated jradavenport
  21. If they’re thinking about your plot, 
 they’re not thinking

    about your science Try to use good design principles, 
 especially contrast. Don’t tool shame Make multiple versions of a plot! Your plots (need to) tell the story at a glance! CONCLUSIONS jradavenport
  22. Data Art 4 hours using Eclipse, traced with IOGraph “14

    Billions” (2010) by Tomás Saraceno