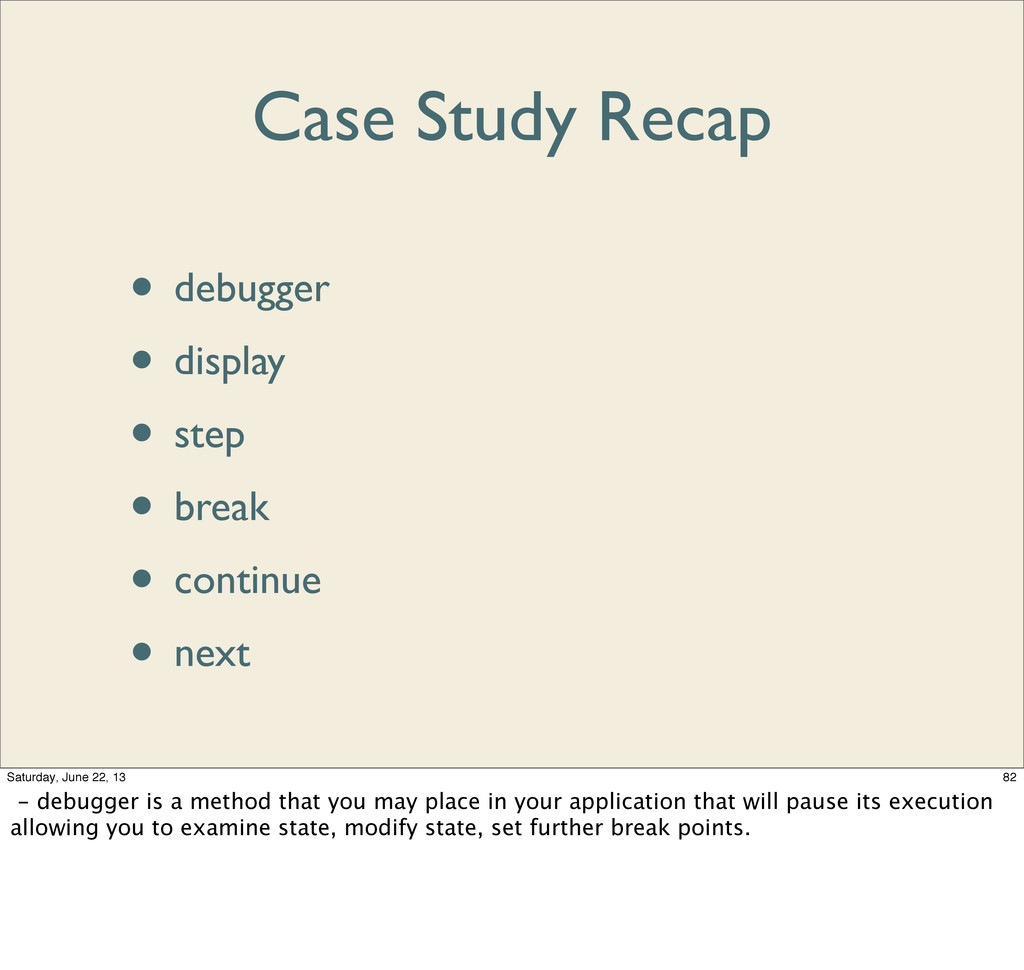
Debugging is an art. And to be an effective artist, an artist must be intimately familiar with their tools. In this talk, we'll start gently and finish strong to ensure that there's something for everyone. We'll cover when to use a debugger, which debugger to use, and how to use the debugger, and how to quickly configure your debugger for maximum utility. We'll touch briefly on pry and why pry is not a debugger, except when it is.
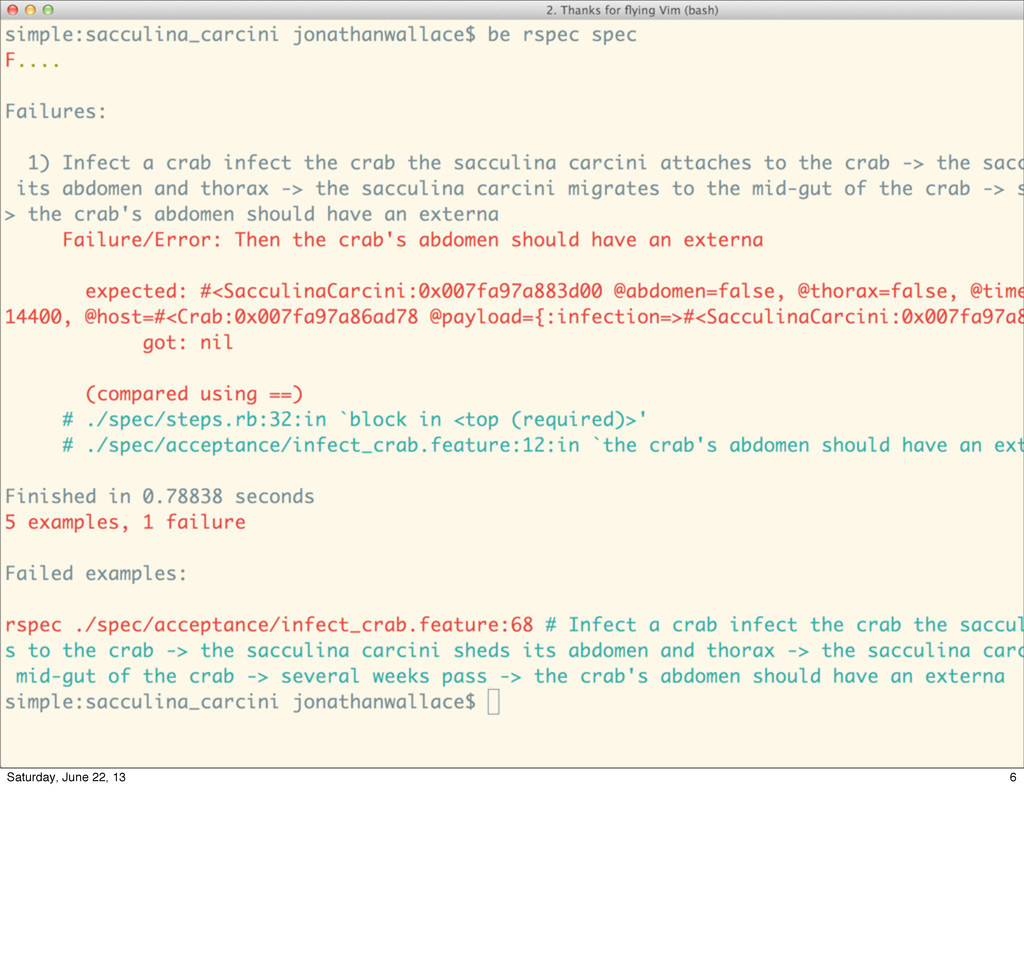
Developers are always looking for ways to boost productivity. Effective debugging allows one to more quickly discover inaccuracies between our expectations and how the software actually behaves.
![Case Study Recap • debugger • disp[lay] • step •](https://files.speakerdeck.com/presentations/a1936ee0bce8013008c836f09a9cf44a/slide_86.jpg)
![Case Study Recap • debugger • disp[lay] • step [n]](https://files.speakerdeck.com/presentations/a1936ee0bce8013008c836f09a9cf44a/slide_87.jpg)
![Case Study Recap • debugger • disp[lay] • step •](https://files.speakerdeck.com/presentations/a1936ee0bce8013008c836f09a9cf44a/slide_88.jpg)
![Case Study Recap • debugger • disp[lay] • step •](https://files.speakerdeck.com/presentations/a1936ee0bce8013008c836f09a9cf44a/slide_89.jpg)
![Case Study Recap • debugger • disp[lay] • step •](https://files.speakerdeck.com/presentations/a1936ee0bce8013008c836f09a9cf44a/slide_90.jpg)
![Case Study Recap • debugger • disp[lay] • step •](https://files.speakerdeck.com/presentations/a1936ee0bce8013008c836f09a9cf44a/slide_91.jpg)
![Case Study Recap • debugger • disp[lay] • step •](https://files.speakerdeck.com/presentations/a1936ee0bce8013008c836f09a9cf44a/slide_92.jpg)
![Case Study Recap • debugger • disp[lay] • step •](https://files.speakerdeck.com/presentations/a1936ee0bce8013008c836f09a9cf44a/slide_94.jpg)
![Case Study Recap • debugger • disp[lay] • step •](https://files.speakerdeck.com/presentations/a1936ee0bce8013008c836f09a9cf44a/slide_95.jpg)
![Case Study Recap • debugger • disp[lay] • step •](https://files.speakerdeck.com/presentations/a1936ee0bce8013008c836f09a9cf44a/slide_96.jpg)
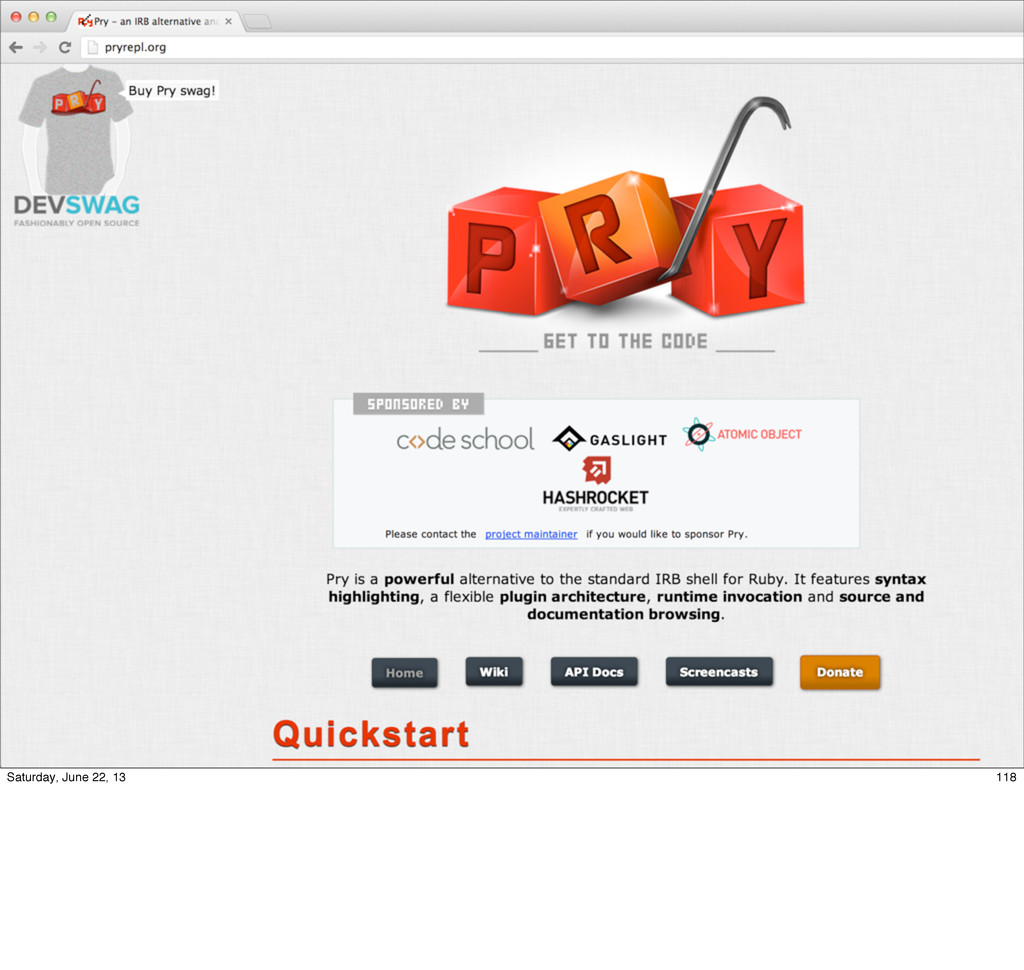
![Pry • “powerful alternative to [...] IRB [...]” • syntax](https://files.speakerdeck.com/presentations/a1936ee0bce8013008c836f09a9cf44a/slide_118.jpg)
![Get to know me! • http://blog.jonathanrwallace.com/about • [email protected] • @jonathanwallace](https://files.speakerdeck.com/presentations/a1936ee0bce8013008c836f09a9cf44a/slide_140.jpg)