Just because you can, doesn't mean you should. We'll discuss using data efficiently, review the choices we face and determine how data literacy, statistical reasoning and algorithmic thinking help.
Conference Jonathan Wallace good afternoon everyone, thanks for coming out. My name is Jonathan Wallace and i'm glad you're here to listen to my talk. It has been five years since I last presented at this conference and I want to thank the organizers for having me out again. today, I’ve come to talk about what I think is an important topic of which everyone should be aware, modern data literacy.
• Curiosity I want you to… Goals Real quick, these are my goals for the talk. Really, I want your interest piqued in these topics because with only twenty minutes, we’re only going to superficially cover these topics with a few examples.
why I’m worth listening to about this topic. Last time I was here, I shared that I’d been a web developer for the past seven years, five of which was at a consulting company. Believe it or not, it took a lot of takes to get that shot!
• Principal Engineer at Stitch Fix • Representative of Ga. House District 119 • V.P. of Engineering at Softgiving I’ve had a few more jobs associated with data Since then.. Anyway, since then, I’ve done all the things listed here. I was the director of a medical billing company where we analyzed claims for medical labs and helped them get paid by insurance companies. We had over 30 labs so there was a decent, but small, flow of data with which to contend.
• Principal Engineer at Stitch Fix • Representative of Ga. House District 119 • V.P. of Engineering at Softgiving I’ve had a few more jobs associated with data Since then.. After that, I was at Stitch Fix, where our primary database was over 1/2 a terabyte in size. Not huge when compared to FB, Apple, Amazon, Netflix, or Google but still pretty big! Let’s talk about that for a quick moment.
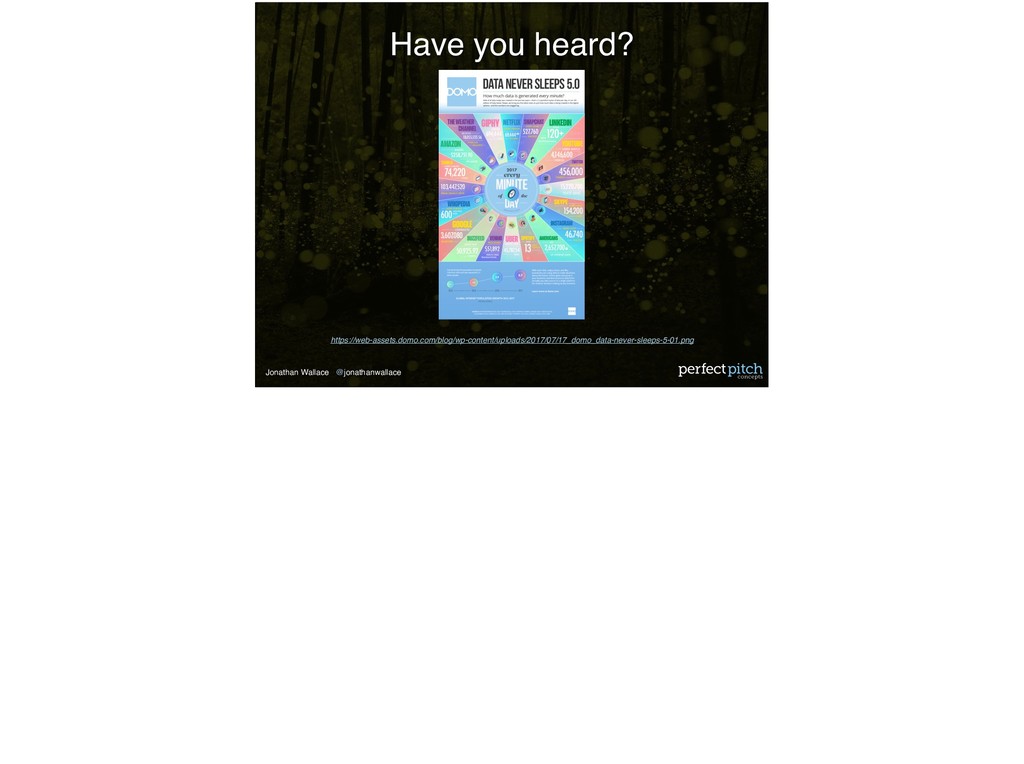
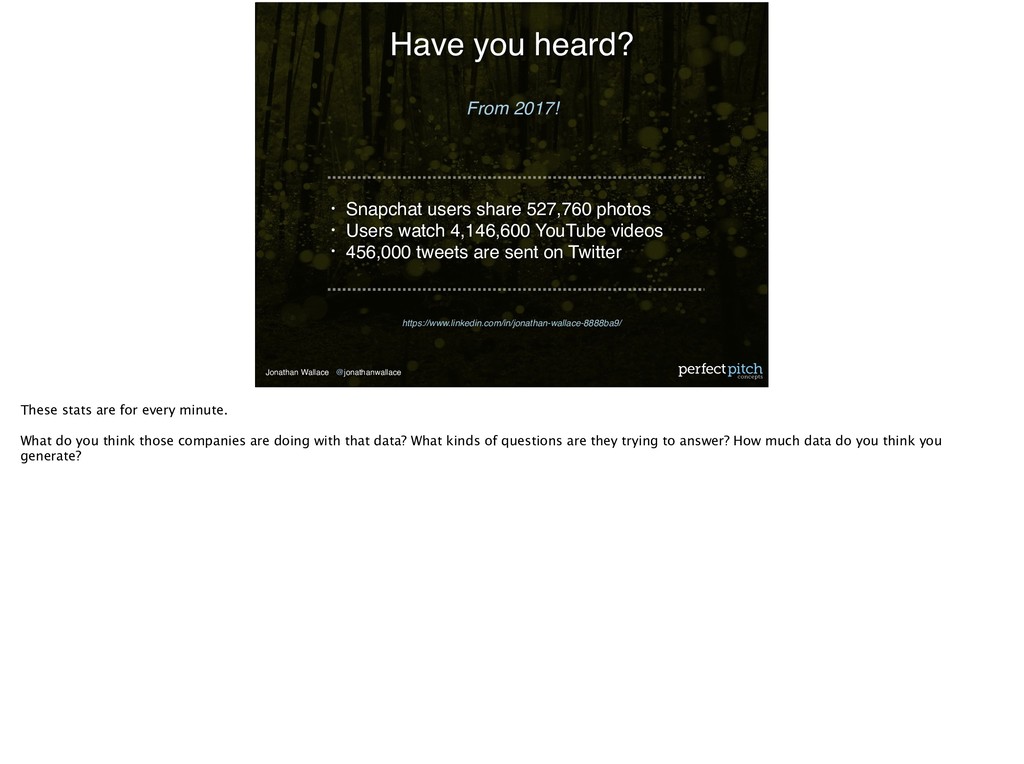
• Users watch 4,146,600 YouTube videos • 456,000 tweets are sent on Twitter From 2017! Have you heard? These stats are for every minute. What do you think those companies are doing with that data? What kinds of questions are they trying to answer? How much data do you think you generate?
questions, let’s talk about technology. Technology is what allows us to generate those mind boggling amounts of data. It is a force multiplier. It isn’t inherently good or bad. What does this mean when it comes to data? If technology is neutral, does that mean the data is neutral?
neutral. It isn’t neutral because the data you acquire that depends on what questions you ask. How do you capture it? How do you store it? The temptation is to grab all the data you can. And then later, you’ll try to figure out what it means.
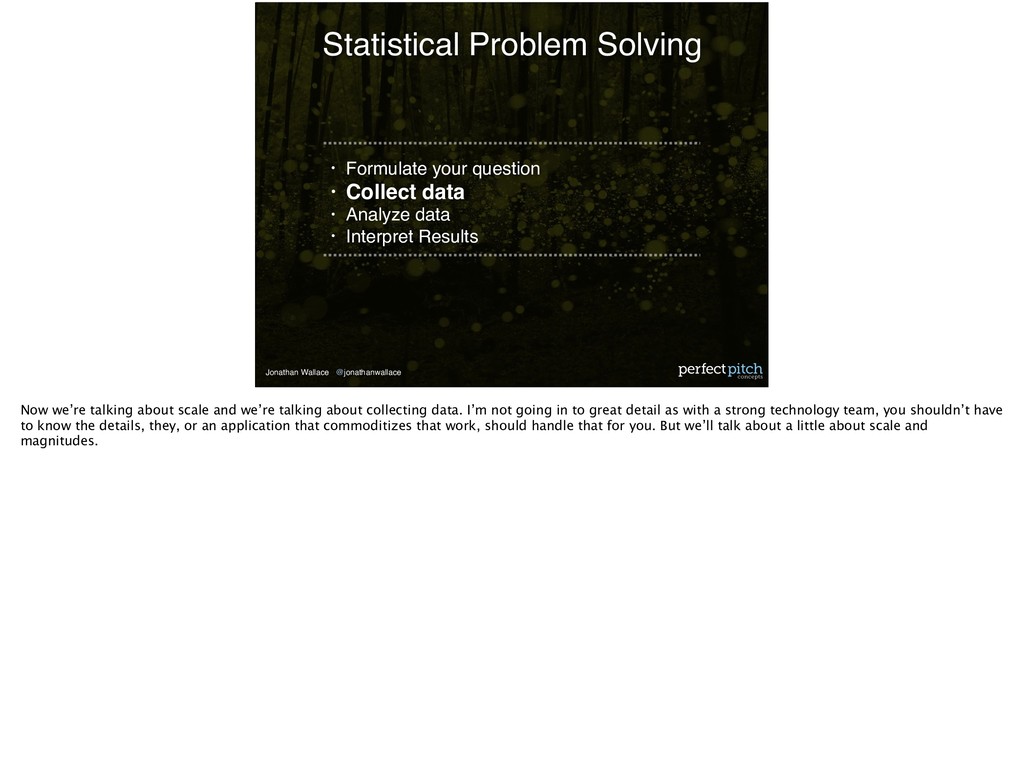
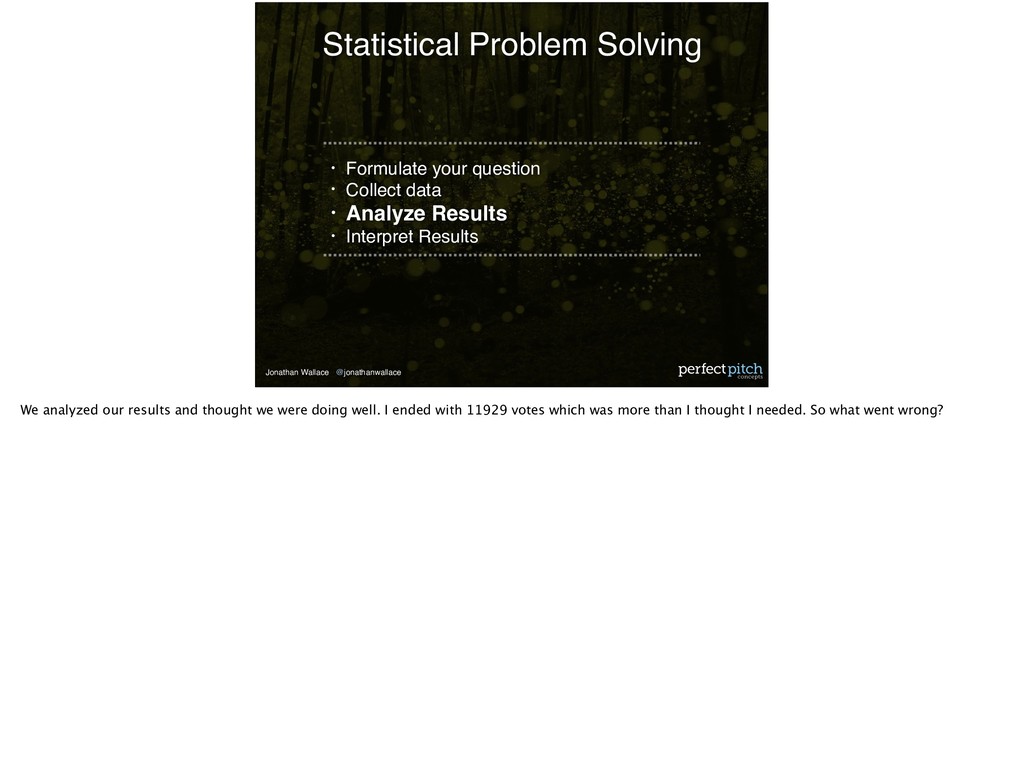
• Analyze data • Interpret Results Statistical Problem Solving Here’re the basics. First, we need to formulate your question. This might seem elementary and obvious but I assure you it is not. People often skip this.
Simple Example You have a website that contains multiple steps? Or maybe, even simpler, multiple forms. What might your question be? “At which step in our signup process do we see the largest drop off?”
Simple Example Great, now we know what to measure. Let’s measure the amount of views for each page. Knowing your question is the first step. But this example, although it highlights formulating a question, doesn’t address some of the problems that happens with data at large scales.
• Analyze data • Interpret Results Statistical Problem Solving Now we’re talking about scale and we’re talking about collecting data. I’m not going in to great detail as with a strong technology team, you shouldn’t have to know the details, they, or an application that commoditizes that work, should handle that for you. But we’ll talk about a little about scale and magnitudes.
million seconds? 11.6 days How long is one billion seconds? 32 years How can we manage one million of anything let alone one billion? How do we cogently handle that many data points?
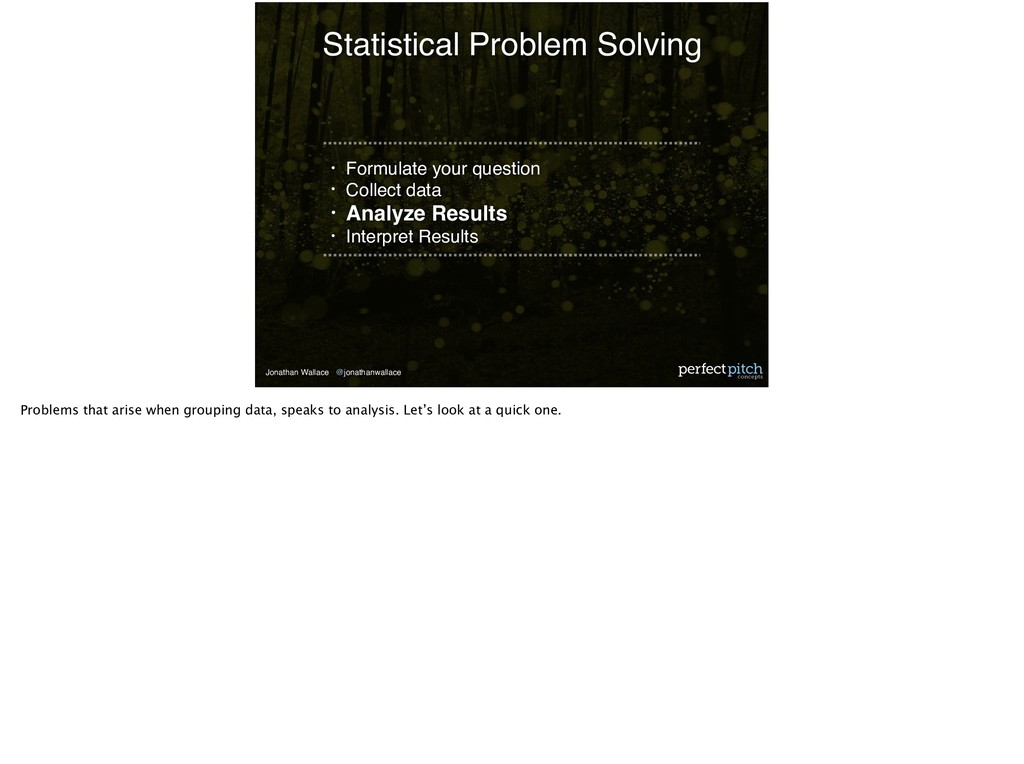
• Analyze Results • Interpret Results Statistical Problem Solving Problems that arise when grouping data, speaks to analysis. Let’s look at a quick one.
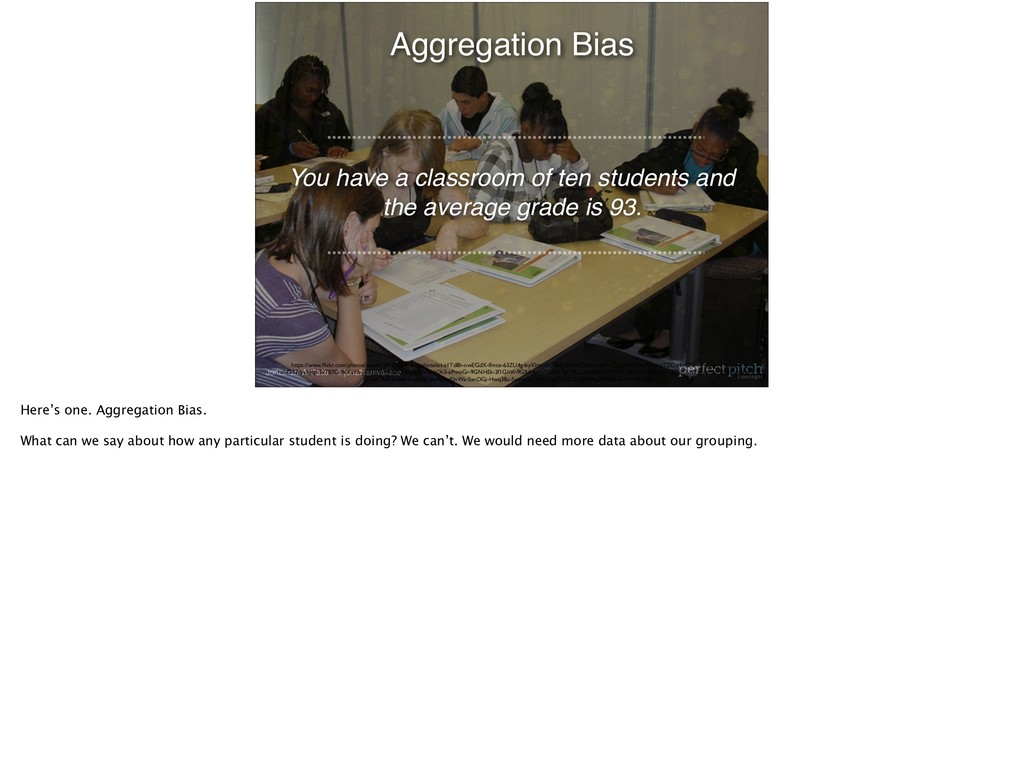
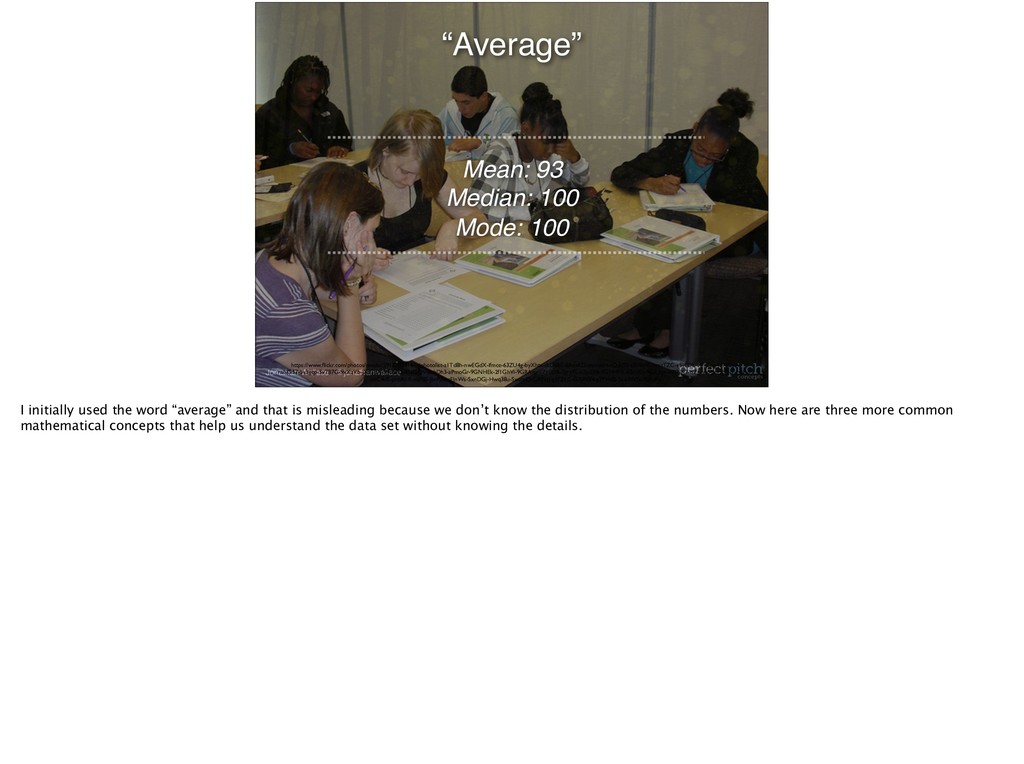
and the average grade is 93. Aggregation Bias https://www.flickr.com/photos/nwabr/5917202414/in/photolist-a1Td8h-nwEGdX-ifmce-63ZU4g-byXhtx-dtD6bE-8AdtKD-amnveH-rQdqSb-dSWa9F-bmzTZC-s5vEDE-MFiCpg-raNGeA- raNG57-5v3gqp-5v7B7G-9xXzVb-JX3TqX-99utdQ-9NFSQV-8cbDh3-aPmoGr-9GNHEk-2f1GhVi-9GRAny-aZpEUB-7gry7L-aZpER6-9GNHFX-6SddEn-9GRApj-oZfNK7-oZgvwe-peHNN1-NrPyP- obC4dS-phbAkK-eiafBS-JbrPdz-cEJnWs-SxnDGj-Hwq38u-SxotnQ-GXNzJ-g3FZLC-GXPW4-g3FVHB-2co3WSt-7Uh3fu Here’s one. Aggregation Bias. What can we say about how any particular student is doing? We can’t. We would need more data about our grouping.
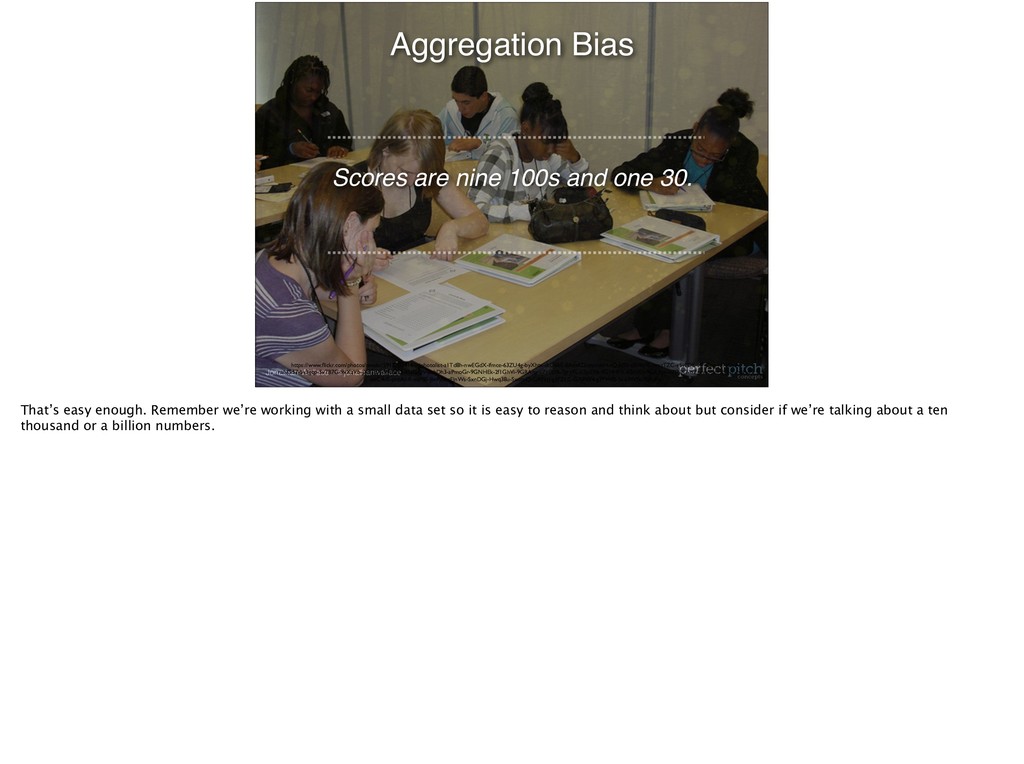
Aggregation Bias https://www.flickr.com/photos/nwabr/5917202414/in/photolist-a1Td8h-nwEGdX-ifmce-63ZU4g-byXhtx-dtD6bE-8AdtKD-amnveH-rQdqSb-dSWa9F-bmzTZC-s5vEDE-MFiCpg-raNGeA- raNG57-5v3gqp-5v7B7G-9xXzVb-JX3TqX-99utdQ-9NFSQV-8cbDh3-aPmoGr-9GNHEk-2f1GhVi-9GRAny-aZpEUB-7gry7L-aZpER6-9GNHFX-6SddEn-9GRApj-oZfNK7-oZgvwe-peHNN1-NrPyP- obC4dS-phbAkK-eiafBS-JbrPdz-cEJnWs-SxnDGj-Hwq38u-SxotnQ-GXNzJ-g3FZLC-GXPW4-g3FVHB-2co3WSt-7Uh3fu That’s easy enough. Remember we’re working with a small data set so it is easy to reason and think about but consider if we’re talking about a ten thousand or a billion numbers.
https://www.flickr.com/photos/nwabr/5917202414/in/photolist-a1Td8h-nwEGdX-ifmce-63ZU4g-byXhtx-dtD6bE-8AdtKD-amnveH-rQdqSb-dSWa9F-bmzTZC-s5vEDE-MFiCpg-raNGeA- raNG57-5v3gqp-5v7B7G-9xXzVb-JX3TqX-99utdQ-9NFSQV-8cbDh3-aPmoGr-9GNHEk-2f1GhVi-9GRAny-aZpEUB-7gry7L-aZpER6-9GNHFX-6SddEn-9GRApj-oZfNK7-oZgvwe-peHNN1-NrPyP- obC4dS-phbAkK-eiafBS-JbrPdz-cEJnWs-SxnDGj-Hwq38u-SxotnQ-GXNzJ-g3FZLC-GXPW4-g3FVHB-2co3WSt-7Uh3fu I initially used the word “average” and that is misleading because we don’t know the distribution of the numbers. Now here are three more common mathematical concepts that help us understand the data set without knowing the details.
raNG57-5v3gqp-5v7B7G-9xXzVb-JX3TqX-99utdQ-9NFSQV-8cbDh3-aPmoGr-9GNHEk-2f1GhVi-9GRAny-aZpEUB-7gry7L-aZpER6-9GNHFX-6SddEn-9GRApj-oZfNK7-oZgvwe-peHNN1-NrPyP- obC4dS-phbAkK-eiafBS-JbrPdz-cEJnWs-SxnDGj-Hwq38u-SxotnQ-GXNzJ-g3FZLC-GXPW4-g3FVHB-2co3WSt-7Uh3fu We can look at other numbers to help us understand the data we’ve collected. And we should. And it is important to understand how the data is distributed. Is it randomly distributed? Or does it have a fun distribution shape? Alright, I have one more thing to cover before I get to a real world example
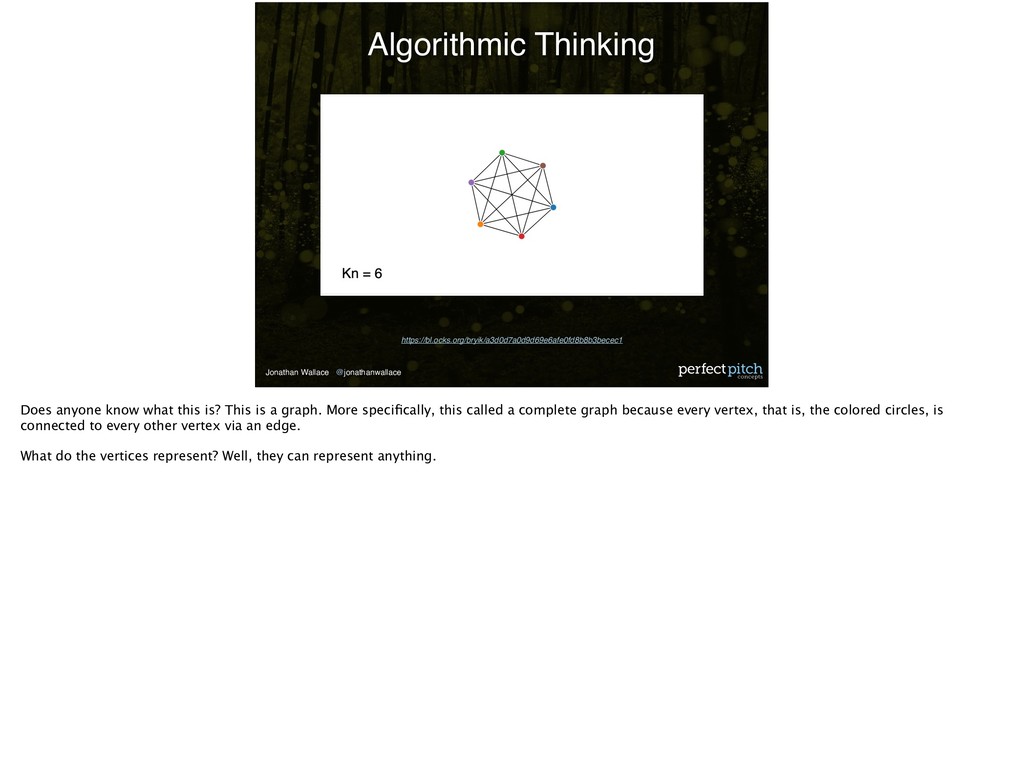
this is? This is a graph. More specifically, this called a complete graph because every vertex, that is, the colored circles, is connected to every other vertex via an edge. What do the vertices represent? Well, they can represent anything.
my application from Softgiving. This is one folder in one directory in the application. Here’s where we’ve modeled the domain. We have 59 models. That would be 1711 connections if each model were fully connected to every other model. My boss the other day asked about adding multiple accounts per organization. We would now have another dimension, or another node, in the application. This would lead to 1770 connections. You can see how each new variable, new dimension, new grouping that we add, may add complexity to how we capture, store, and associate data.
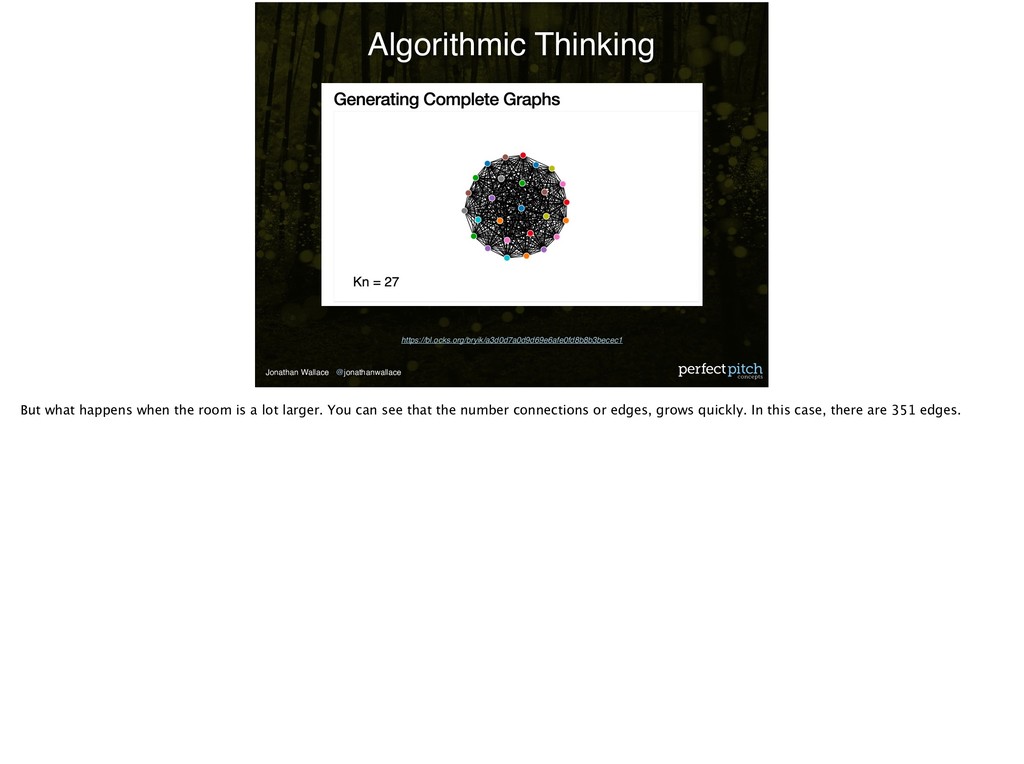
the handshake problem, and I promise it has real-world relevance in the next section. Everyone shaking everyone’s hand is a large number as the number of people goes up.
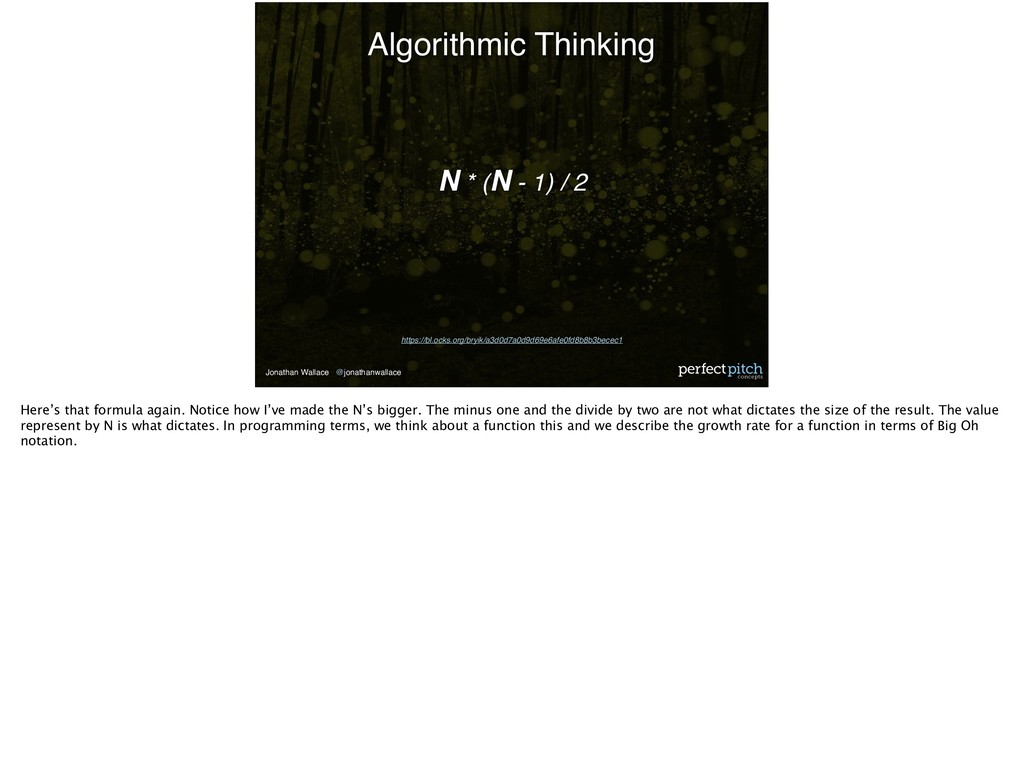
1) / 2 Here’s that formula again. Notice how I’ve made the N’s bigger. The minus one and the divide by two are not what dictates the size of the result. The value represent by N is what dictates. In programming terms, we think about a function this and we describe the growth rate for a function in terms of Big Oh notation.
O(n) • O(n*n) So you can think about it. A big oh of one, is a constant. So if I want to say high to everyone in this room, I wave my hand and say hello. If I want to shake each of your hands individual, there are 20 people, then n is twenty and I shake twenty hands. But, if I want to build a strong community in this room, then I would like for everyone to shake everyone’s hand.
O(n) • O(n*n) Spoiler, this is why politicians are gluttons for events and interviews. They can meet a lot of people at once. And with a speech and a hand wave, they’re very efficient. But they also take the time to shake individual hands as much as they can. Finally, the very good ones, focus on community building which gets people to shake each other’s hand. Okay, on to the real world example.
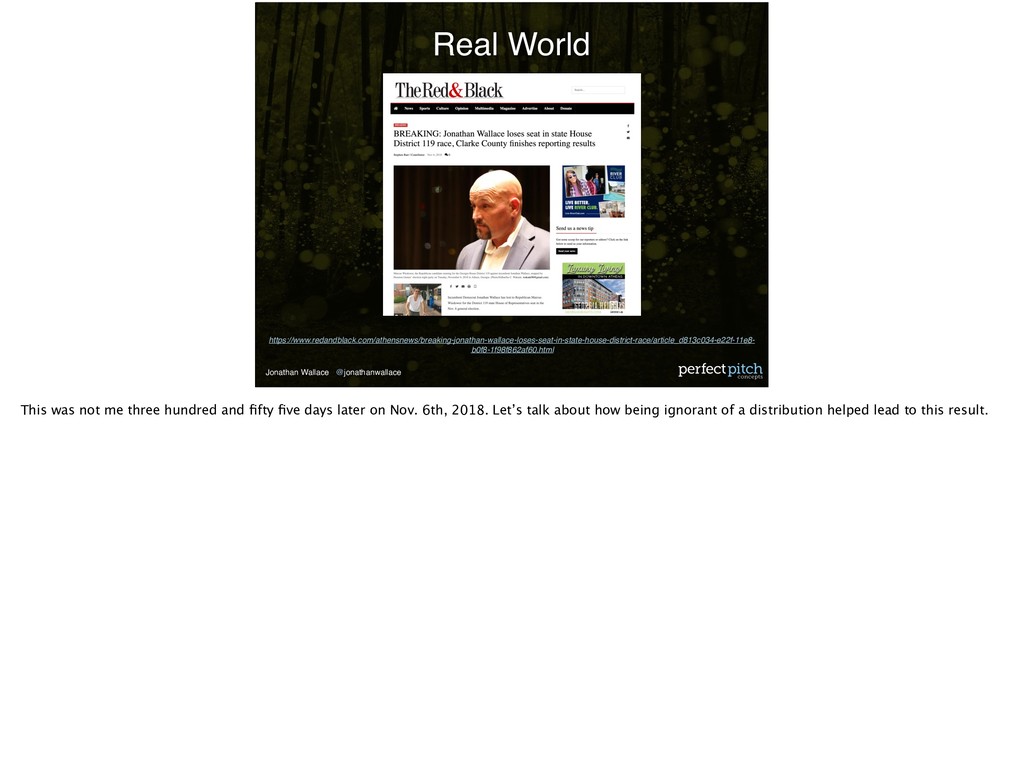
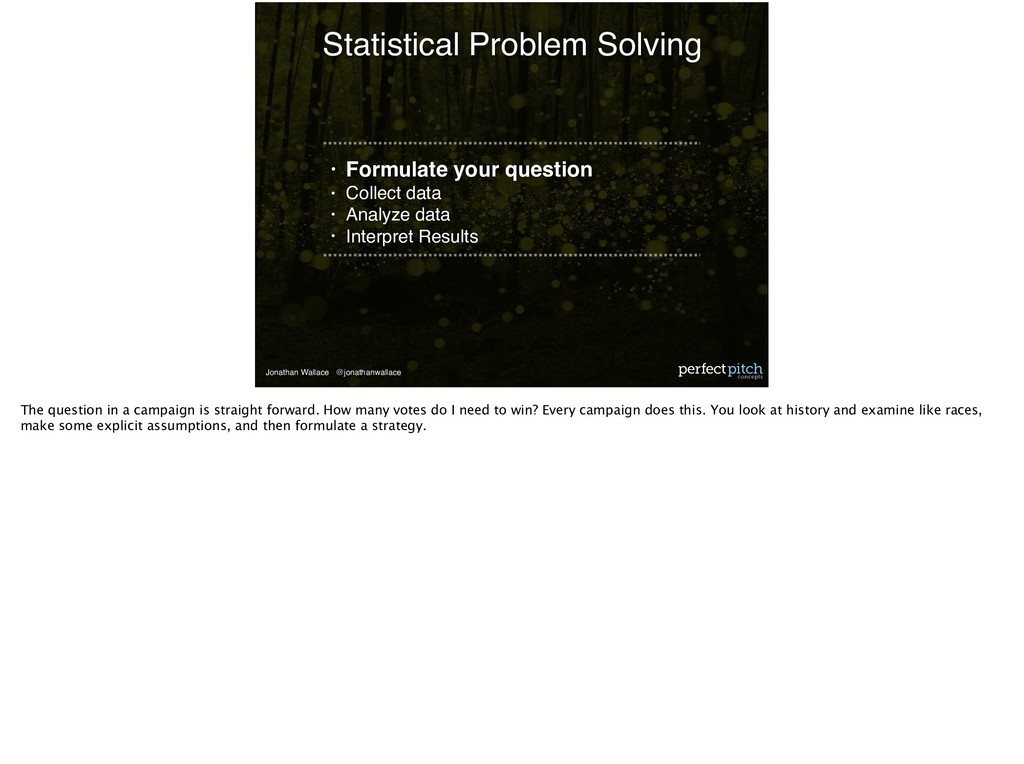
• Analyze data • Interpret Results Statistical Problem Solving The question in a campaign is straight forward. How many votes do I need to win? Every campaign does this. You look at history and examine like races, make some explicit assumptions, and then formulate a strategy.
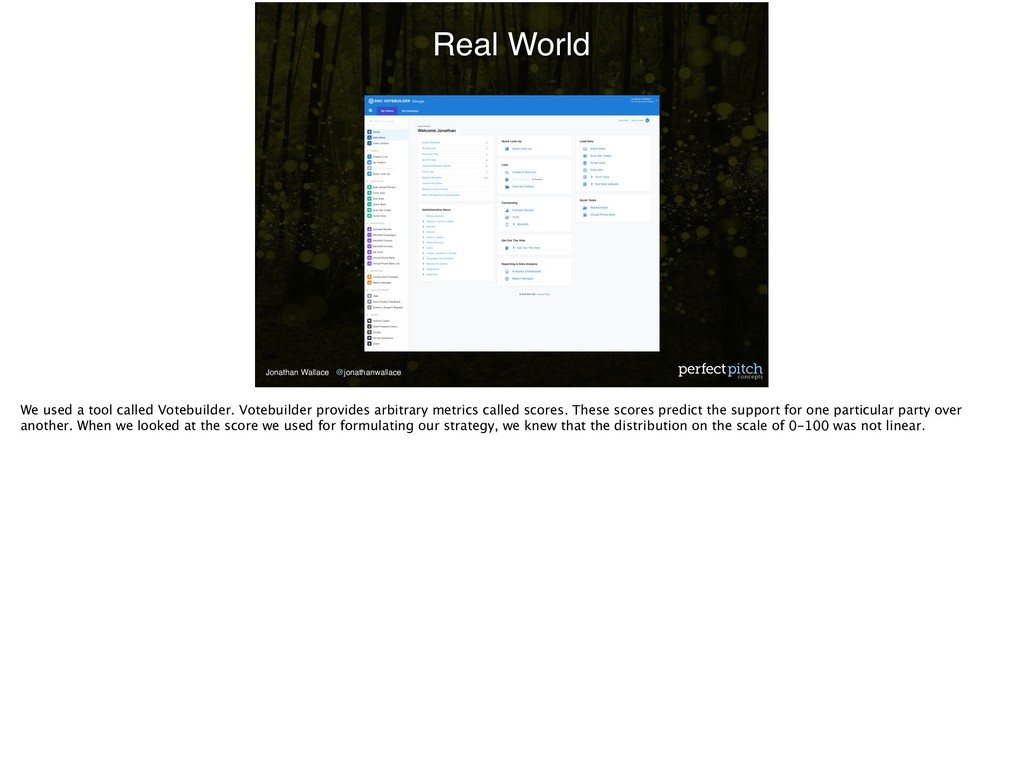
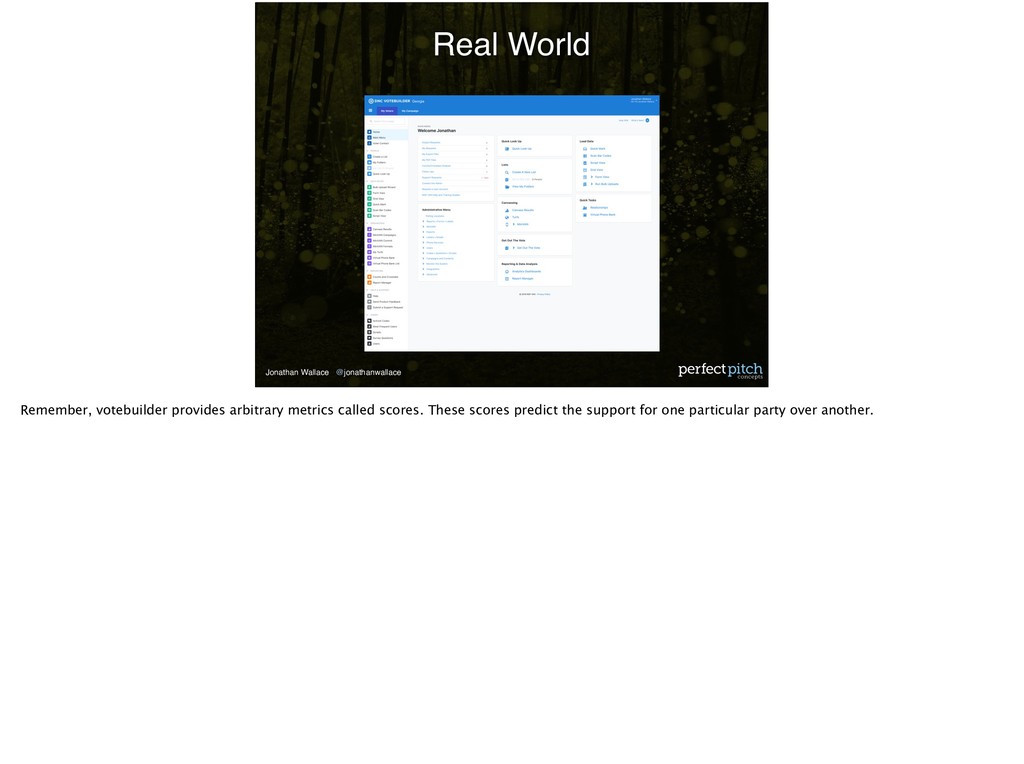
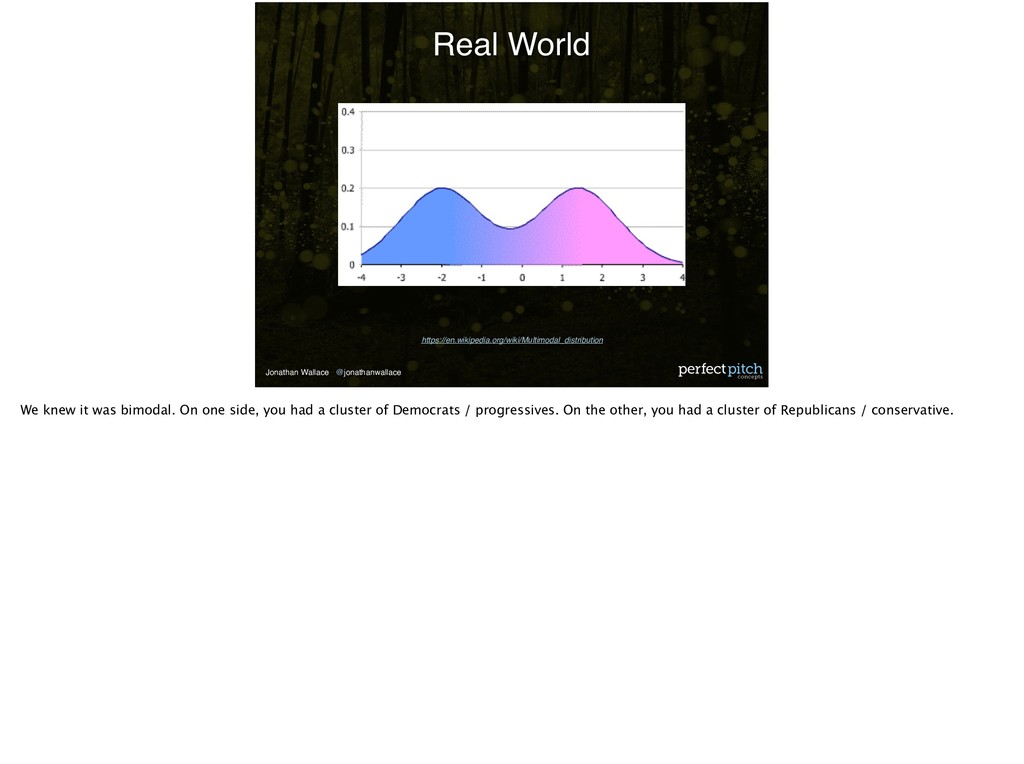
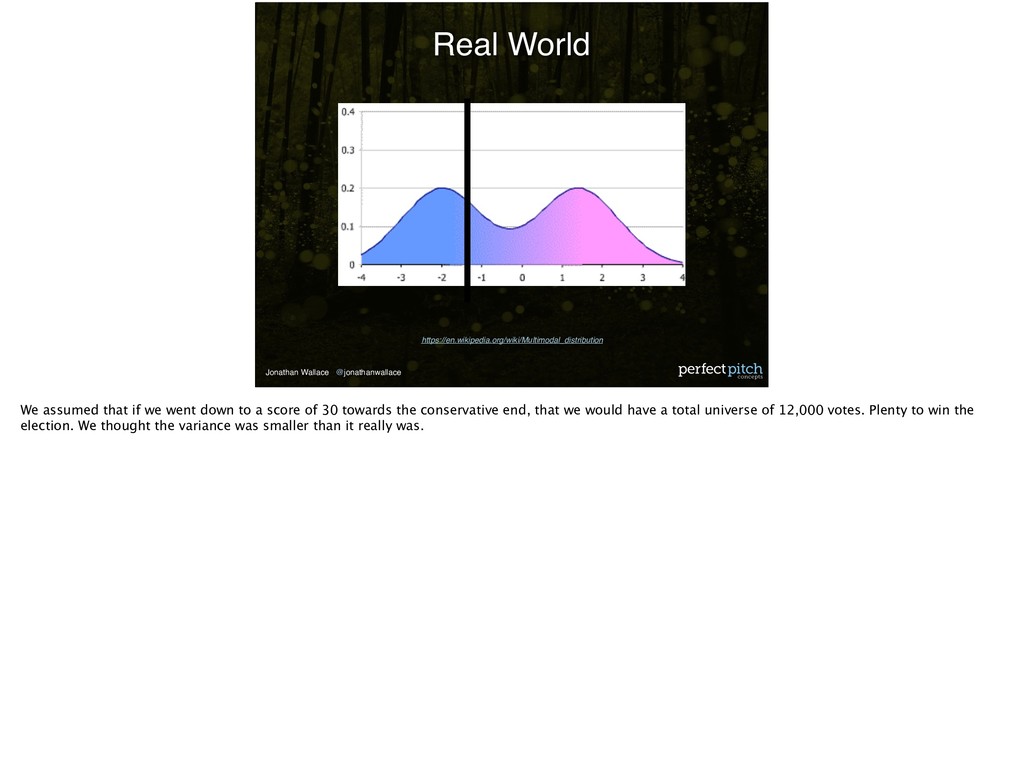
Votebuilder. Votebuilder provides arbitrary metrics called scores. These scores predict the support for one particular party over another. When we looked at the score we used for formulating our strategy, we knew that the distribution on the scale of 0-100 was not linear.
was bimodal. On one side, you had a cluster of Democrats / progressives. On the other, you had a cluster of Republicans / conservative. So we established our win number and the size of our universe, 12000, based on that score.
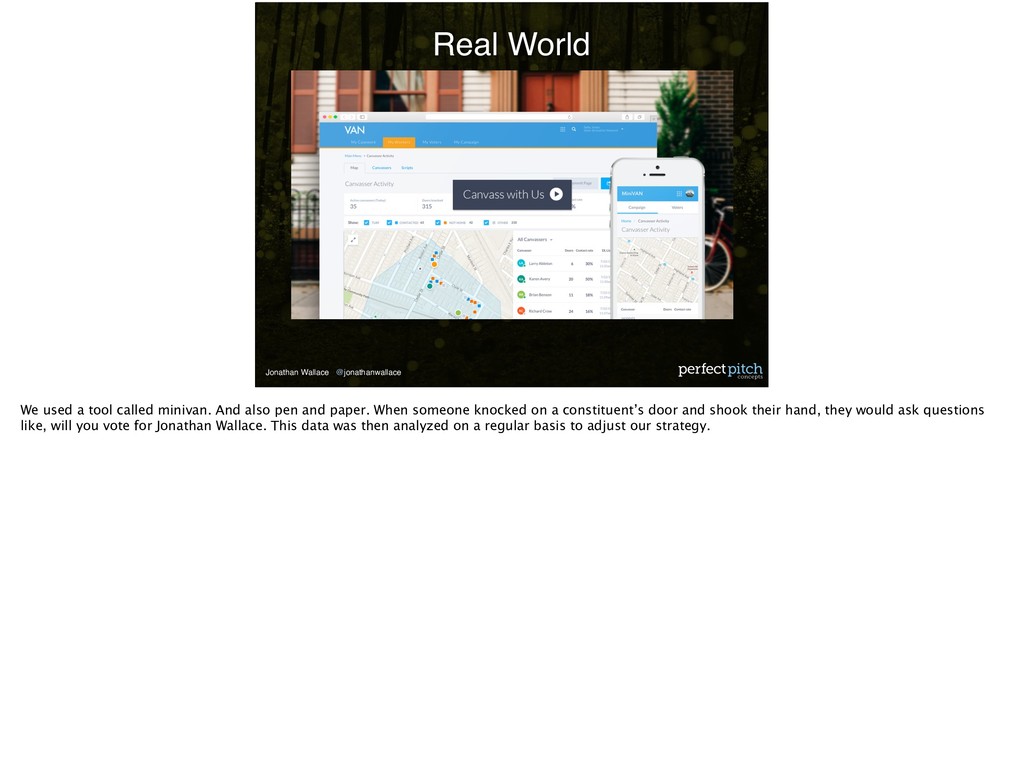
minivan. And also pen and paper. When someone knocked on a constituent’s door and shook their hand, they would ask questions like, will you vote for Jonathan Wallace. This data was then analyzed on a regular basis to adjust our strategy.
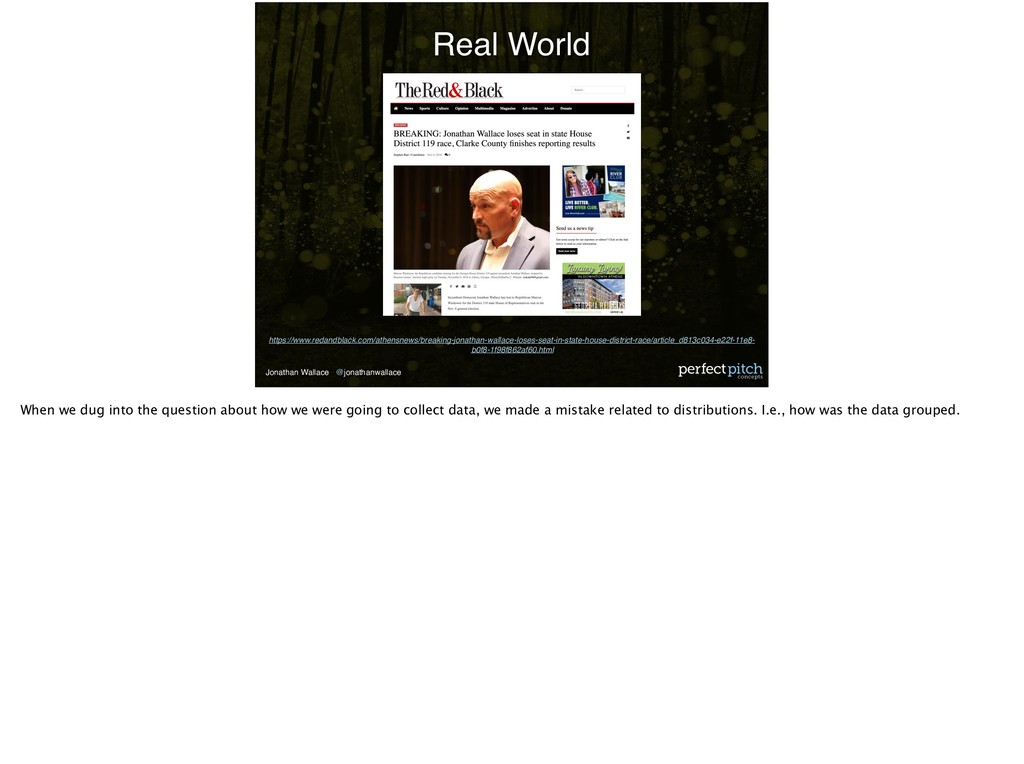
• Analyze Results • Interpret Results Statistical Problem Solving We analyzed our results and thought we were doing well. I ended with 11929 votes which was more than I thought I needed. So what went wrong?
we went down to a score of 30 towards the conservative end, that we would have a total universe of 12,000 votes. Plenty to win the election. We thought the variance was smaller than it really was.
found in our analysis, is that the clusters of this bimodal distribution is extremely concentrated on either end. And we should have used a score of 15 which would have made our universe even larger and given a better chance of victory in that race. The variance was much larger.