Exploratory Seminar: An Introduction to K-Means Clustering
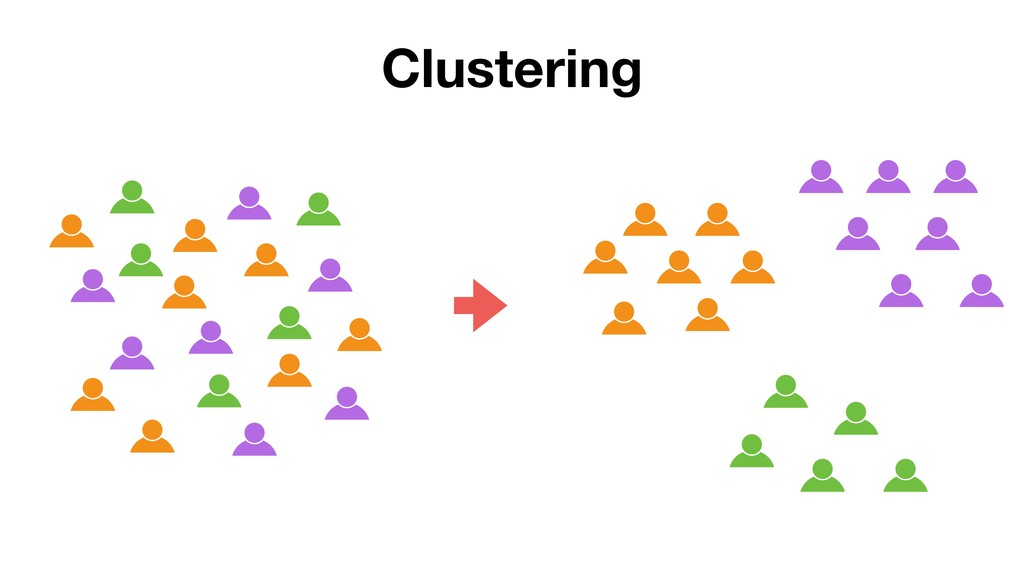
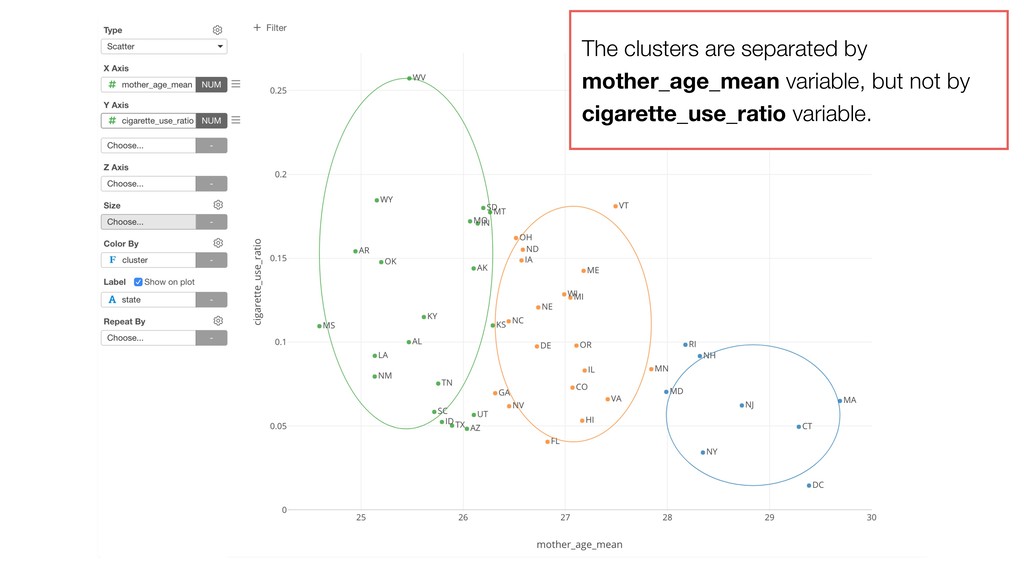
This is to introduce K-Means Clustering algorithm, which segments the data based on a given set of variables, by demonstrating it with Exploratory’s Analytics view.
Inc. to make Data Science available for everyone. Prior to Exploratory, Kan was a director of development at Oracle leading development teams for building various Data Science products in areas including Machine Learning, BI, Data Visualization, Mobile Analytics, Big Data, etc. While at Oracle, Kan also provided training and consulting services to help organizations transform with data. @KanAugust Instructor
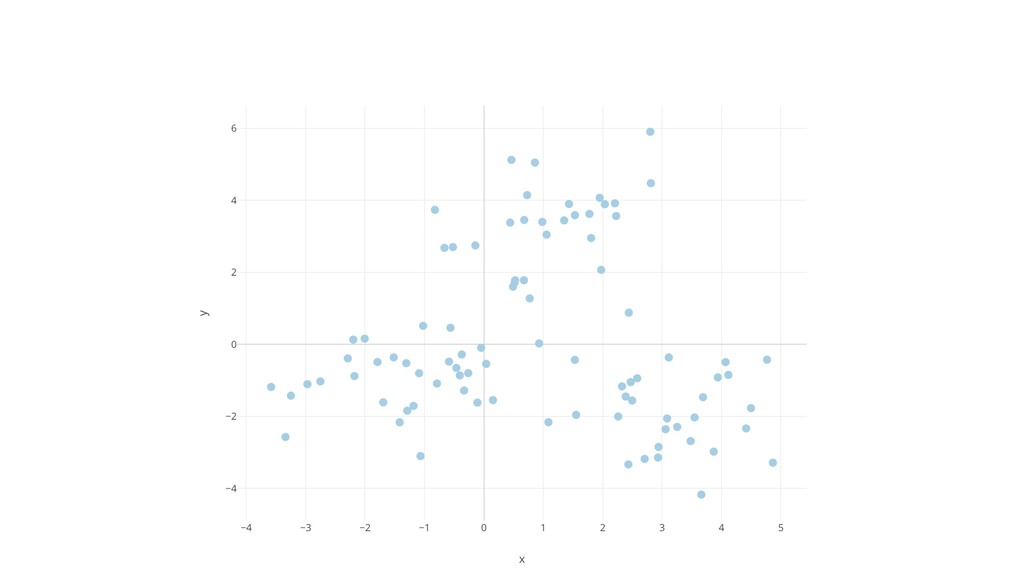
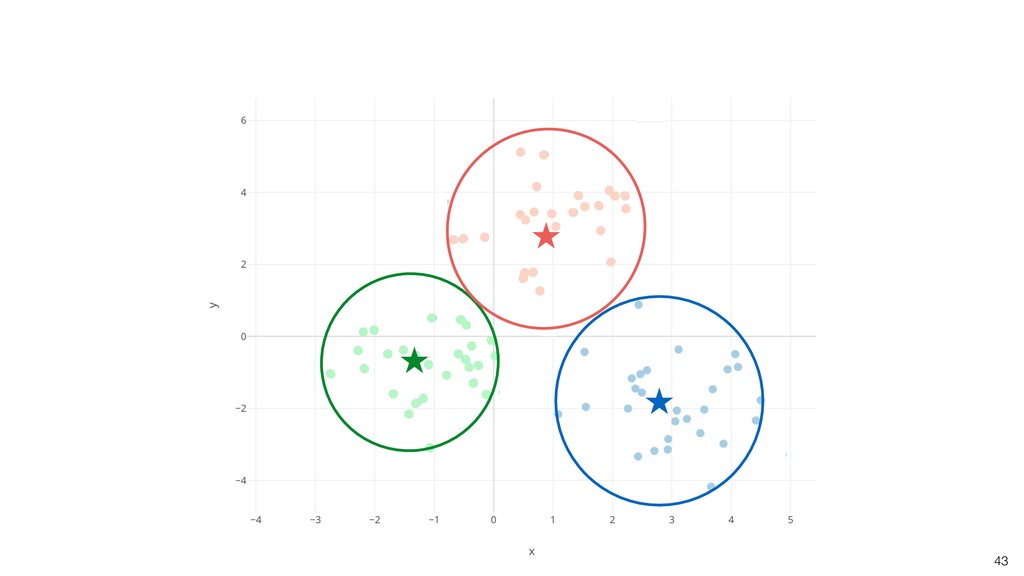
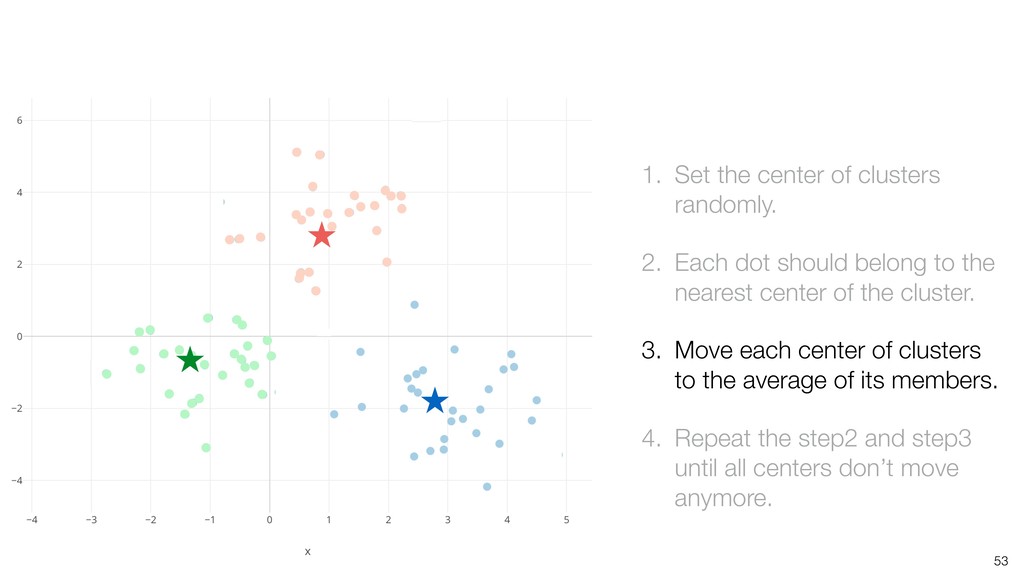
should belong to the nearest center of the cluster. 3. Move each center of clusters to the average of its members. 4. Repeat the step2 and step3 until all centers don’t move anymore.
should belong to the nearest center of the cluster. 3. Move each center of clusters to the average of its members. 4. Repeat the step2 and step3 until all centers don’t move anymore.
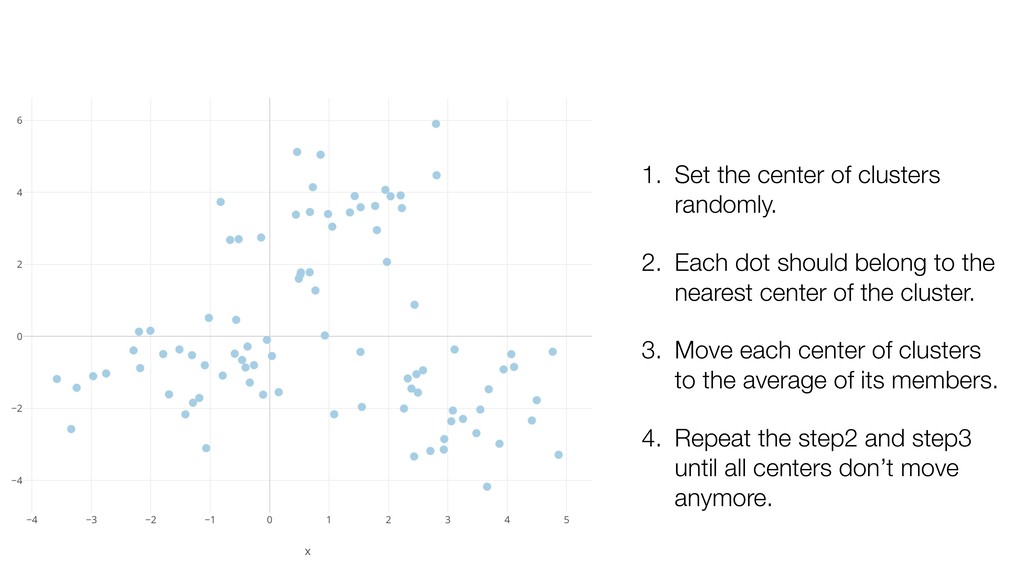
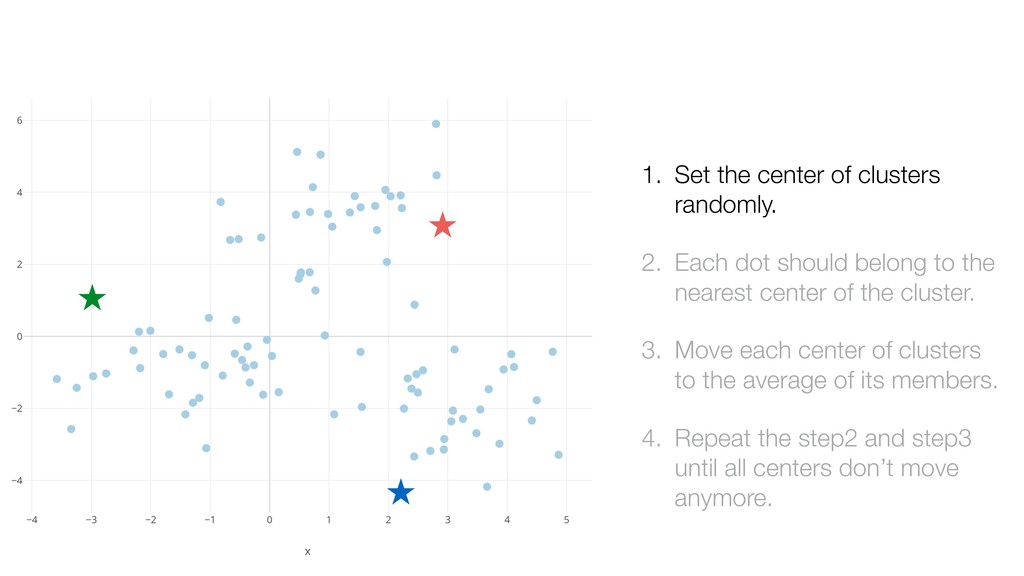
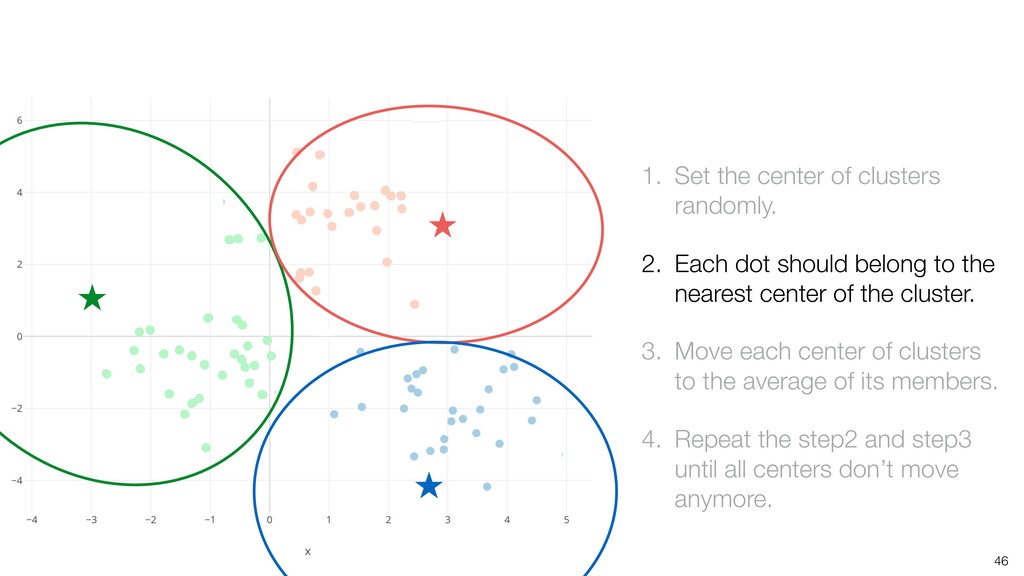
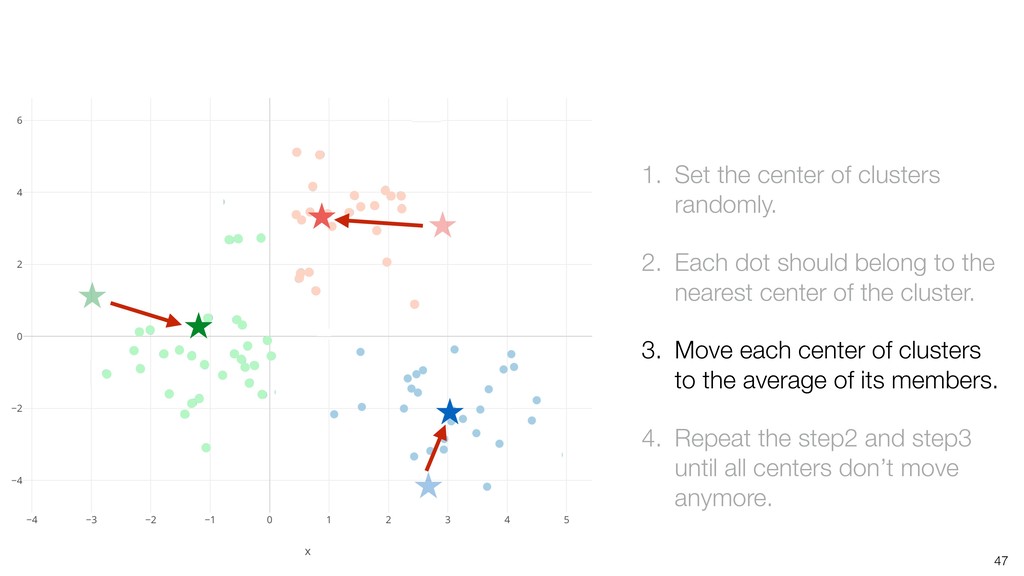
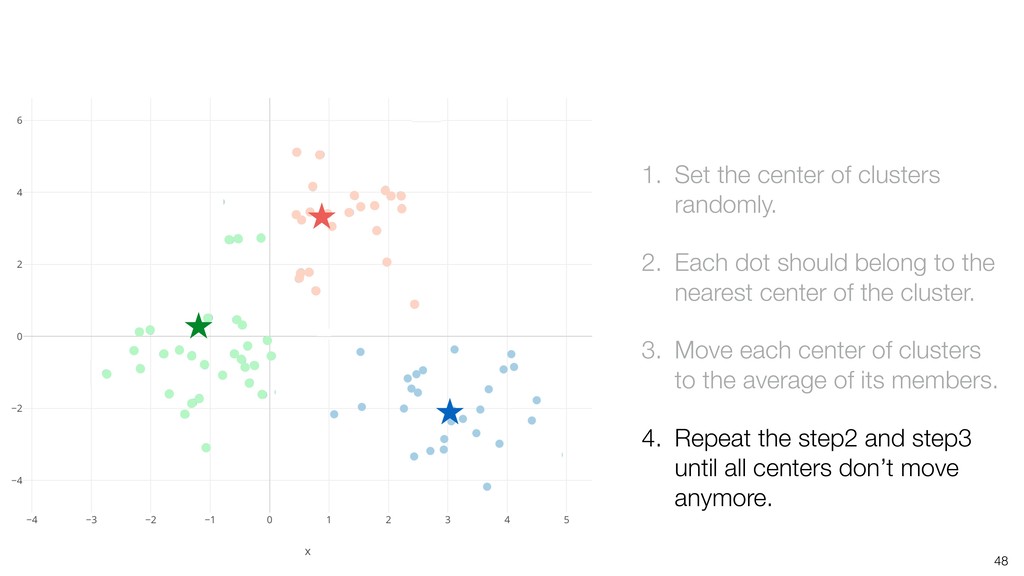
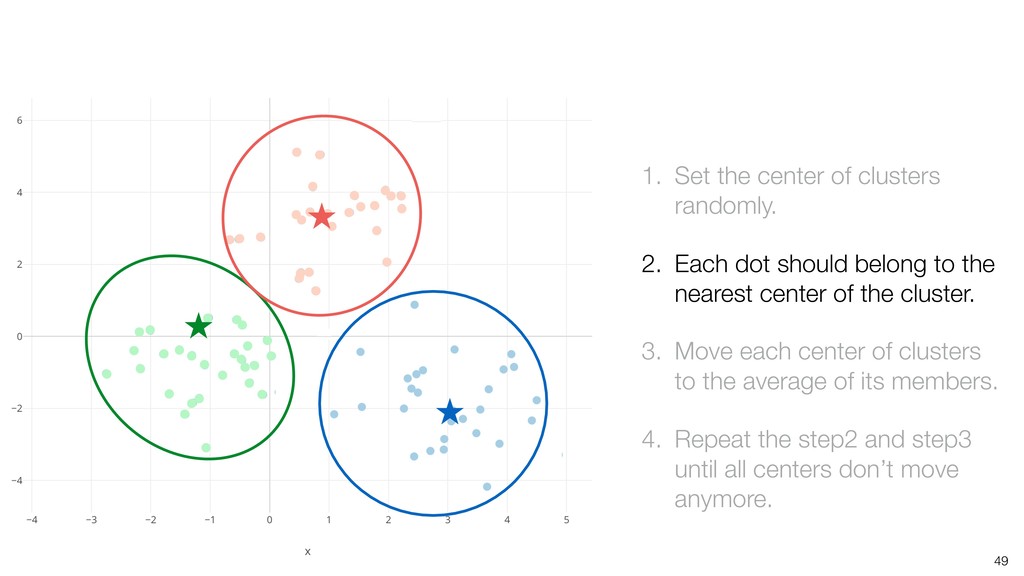
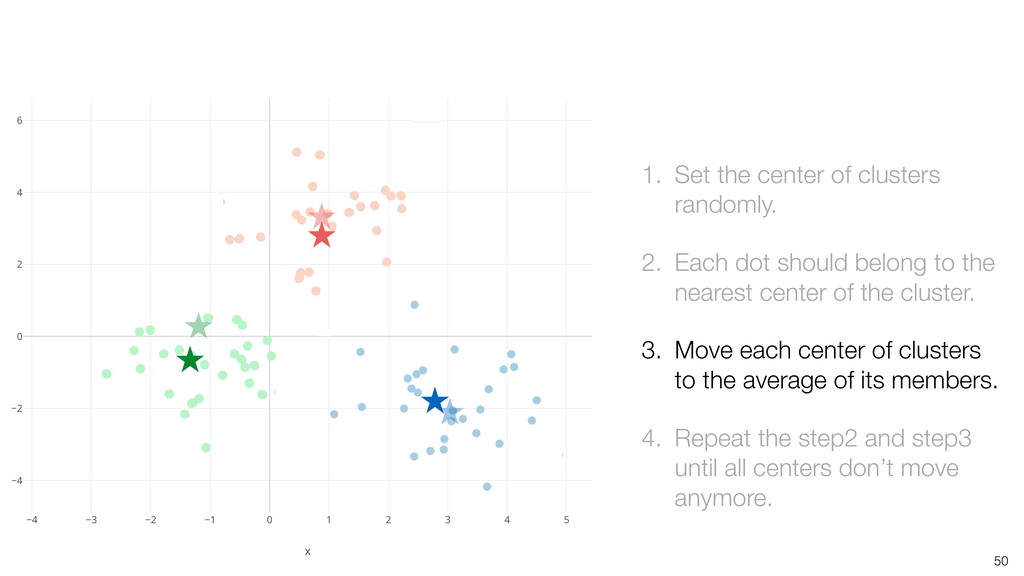
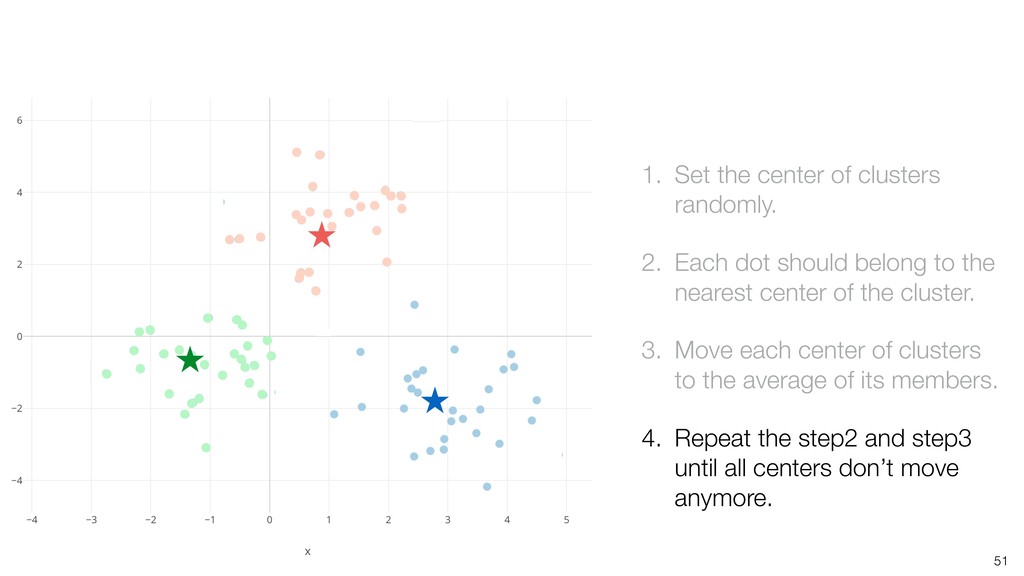
dot should belong to the nearest center of the cluster. 3. Move each center of clusters to the average of its members. 4. Repeat the step2 and step3 until all centers don’t move anymore.
dot should belong to the nearest center of the cluster. 3. Move each center of clusters to the average of its members. 4. Repeat the step2 and step3 until all centers don’t move anymore.
dot should belong to the nearest center of the cluster. 3. Move each center of clusters to the average of its members. 4. Repeat the step2 and step3 until all centers don’t move anymore.
dot should belong to the nearest center of the cluster. 3. Move each center of clusters to the average of its members. 4. Repeat the step2 and step3 until all centers don’t move anymore.
dot should belong to the nearest center of the cluster. 3. Move each center of clusters to the average of its members. 4. Repeat the step2 and step3 until all centers don’t move anymore.
dot should belong to the nearest center of the cluster. 3. Move each center of clusters to the average of its members. 4. Repeat the step2 and step3 until all centers don’t move anymore.
dot should belong to the nearest center of the cluster. 3. Move each center of clusters to the average of its members. 4. Repeat the step2 and step3 until all centers don’t move anymore.
dot should belong to the nearest center of the cluster. 3. Move each center of clusters to the average of its members. 4. Repeat the step2 and step3 until all centers don’t move anymore.
dot should belong to the nearest center of the cluster. 3. Move each center of clusters to the average of its members. 4. Repeat the step2 and step3 until all centers don’t move anymore.
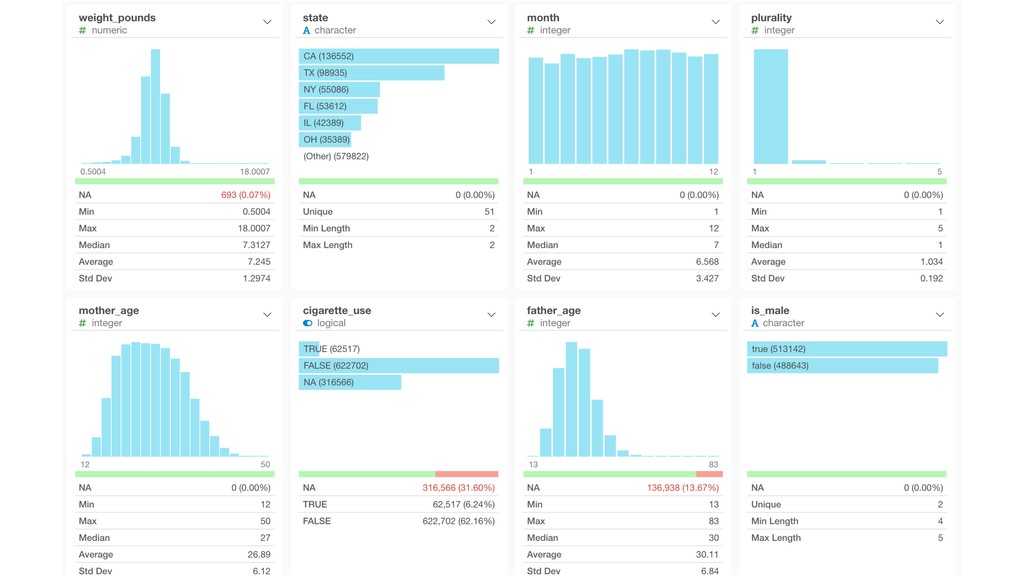
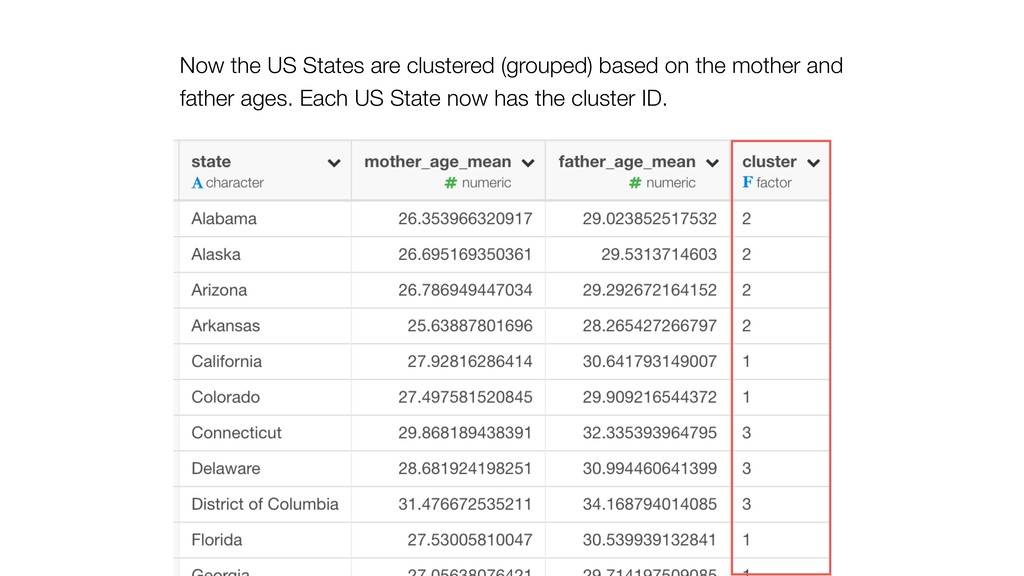
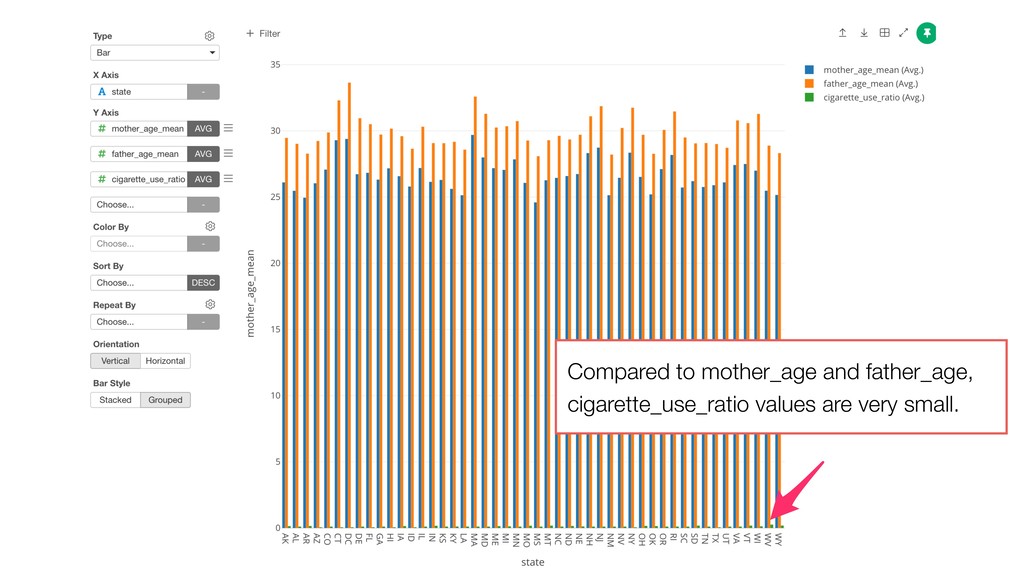
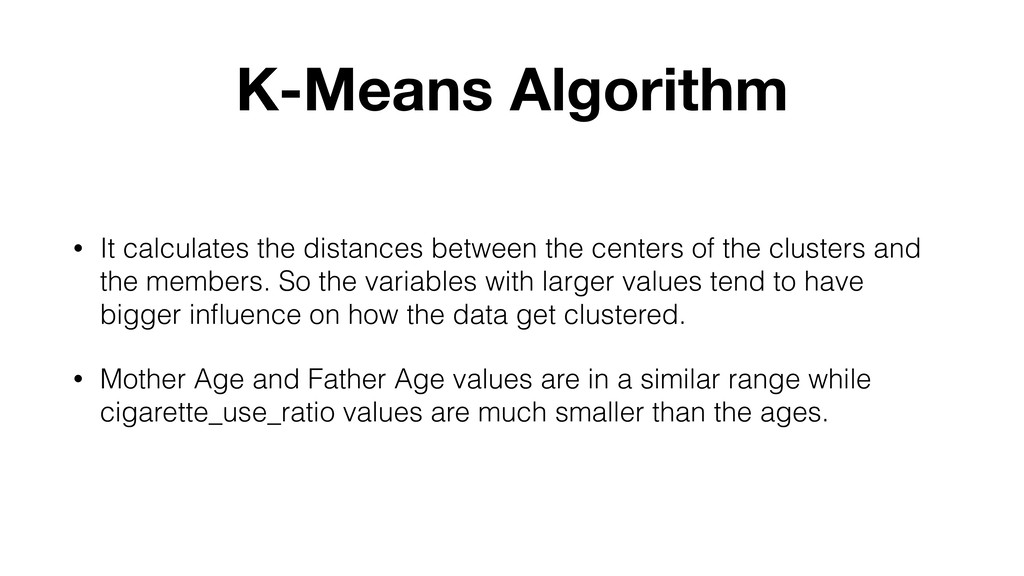
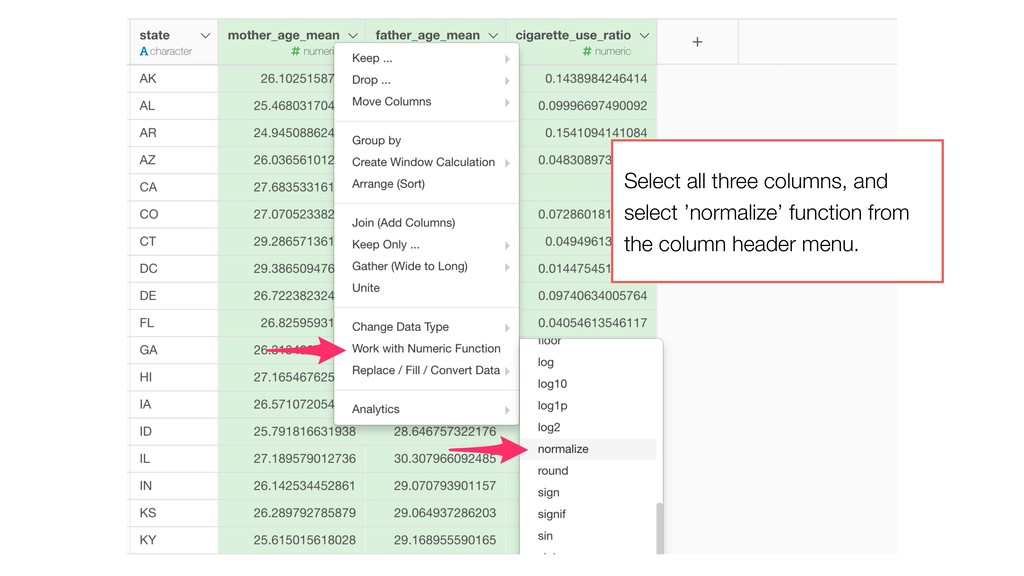
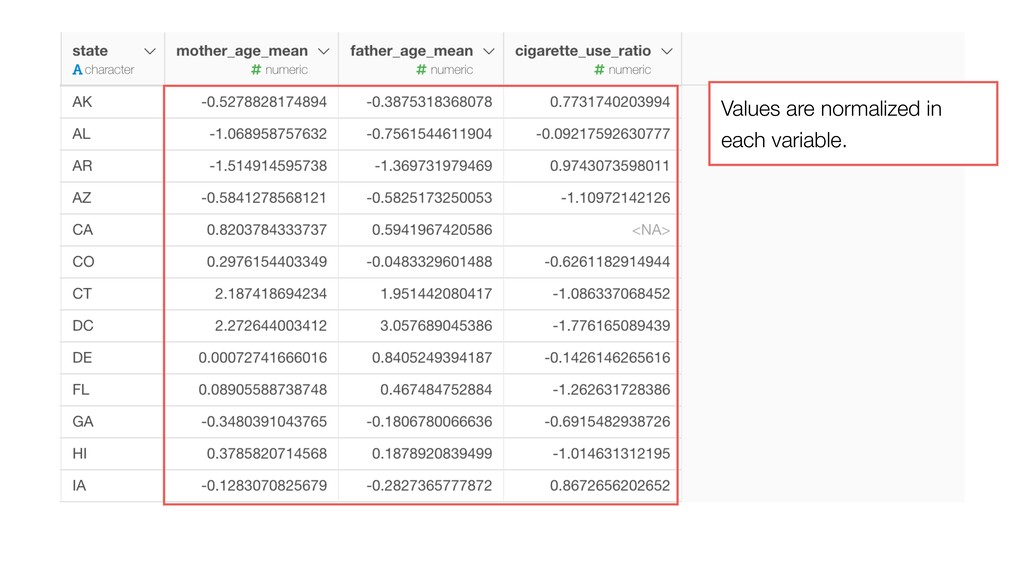
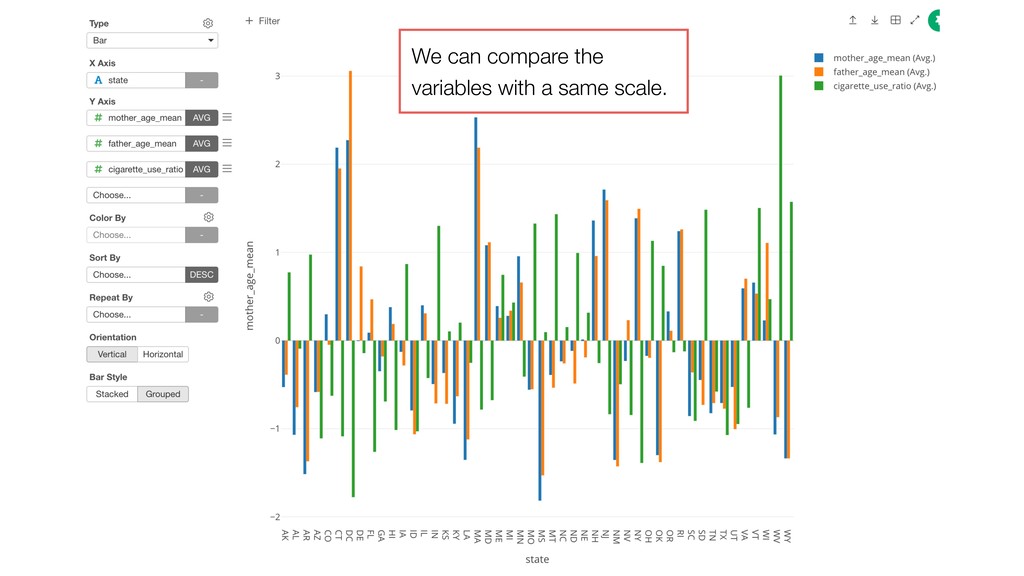
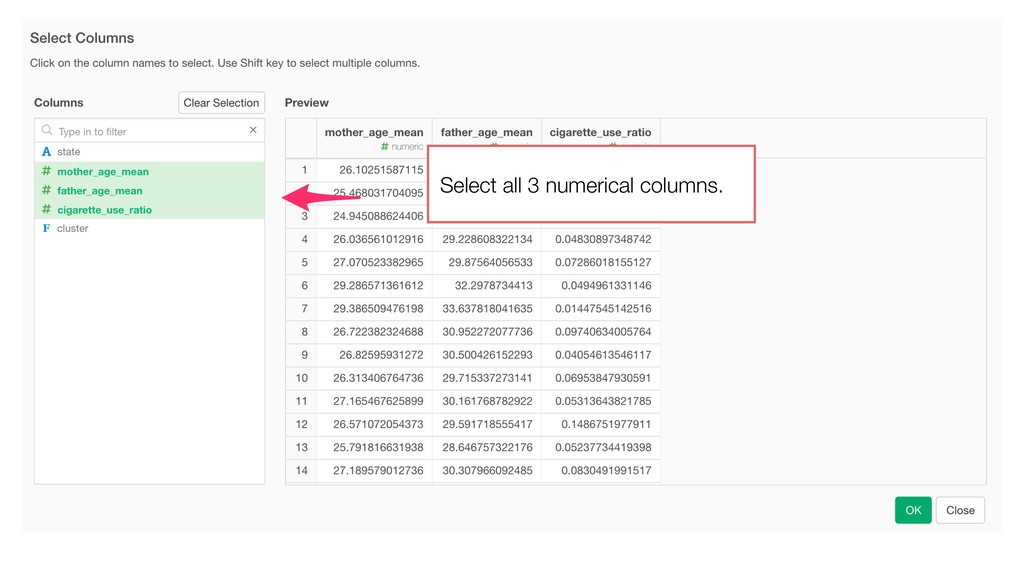
of the clusters and the members. So the variables with larger values tend to have bigger influence on how the data get clustered. • Mother Age and Father Age values are in a similar range while cigarette_use_ratio values are much smaller than the ages.
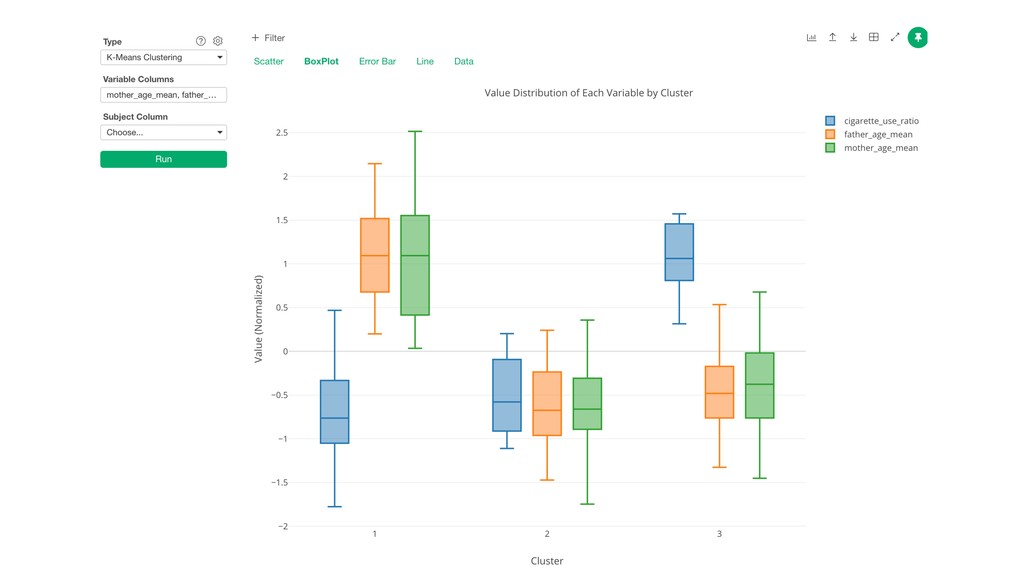
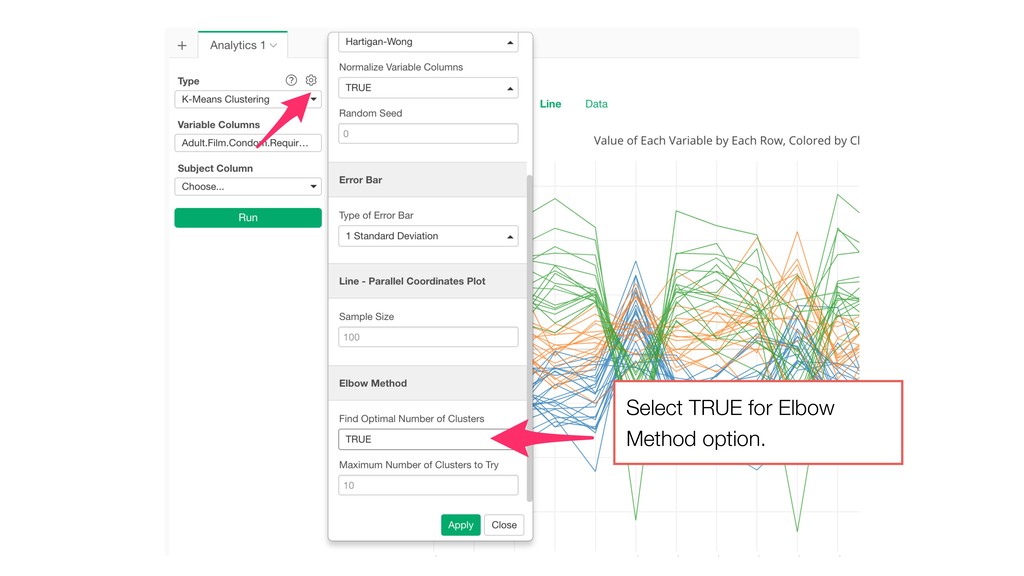
Model and generate a set of pre- defined charts to help you understand the characters of the clusters. • It normalizes the data before building the model.
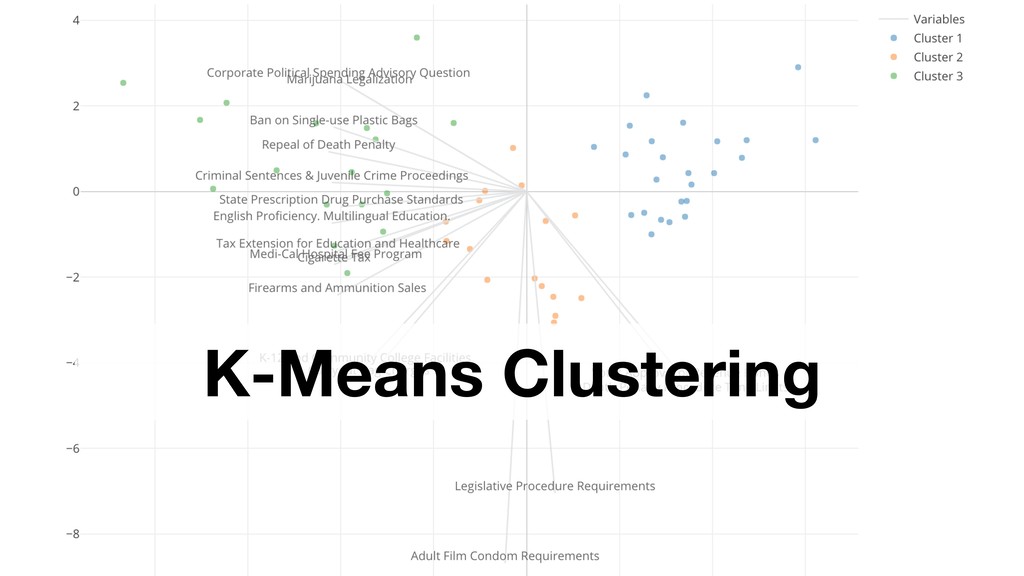
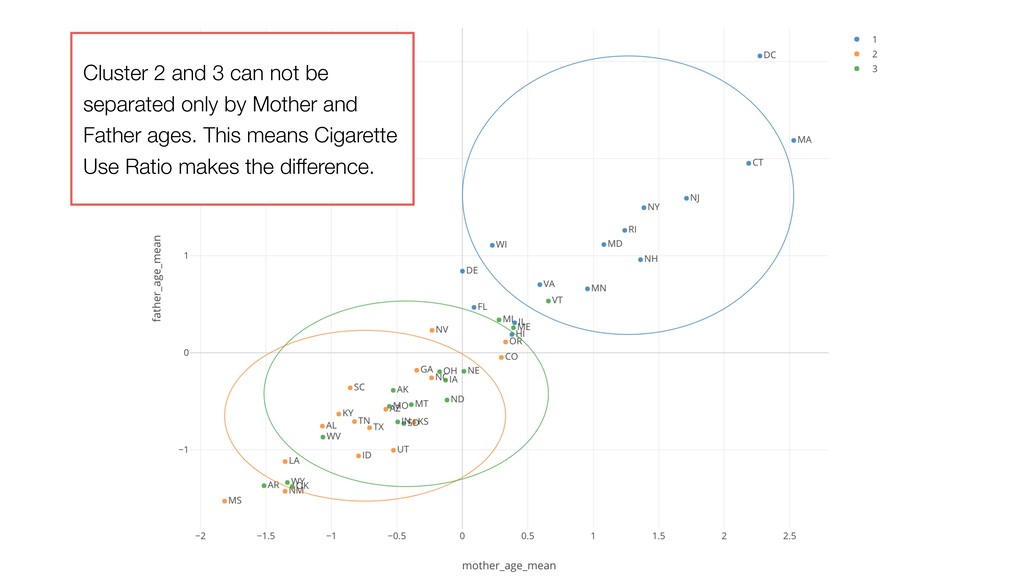
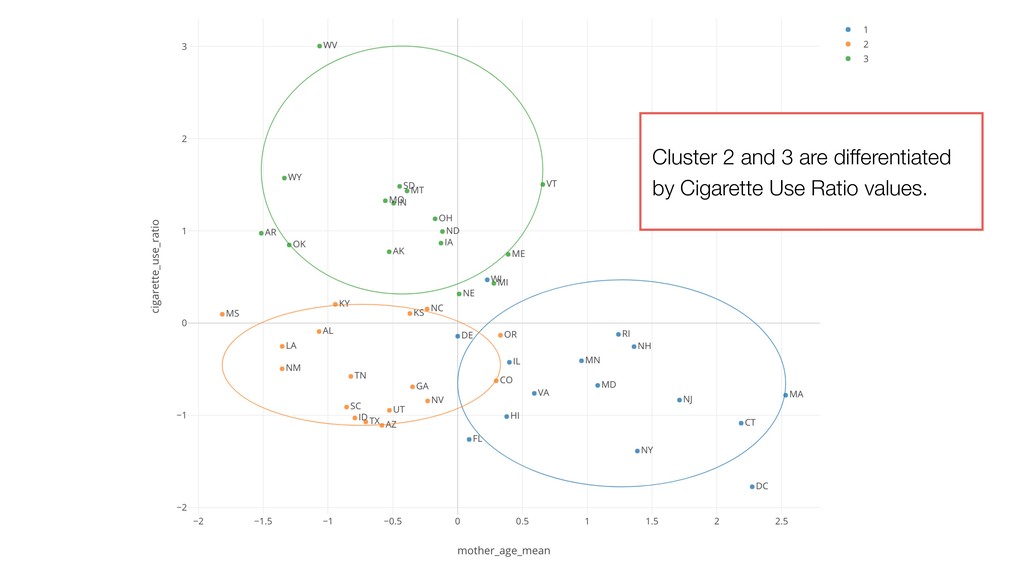
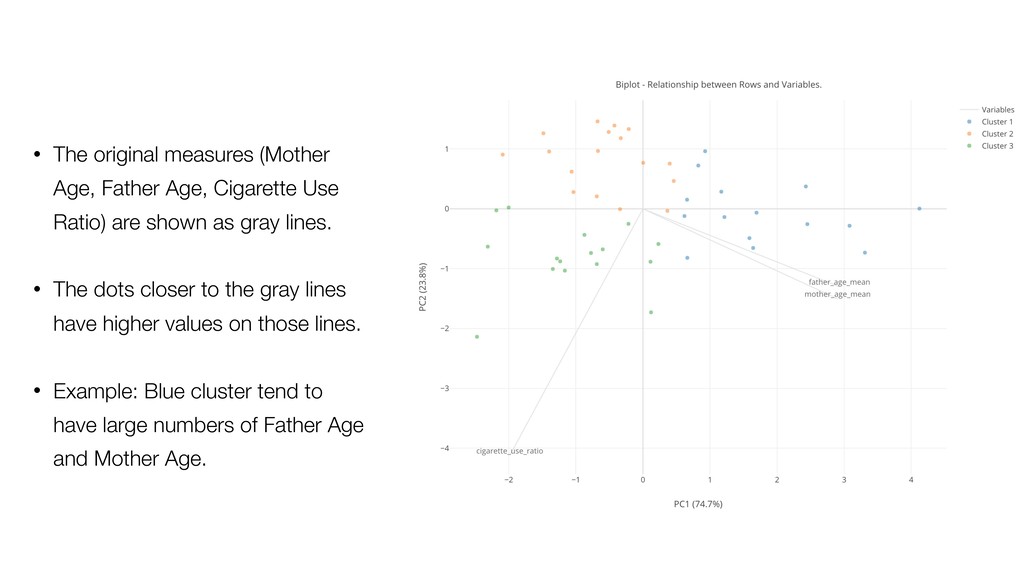
Ratio) are shown as gray lines. • The dots closer to the gray lines have higher values on those lines. • Example: Blue cluster tend to have large numbers of Father Age and Mother Age.
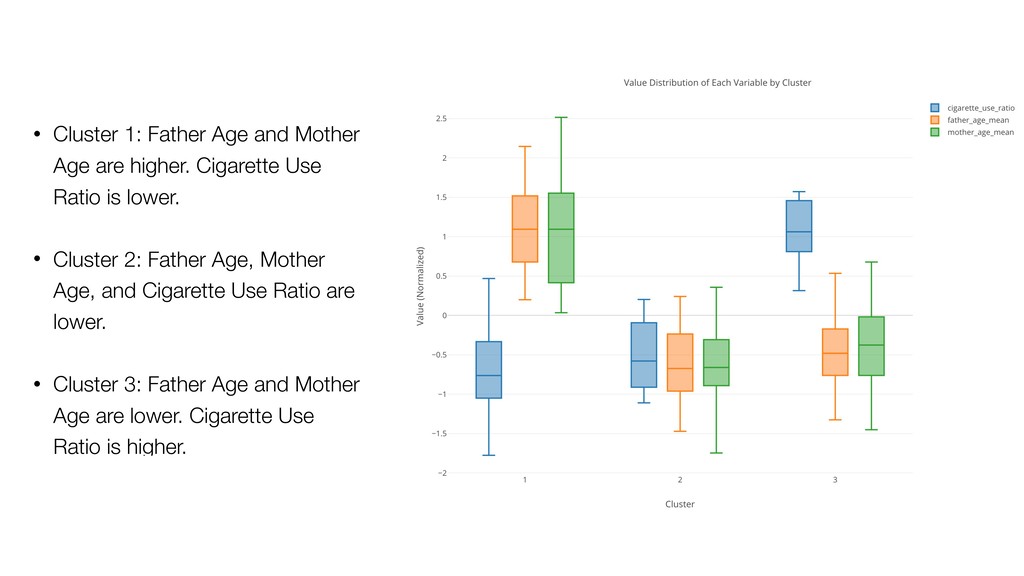
Cigarette Use Ratio is lower. • Cluster 2: Father Age, Mother Age, and Cigarette Use Ratio are lower. • Cluster 3: Father Age and Mother Age are lower. Cigarette Use Ratio is higher.
Better Take a look at the following blog post for more details. (https://exploratory.io/note/kanaugust/Introduction-to-K-Means-Clustering-under-Analytics-View-bjW2EZc3Ge)
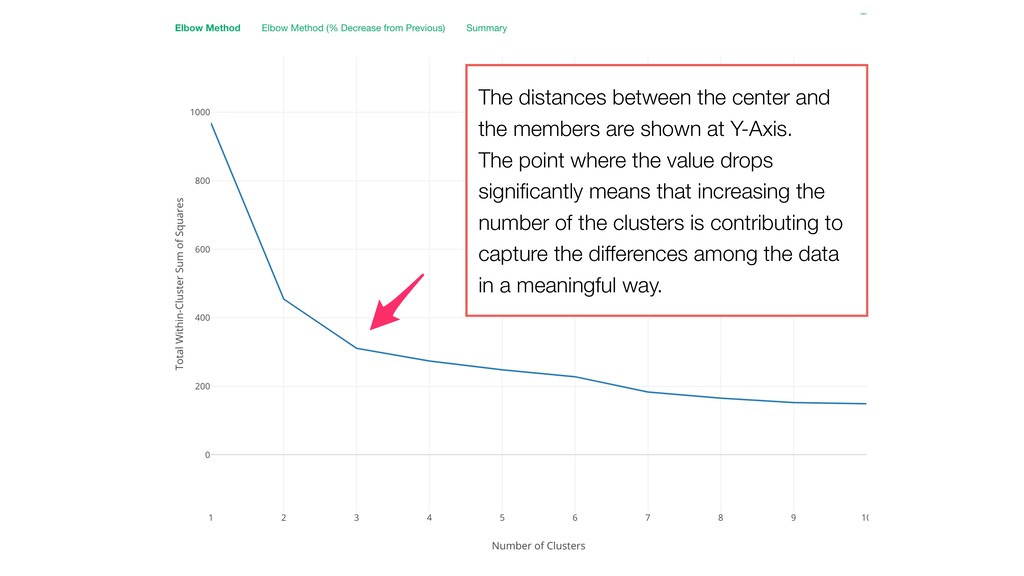
at Y-Axis. The point where the value drops significantly means that increasing the number of the clusters is contributing to capture the differences among the data in a meaningful way.
/ Time Data and Visualize It Planned • Analytics 101 - When to use which algorithms? • Data Wrangling: Introduction to Regular Expression https://exploratory.io/online-seminar
![Contact Email [email protected] Data Science Training https://exploratory.io/training Twitter @KanAugust Online](https://files.speakerdeck.com/presentations/ece5396618fd4daca90b54ae6f3de757/slide_99.jpg)