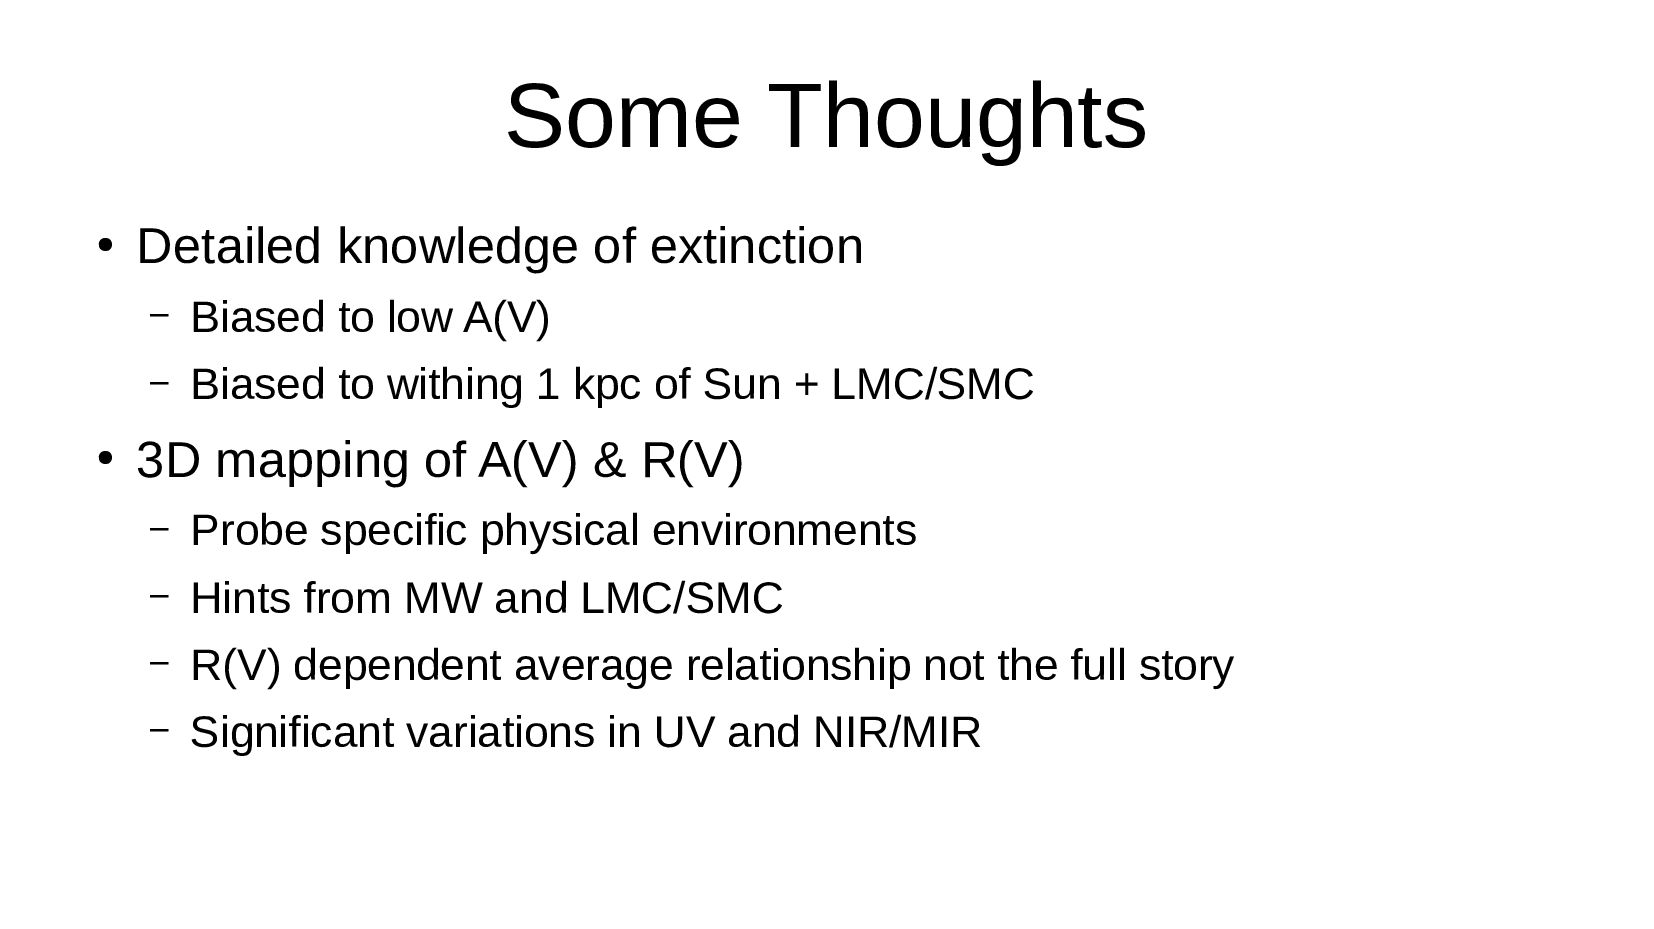
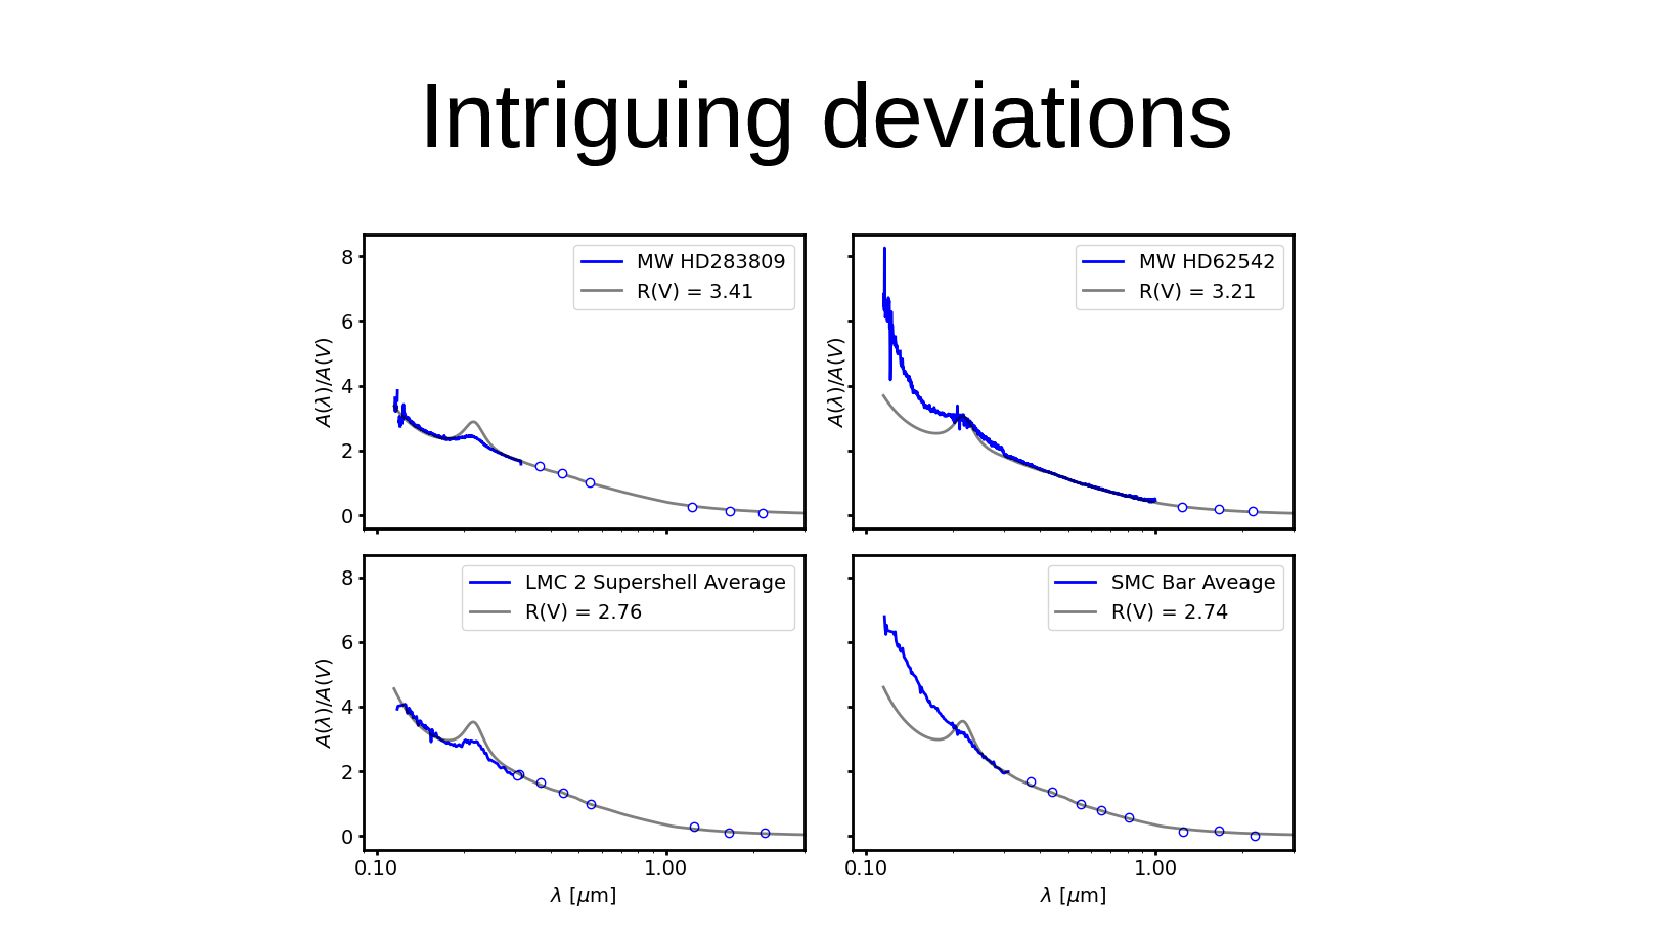
low A(V) – Biased to withing 1 kpc of Sun + LMC/SMC • 3D mapping of A(V) & R(V) – Probe specific physical environments – Hints from MW and LMC/SMC – R(V) dependent average relationship not the full story – Significant variations in UV and NIR/MIR
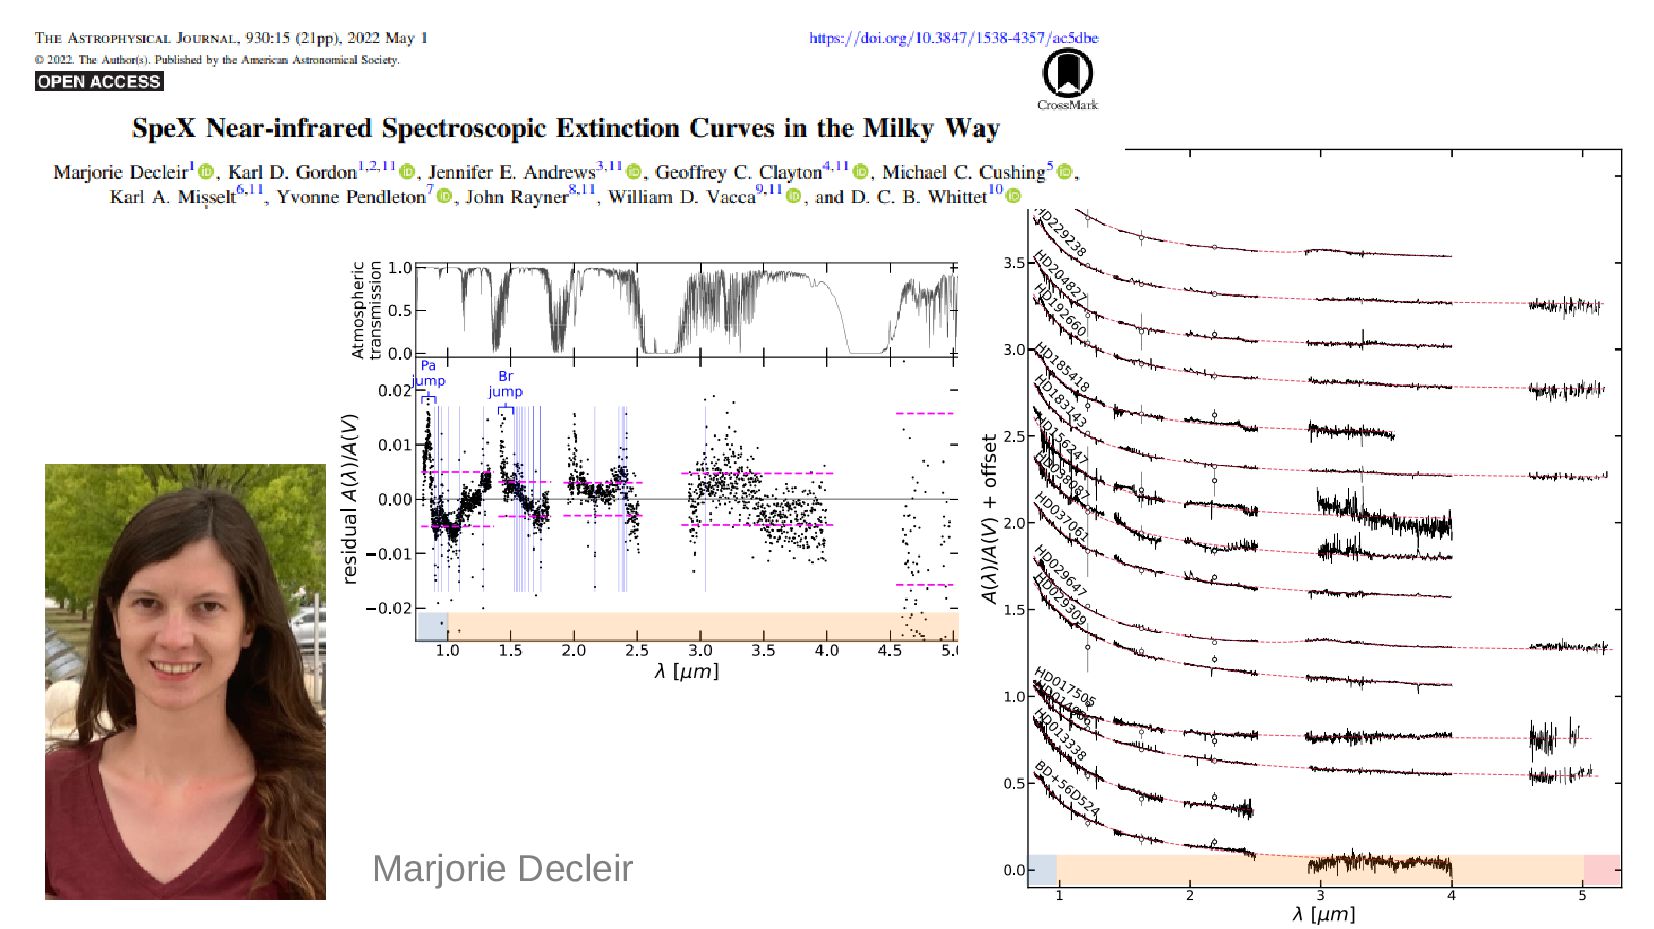
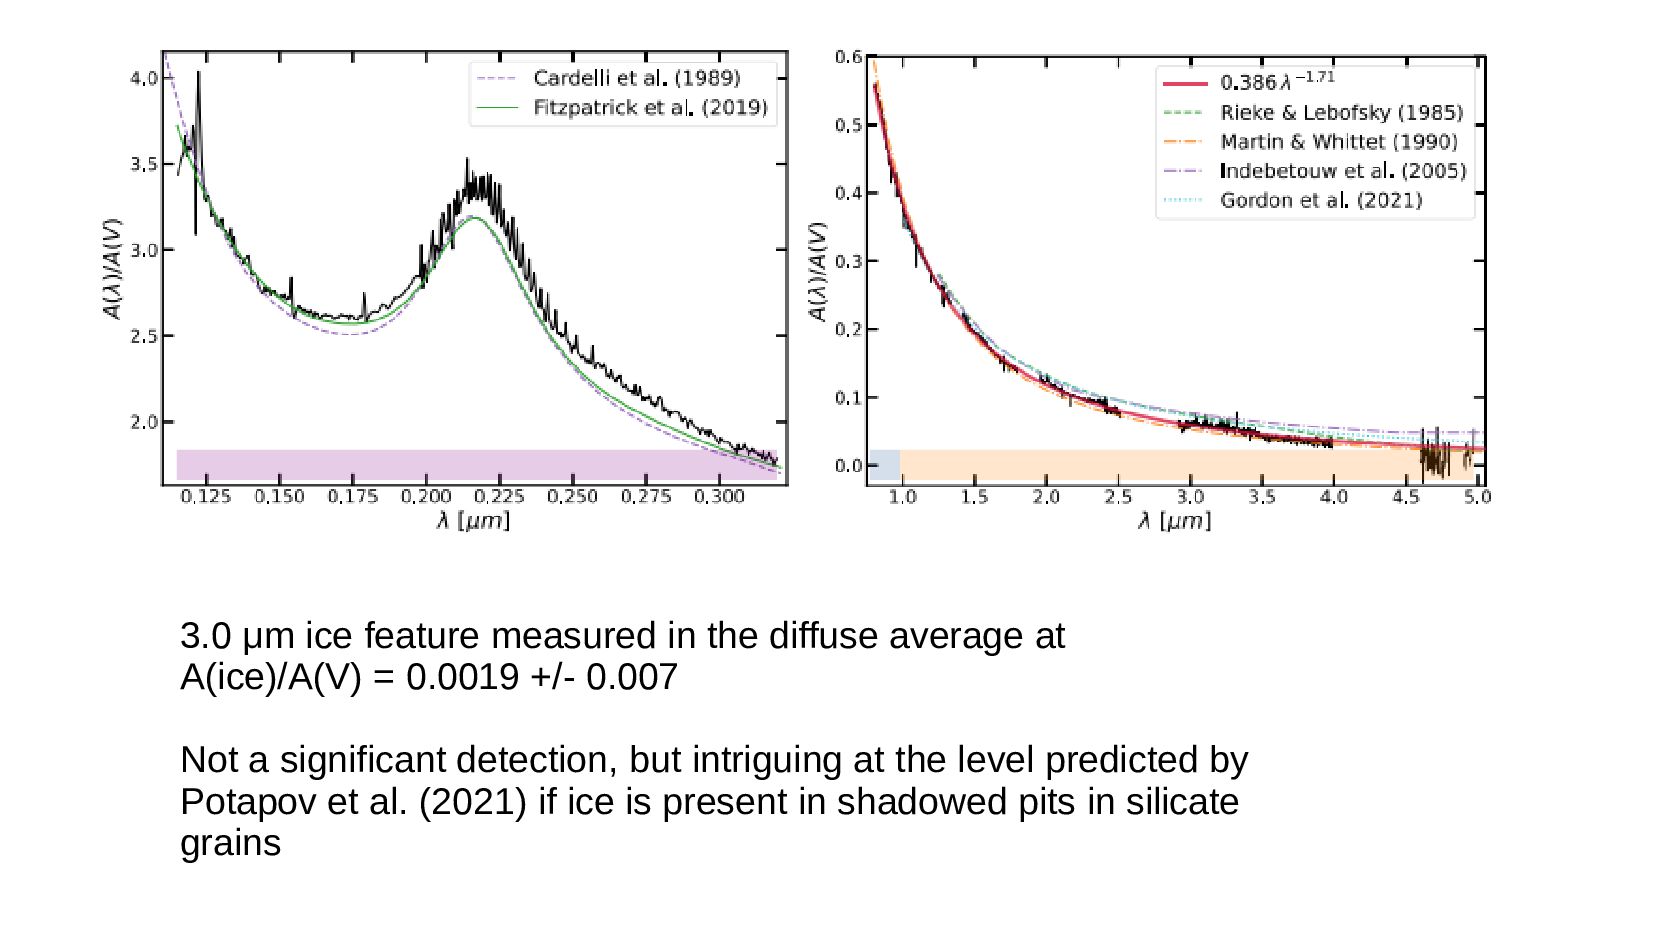
A(ice)/A(V) = 0.0019 +/- 0.007 Not a significant detection, but intriguing at the level predicted by Potapov et al. (2021) if ice is present in shadowed pits in silicate grains
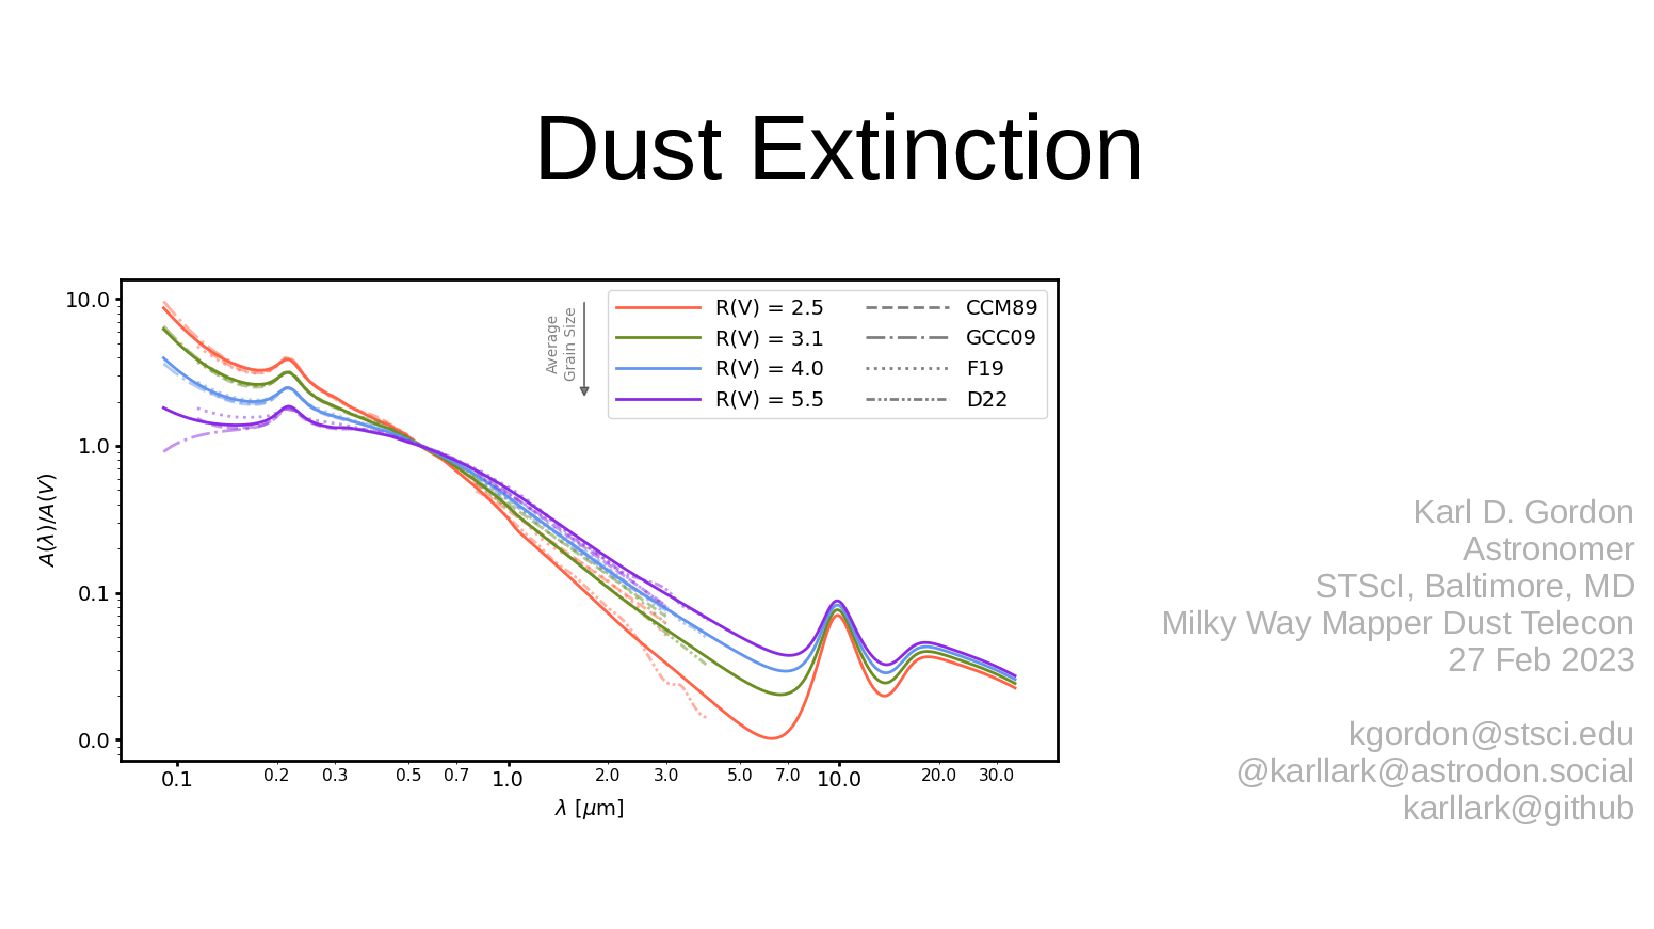
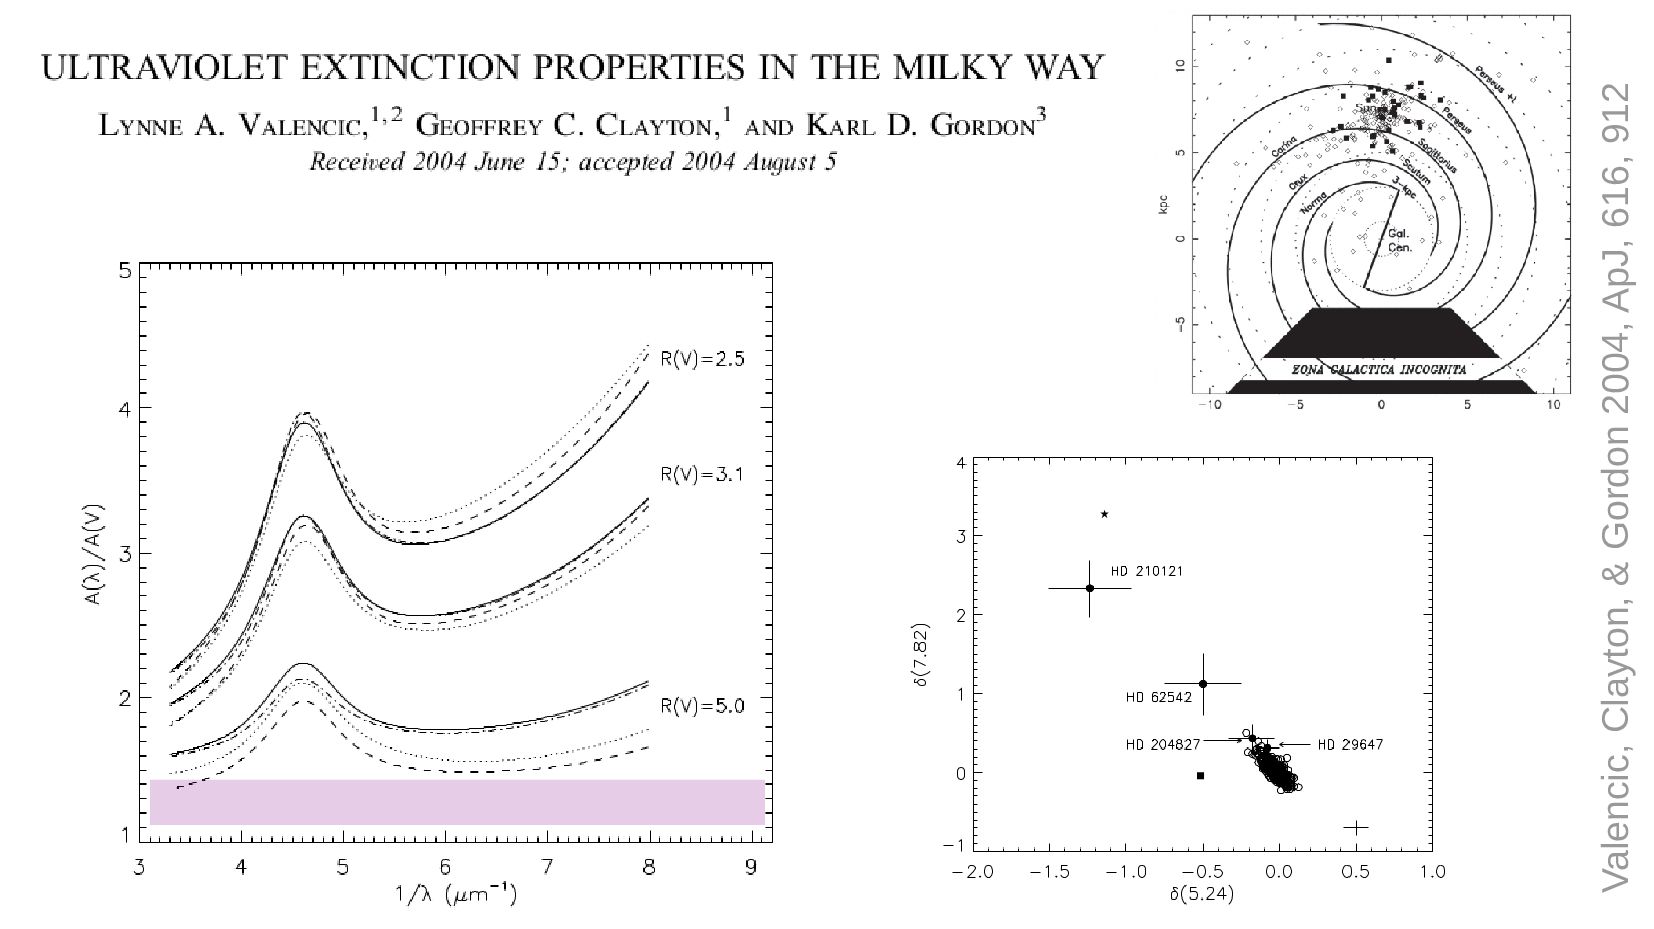
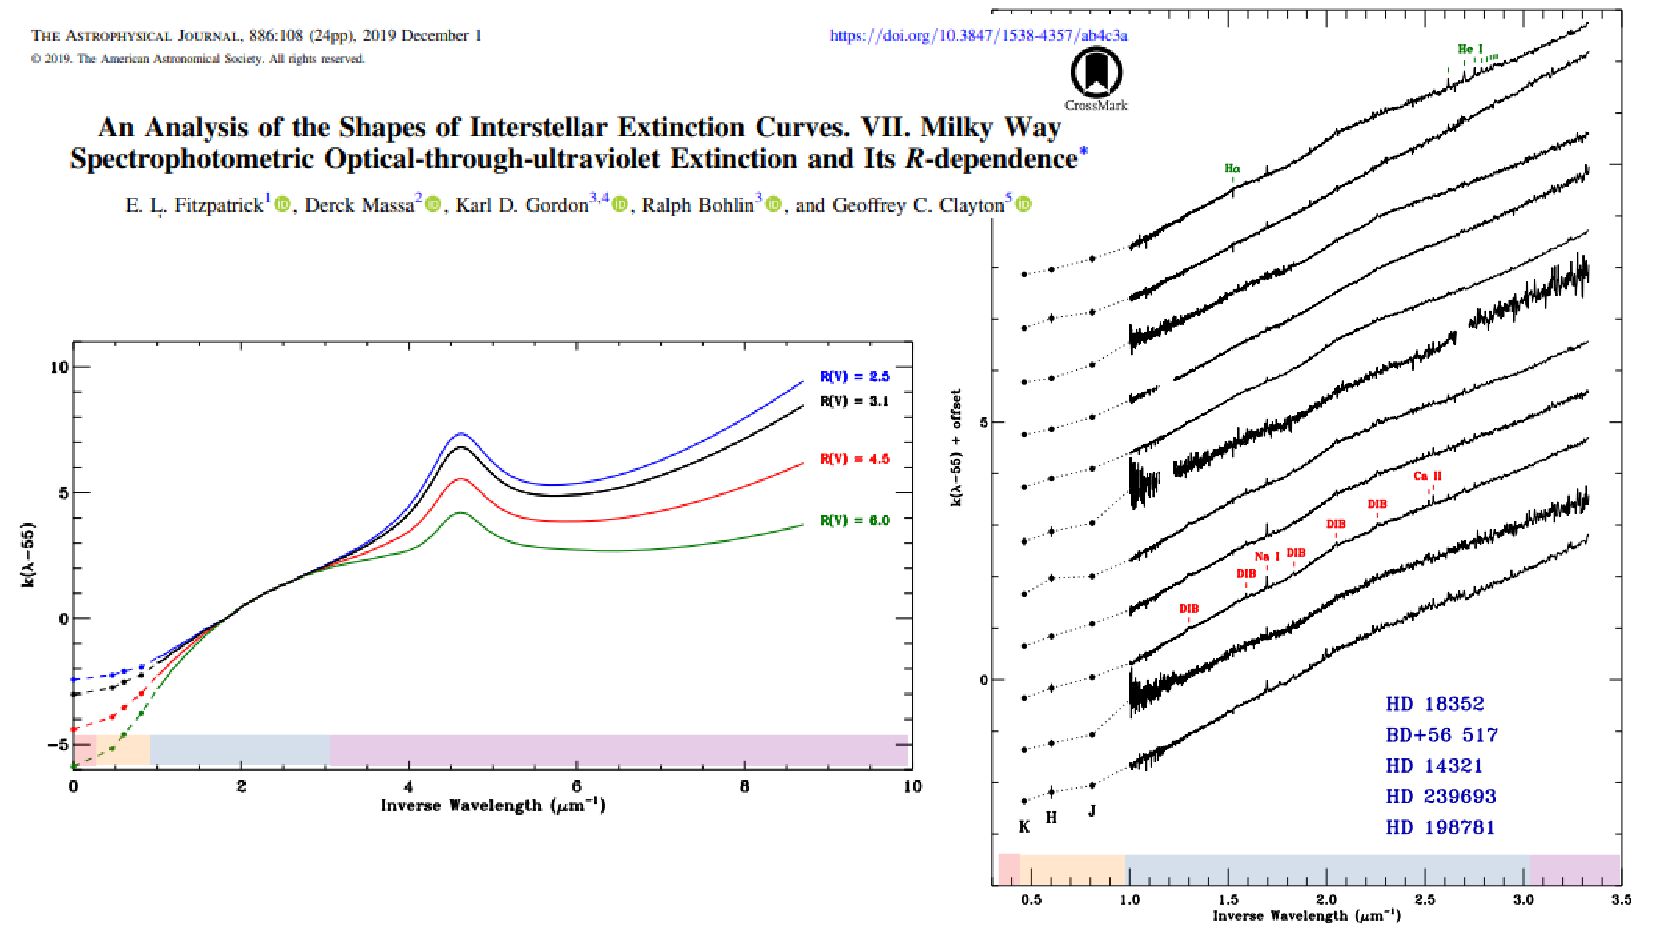
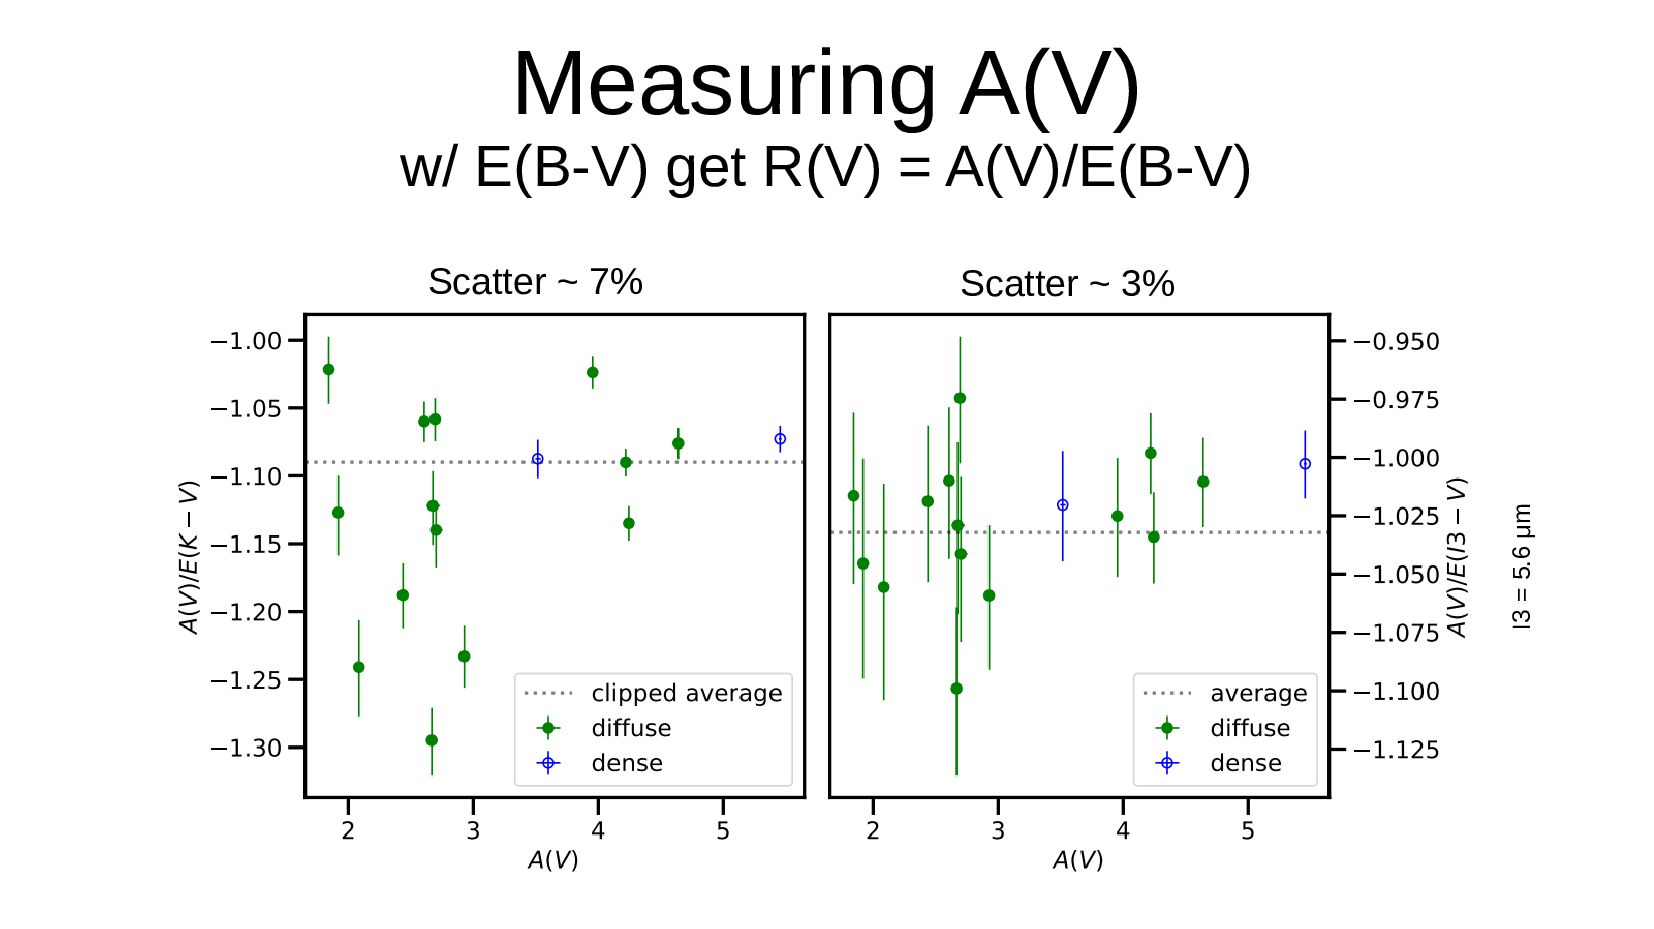
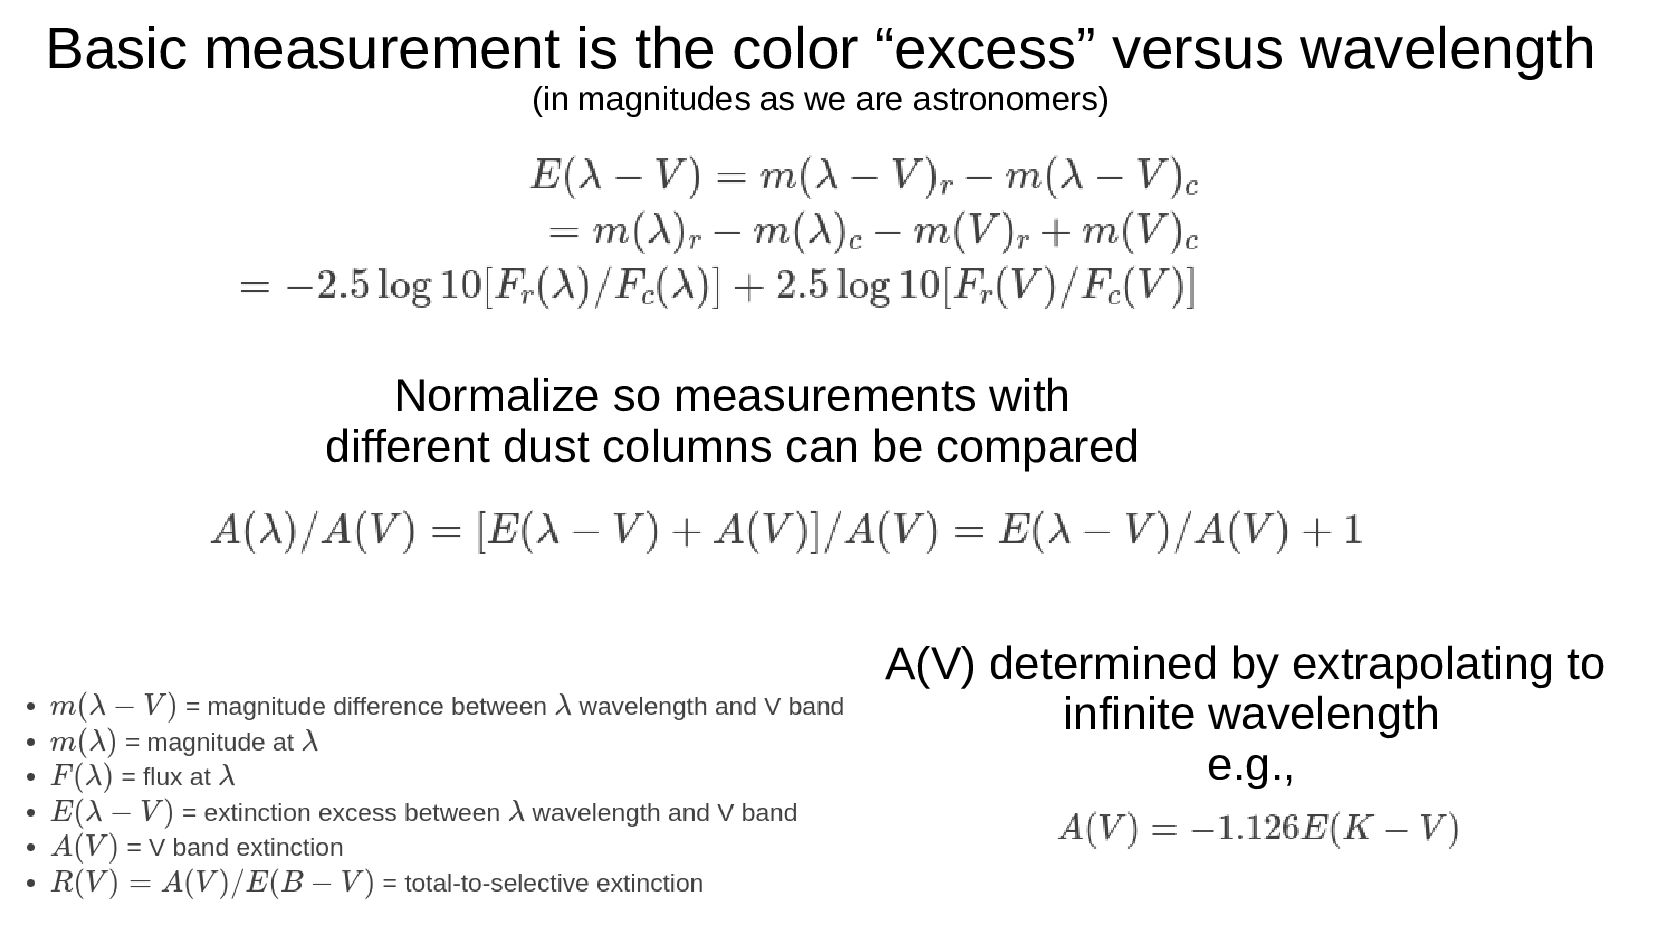
as we are astronomers) Normalize so measurements with different dust columns can be compared A(V) determined by extrapolating to infinite wavelength e.g.,