$30 off During Our Annual Pro Sale. View Details »

Dust Extinction in the Diffuse Interstellar Medium

Karl Gordon
November 01, 2022

Dust Extinction in the Diffuse Interstellar Medium

ASIAA Colloquium talk given 1-2 Nov 2022 remotely

Karl Gordon

November 01, 2022
Tweet

More Decks by Karl Gordon

Other Decks in Science

Transcript

  1. Dust Extinction in the
    Diffuse Interstellar Medium
    Karl D. Gordon
    Astronomer
    STScI, Baltimore, MD
    ASIAA Colloquium
    1 Nov 2022
    [email protected]
    @karllark2000
    karllark@github
    “Have Dust – Will Study”
    Slides on speakerdeck

    View Slide

  2. Summary

    Extinction measurements are fundamental to understanding dust

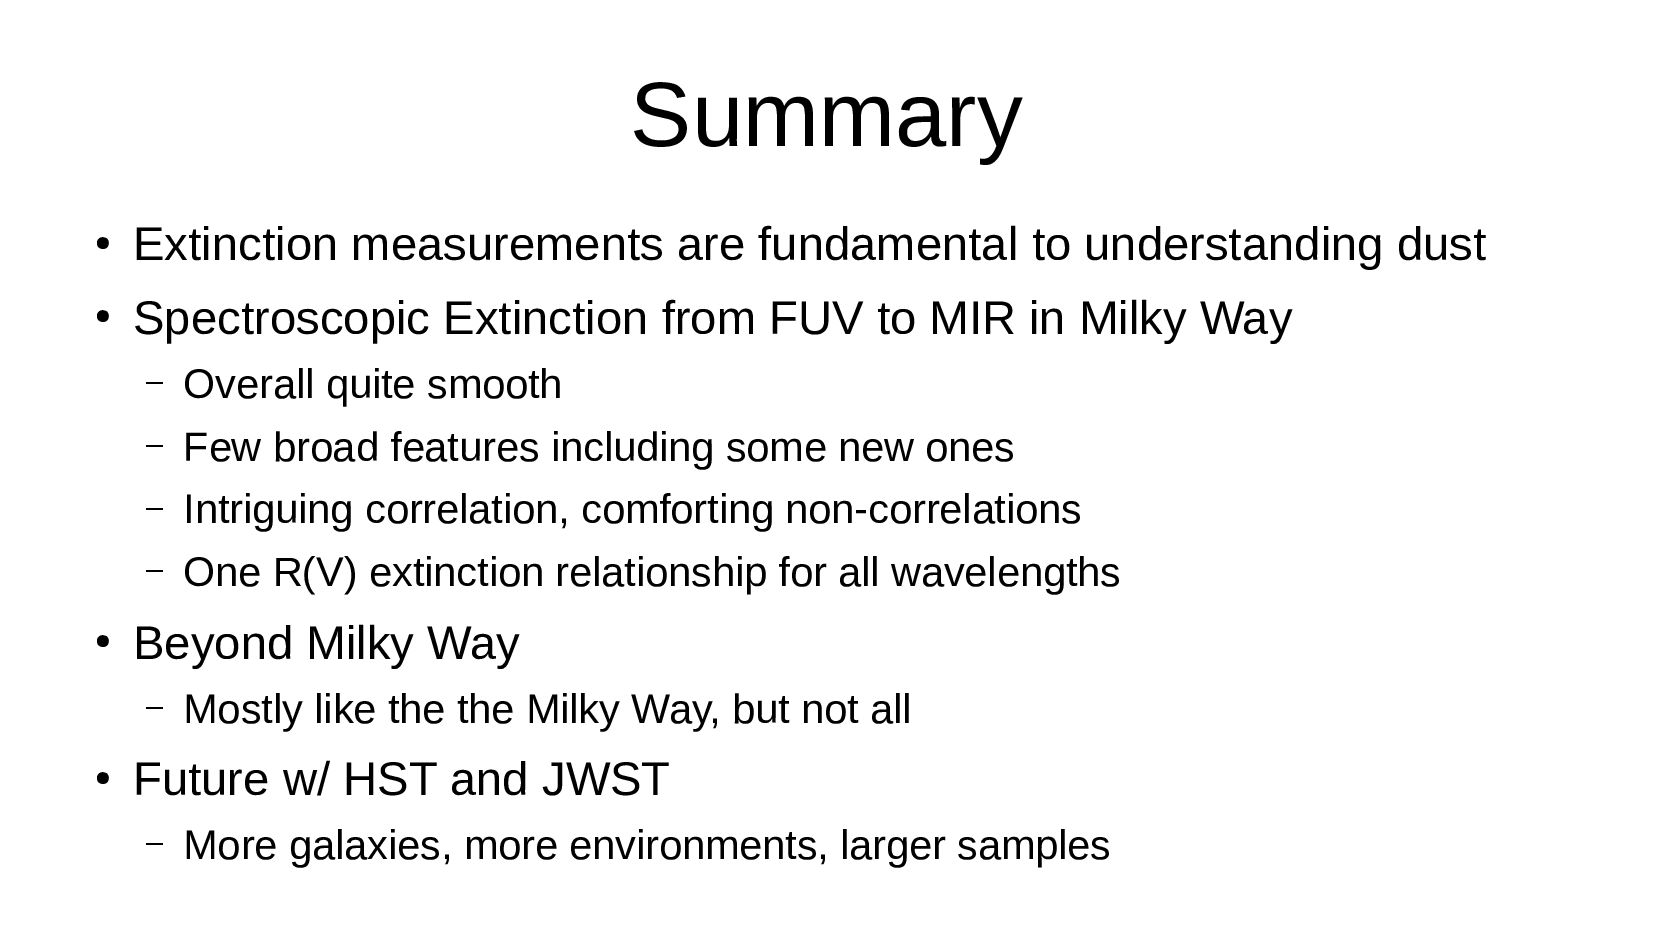
    Spectroscopic Extinction from FUV to MIR in Milky Way
    – Overall quite smooth
    – Few broad features including some new ones
    – Intriguing correlation, comforting non-correlations
    – One R(V) extinction relationship for all wavelengths

    Beyond Milky Way
    – Mostly like the the Milky Way, but not all

    Future w/ HST and JWST
    – More galaxies, more environments, larger samples

    View Slide

  3. Extinction

    Critical clues to dust grain abundance, size, composition,
    and shape

    Clues in the continuum and features

    Straightforward measurement

    Focus on spectroscopic measurements

    Biased by my views, not comprehensive

    View Slide

  4. Not Covered

    Dust scattering (e.g., albedo, scattering phase function)

    Dust emission

    Atomic composition of dust (e.g., depletions)

    Dust Polarization

    Dust grain models

    All important, but not the focus of this talk

    View Slide

  5. Extinction (not Attenuation)

    Extinction
    – Absorption and scattering out 
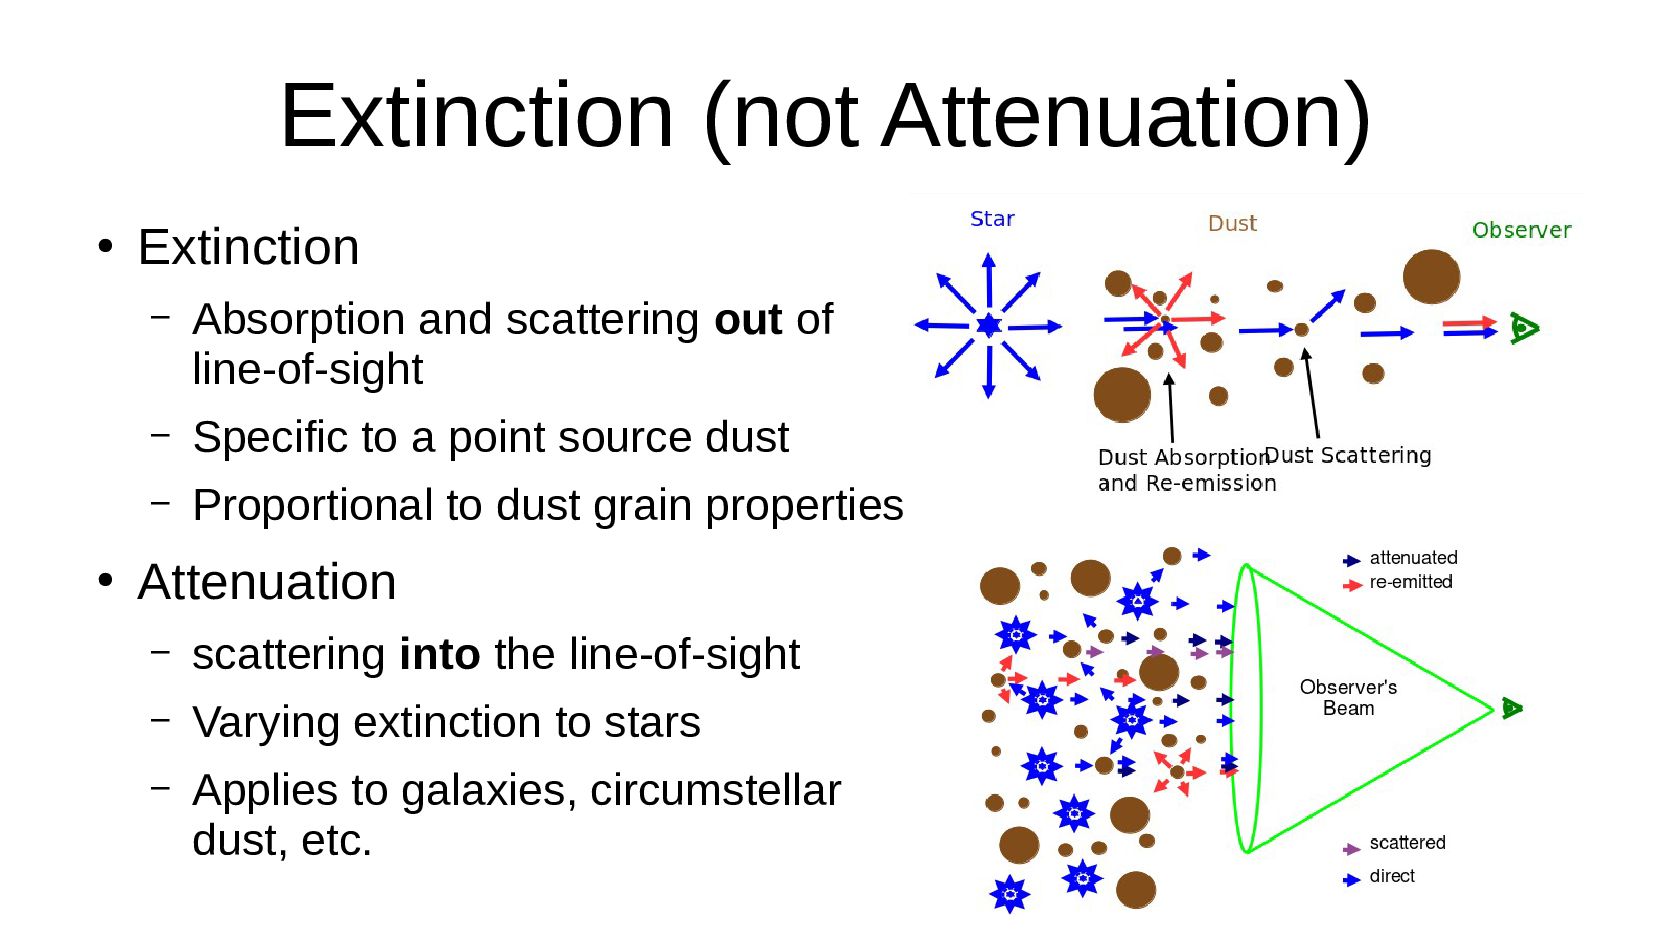
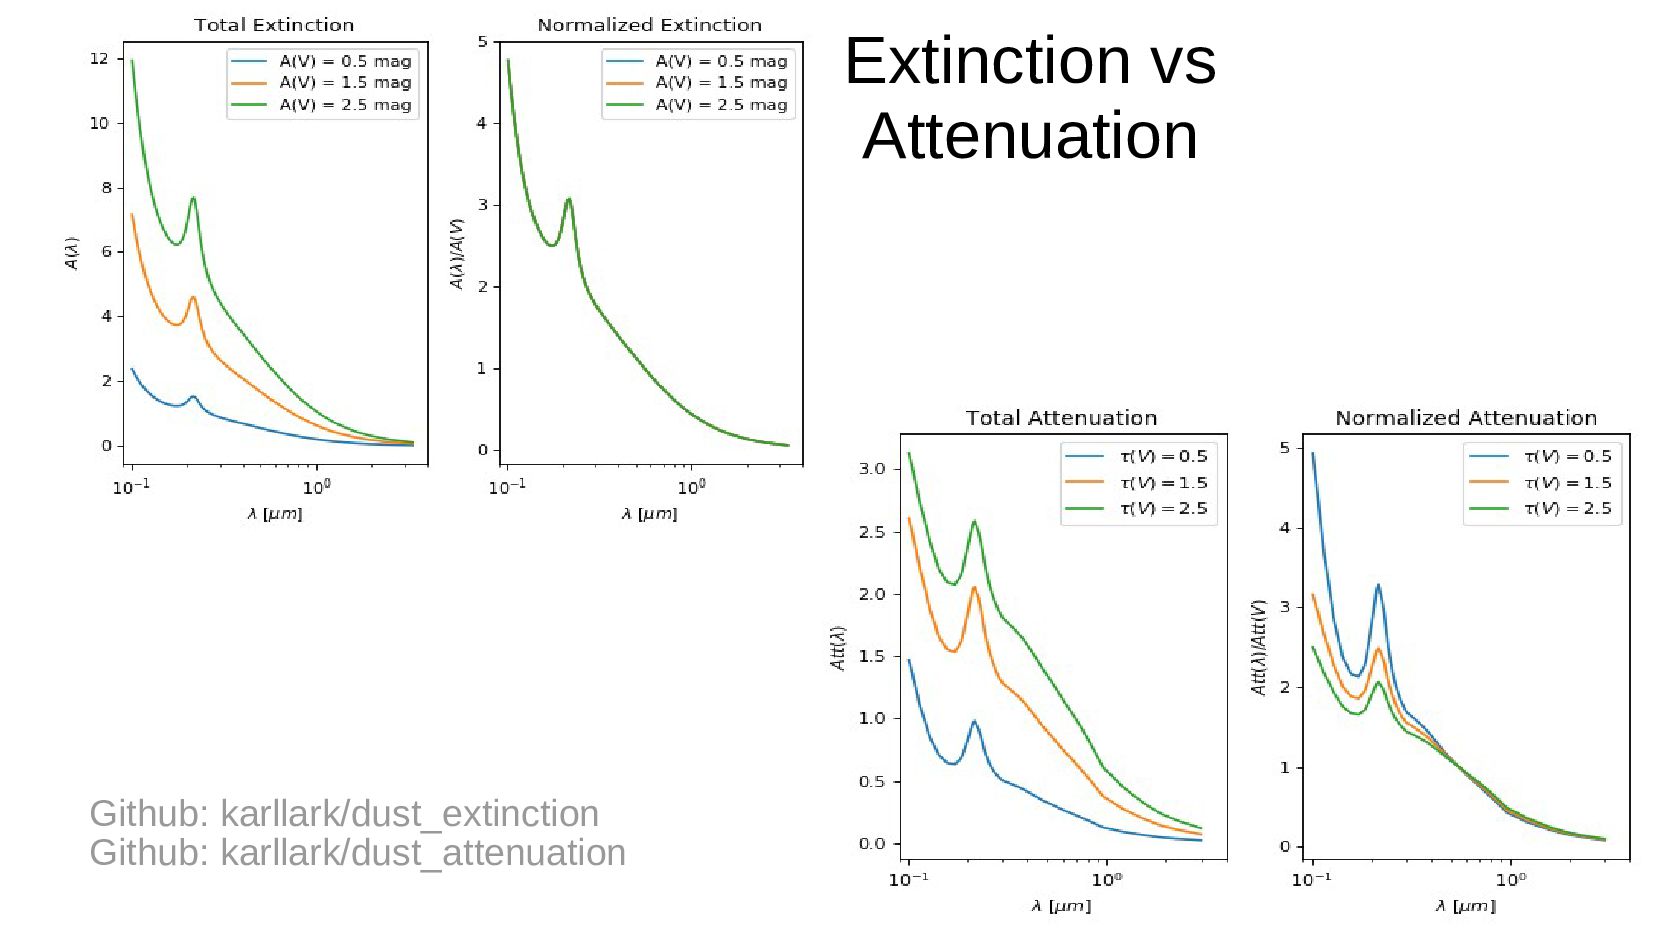
of
    line-of-sight
    – Specific to a point source dust
    – Proportional to dust grain properties

    Attenuation
    – scattering into the line-of-sight
    – Varying extinction to stars
    – Applies to galaxies, circumstellar
    dust, etc.

    View Slide

  6. Extinction vs
    Attenuation
    Github: karllark/dust_attenuation
    Github: karllark/dust_extinction

    View Slide

  7. Pair Method
    Github: karllark/measure_extinction
    OB stars ideal targets
    Luminous at all wavelengths
    Fairly simple atmospheres

    View Slide

  8. Basic measurement is the color “excess” versus wavelength
    (in magnitudes 
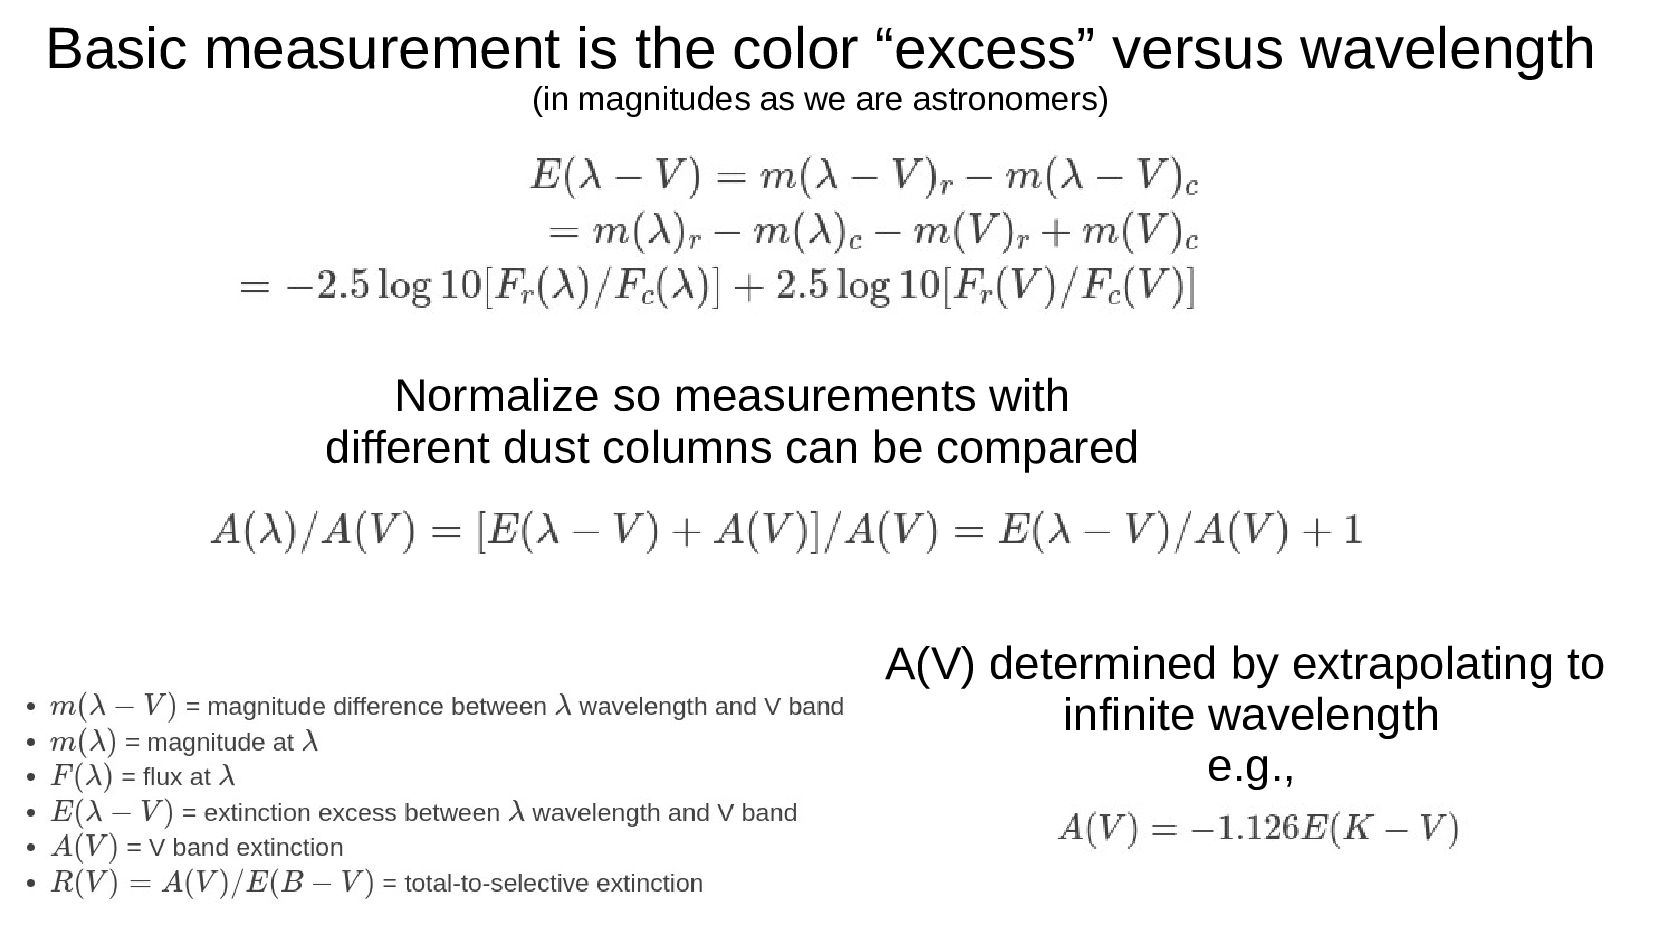
as we are astronomers)
    Normalize so measurements with
    different dust columns can be compared
    A(V) determined by extrapolating to
    infinite wavelength
    e.g.,

    View Slide

  9. Slide from Dries Van De Puttte

    View Slide

  10. Wavelength axis variations
    Allow full FUV-MIR extinction to be seen Wavelength scale is proportional to energy
    Emphasizes UV wavelengths
    Versus λ Versus 1/λ
    UV Opt NIR
    MIR

    View Slide

  11. Diffuse vs Dense Dust

    Diffuse sightlines
    – Most detailed 
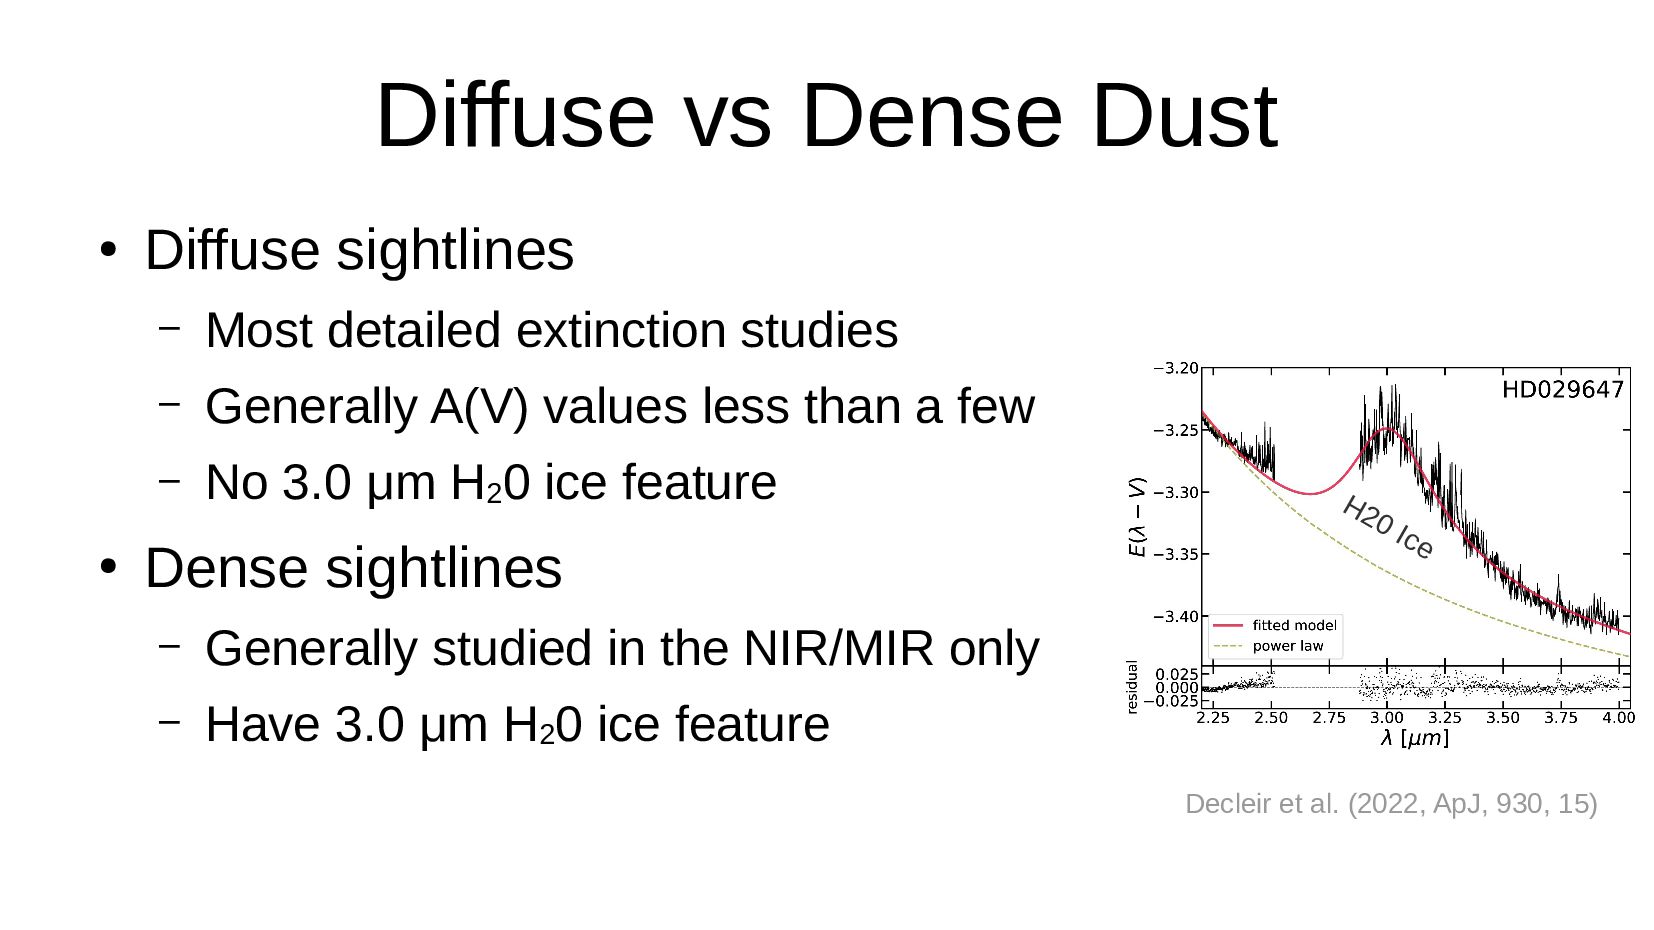
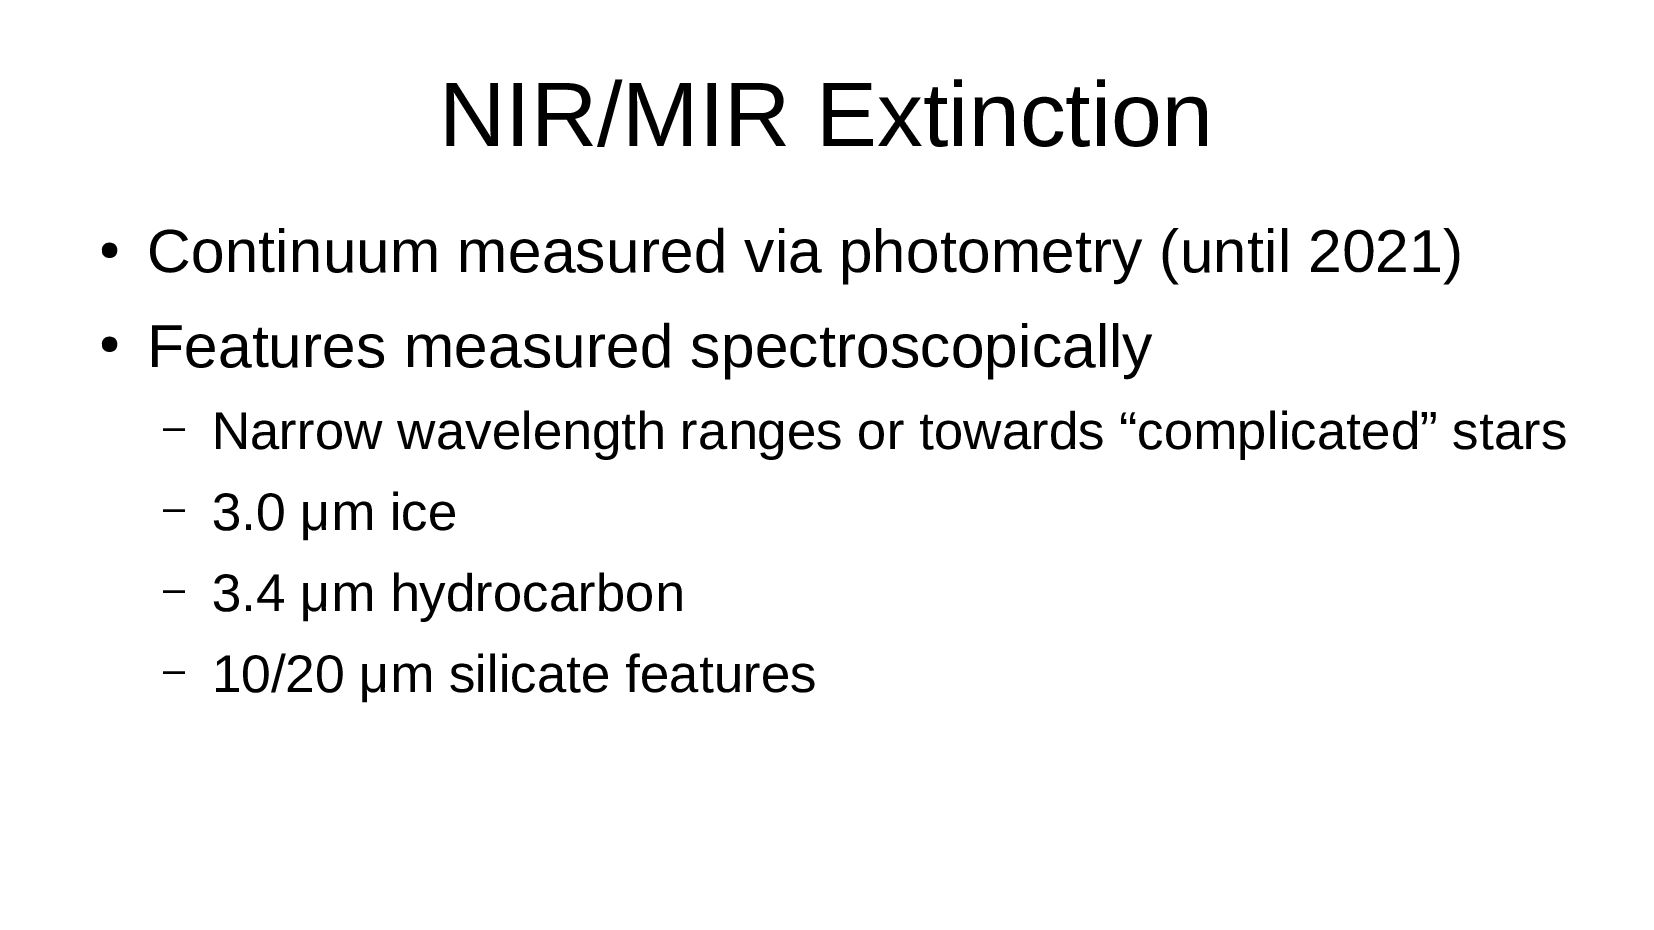
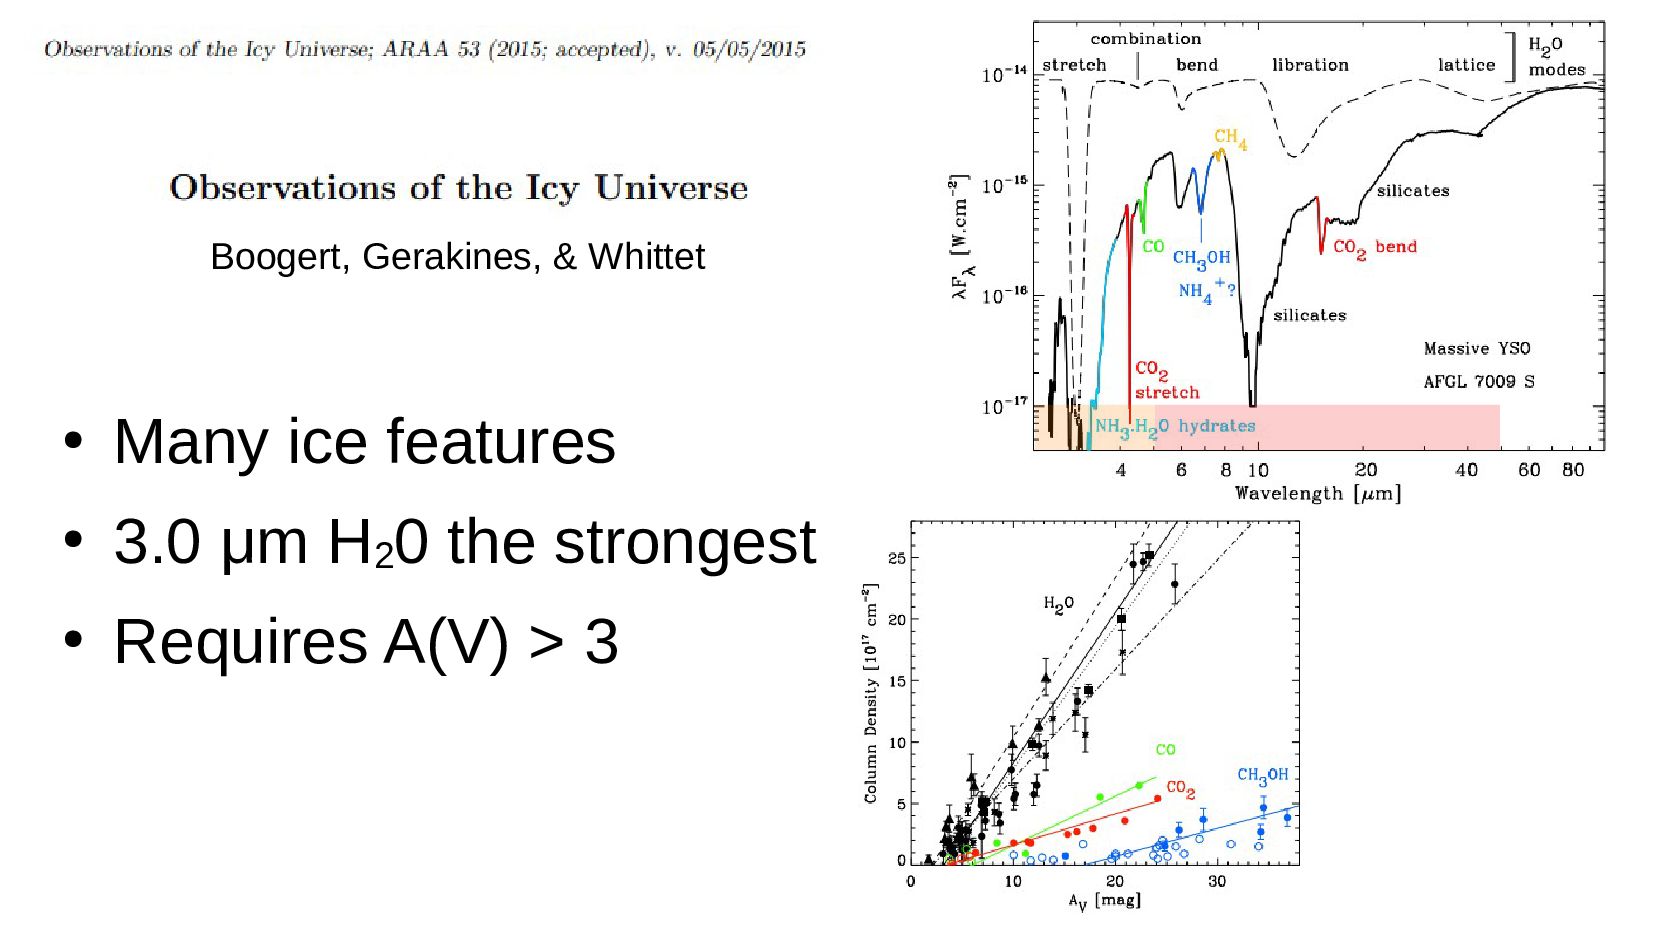
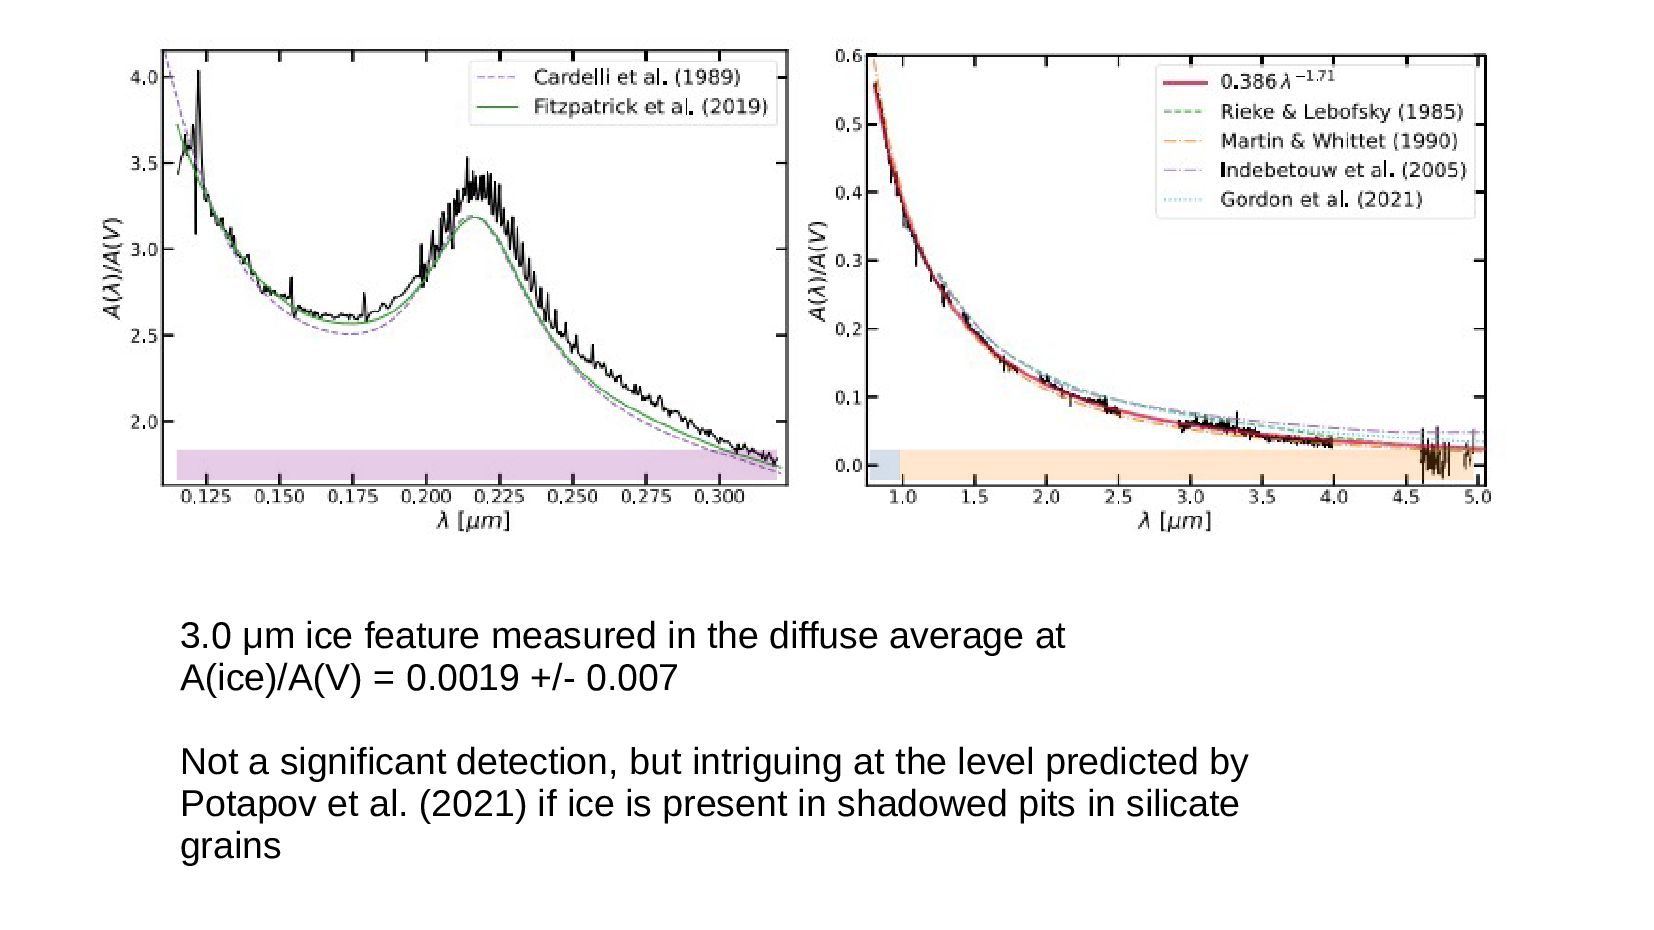
extinction studies
    – Generally A(V) values less than a few
    – No 3.0 μm H2
    0 ice feature

    Dense sightlines
    – Generally studied in the NIR/MIR only
    – Have 3.0 μm H2
    0 ice feature
    Decleir et al. (2022, ApJ, 930, 15)
    H20 Ice

    View Slide

  12. Our Galaxy

    View Slide

  13. Stecher 1969, ApJ, 157, 125

    View Slide

  14. International Ultraviolet Explorer
    18 years! 100,000 UV spectra!

    View Slide

  15. View Slide

  16. Witt, Bohlin, & Stecher 1984, 279, 698

    View Slide

  17. 2175 A Bump
    width → strong variation
    center → almost no variation
    Fitzpatrick & Massa (1986, ApJ, 307, 286)

    View Slide

  18. Fitzpatrick & Massa 1988, ApJ, 328, 734

    View Slide

  19. View Slide

  20. Cardelli, Clayton, & Mathis 1988, ApJ, 329L, 33; 1989, ApJ, 345, 245

    View Slide

  21. Valencic, Clayton, & Gordon 2004, ApJ, 616, 912

    View Slide

  22. Far Ultraviolet
    Spectroscopic
    Explorer
    905 to 1195 Å

    View Slide

  23. Gordon, Cartledge, & Clayton 2009, ApJ, 705, 1320

    View Slide

  24. FUV (& all UV) extinction smooth
    Residuals due to stellar or ISM HI
    FUV rise consistent with feature
    peaking at ~800 Å

    View Slide

  25. ApJ, in press
    Dries Van De Putte

    View Slide

  26. FUV rise extinction component & H2
    column
    Very strong correlation & goes through zero!!!
    Grain responsible for FUV rise and H2
    co-spatial
    Not the case for the
    2175 Å bump

    View Slide

  27. Hubble Space
    Telescope
    912 Å to 2.5 μm

    View Slide

  28. View Slide

  29. Broad Optical Features (origin unknown)
    Long known Very Broad Structure Explained!
    Massa, Fitzpatrick, Gordon, et al. 2020, ApJ, 891, 67
    Centers: 4370, 4870, & 6300 Å
    Widths: ~10%
    Two blue correlate w/ 2175 Å

    View Slide

  30. NIR/MIR Extinction

    Continuum measured via photometry (until 2021)

    Features measured spectroscopically
    – Narrow wavelength ranges or towards “complicated” stars
    – 3.0 μm ice
    – 3.4 μm hydrocarbon
    – 10/20 μm silicate features

    View Slide


  31. Many ice features

    3.0 μm H2
    0 the strongest

    Requires A(V) > 3
    Boogert, Gerakines, & Whittet

    View Slide

  32. 3.4 μm
    Hydrocarbon grains
    Pendelton & Allamandola (2002, ApJS, 138, 75)

    View Slide

  33. 10 & 20 μm
    Silicate
    Features
    Chiar & Tielens (2006, ApJ, 637, 774)

    View Slide

  34. Crystalline Silicate Fraction
    ~0.2% (or zero)
    Kemper, Viernd, & Tielens (2004, ApJ, 609, 826)
    Amorphous Crystalline

    View Slide

  35. NASA’s Infrared Telescope Facility
    0.8 to 20 μm

    View Slide

  36. Marjorie Decleir

    View Slide

  37. 3.0 μm ice feature measured in the diffuse average at
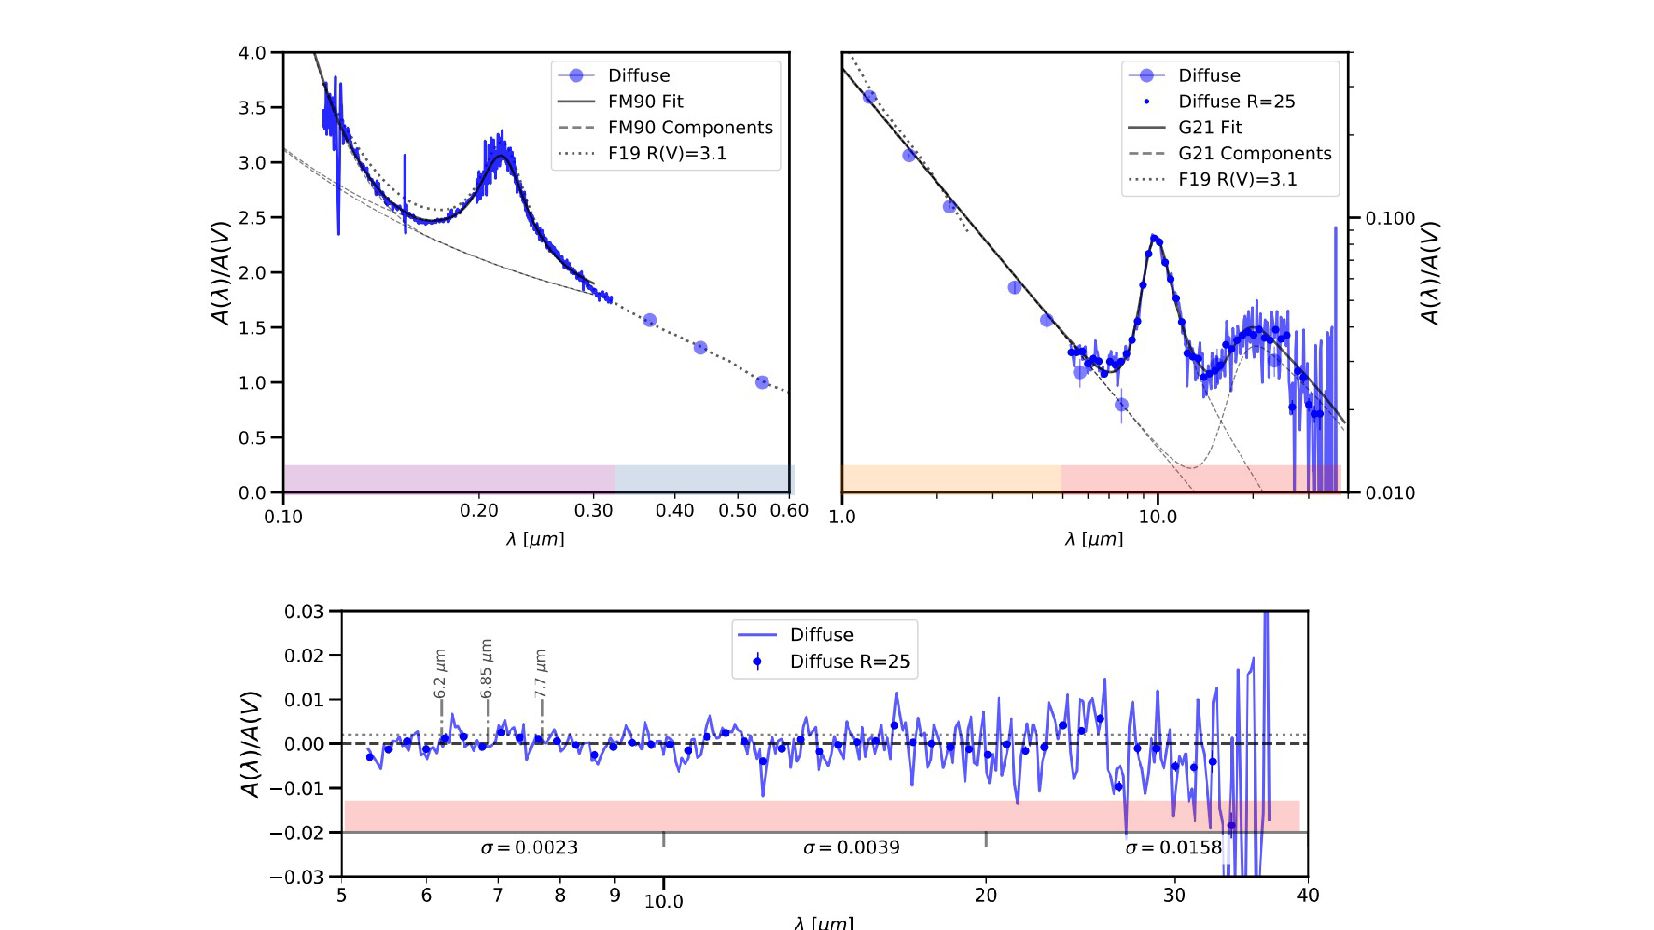
    A(ice)/A(V) = 0.0019 +/- 0.007
    Not a significant detection, but intriguing at the level predicted by
    Potapov et al. (2021) if ice is present in shadowed pits in silicate
    grains

    View Slide

  38. Spitzer Space
    Telescope
    3 to 160 μm

    View Slide

  39. View Slide

  40. View Slide

  41. Variations and 1st Direct Comparison of UV and MIR
    Strong variation
    Not correlated
    with grain size
    Silicates not correlated
    with 2175 A bump

    View Slide

  42. In preparation
    Based on spectroscopy
    at all wavelengths

    View Slide

  43. Average
    Variation with
    R(V)/grain size

    View Slide

  44. MW Extinction Summary
    ● Spectroscopic from FUV to MIR
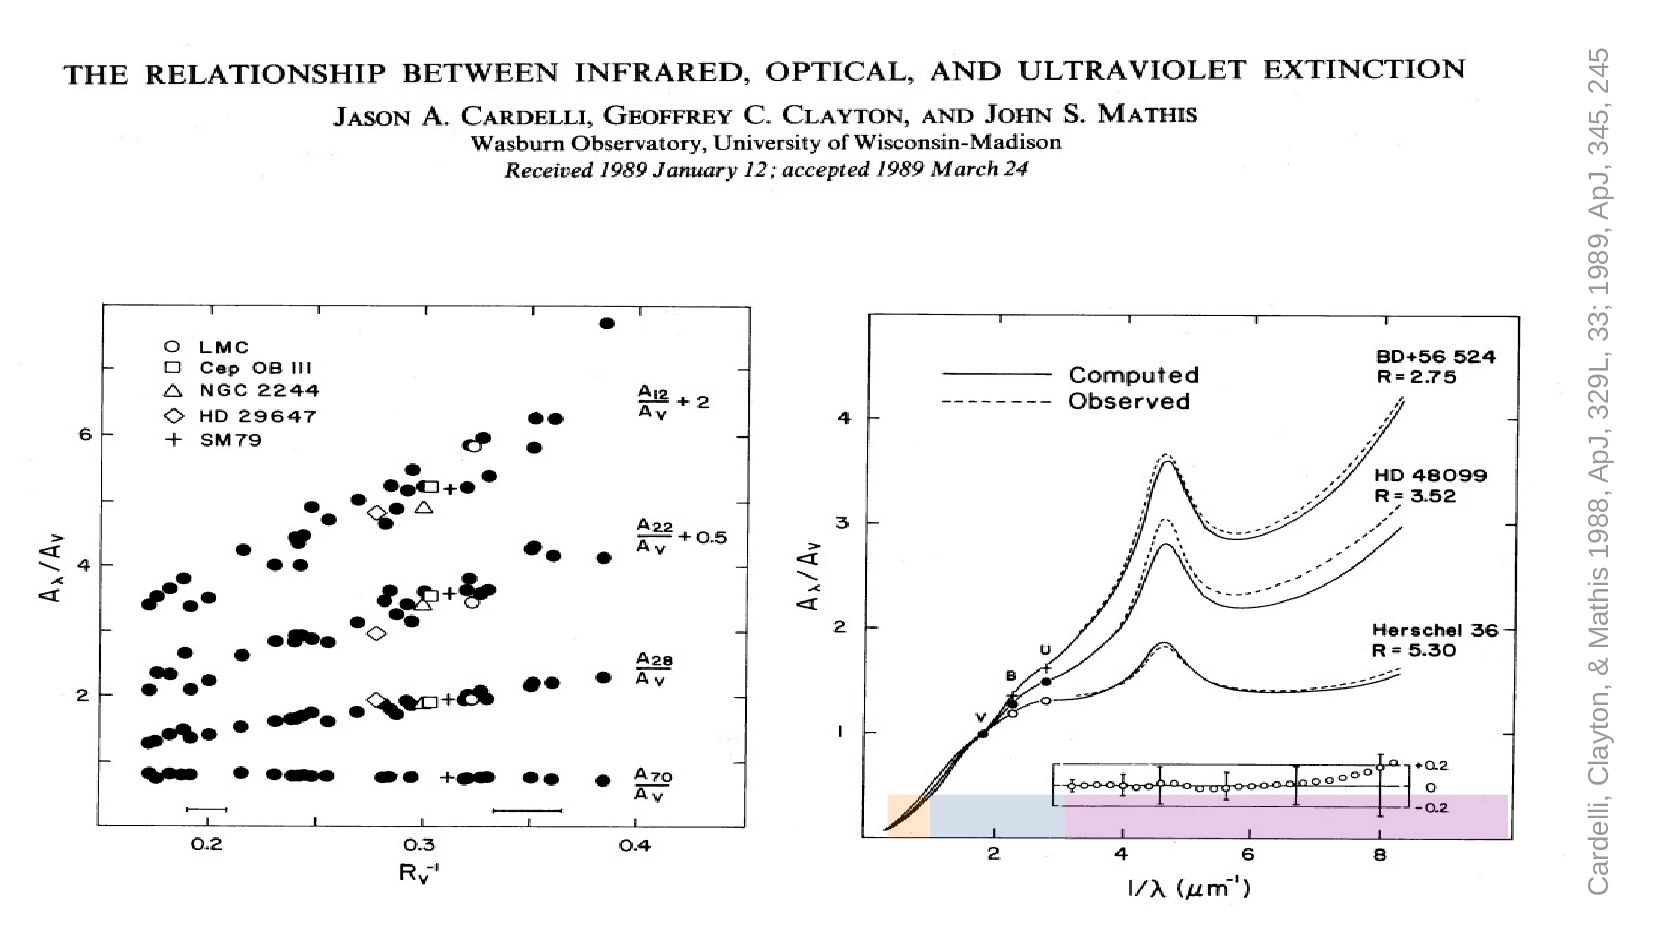
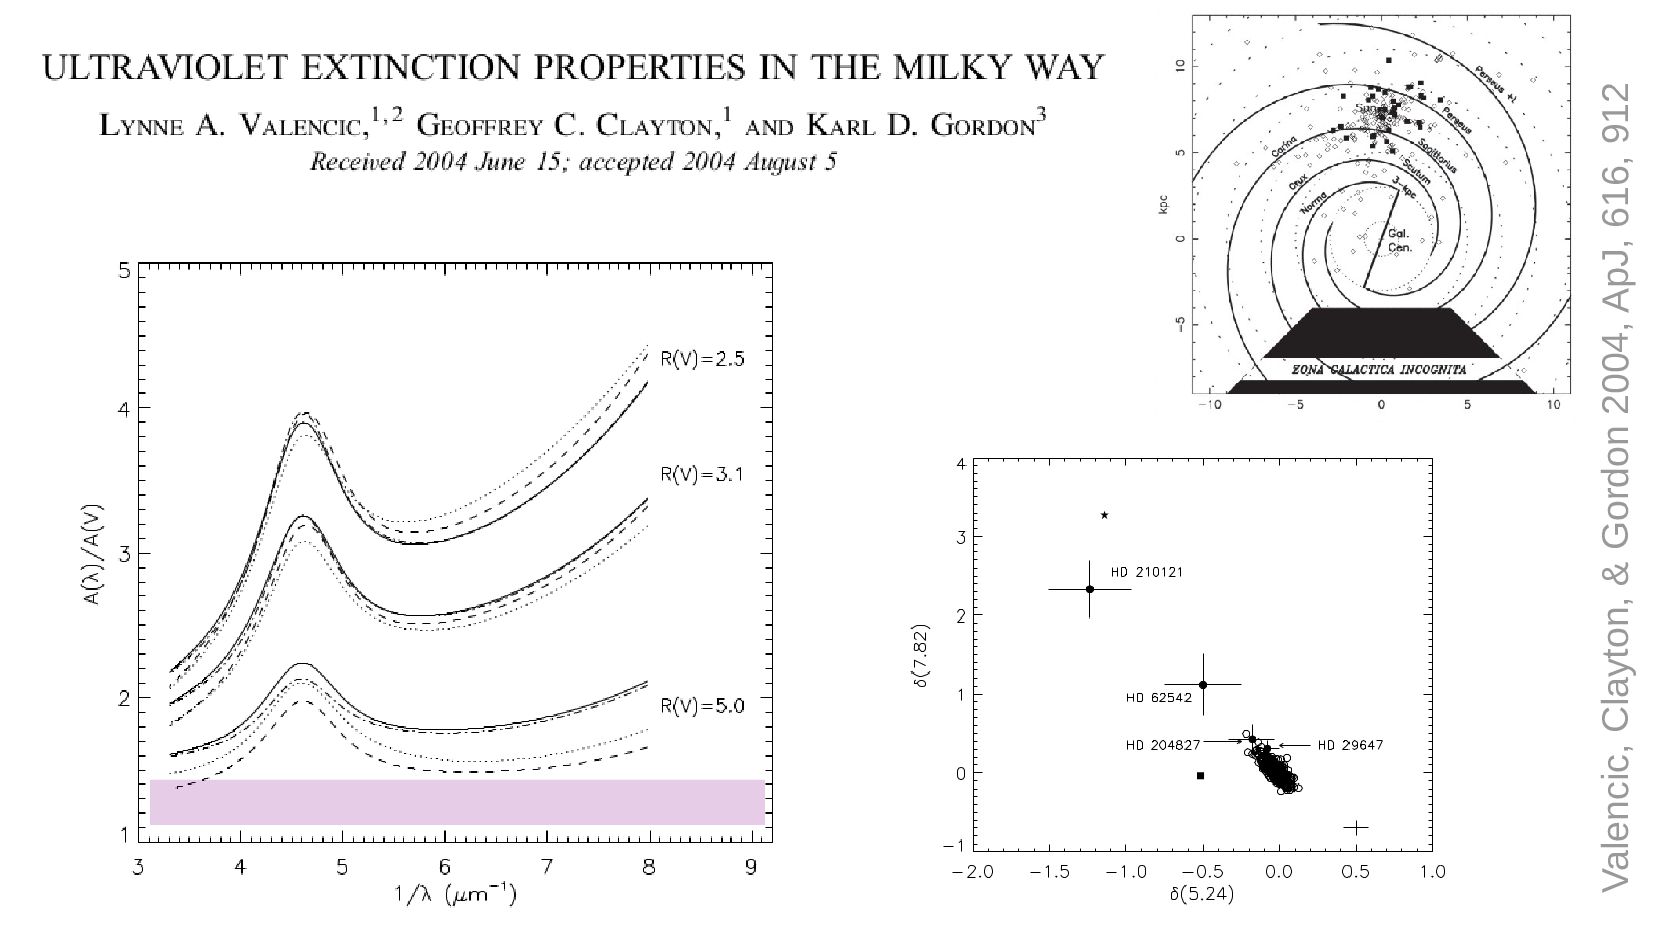
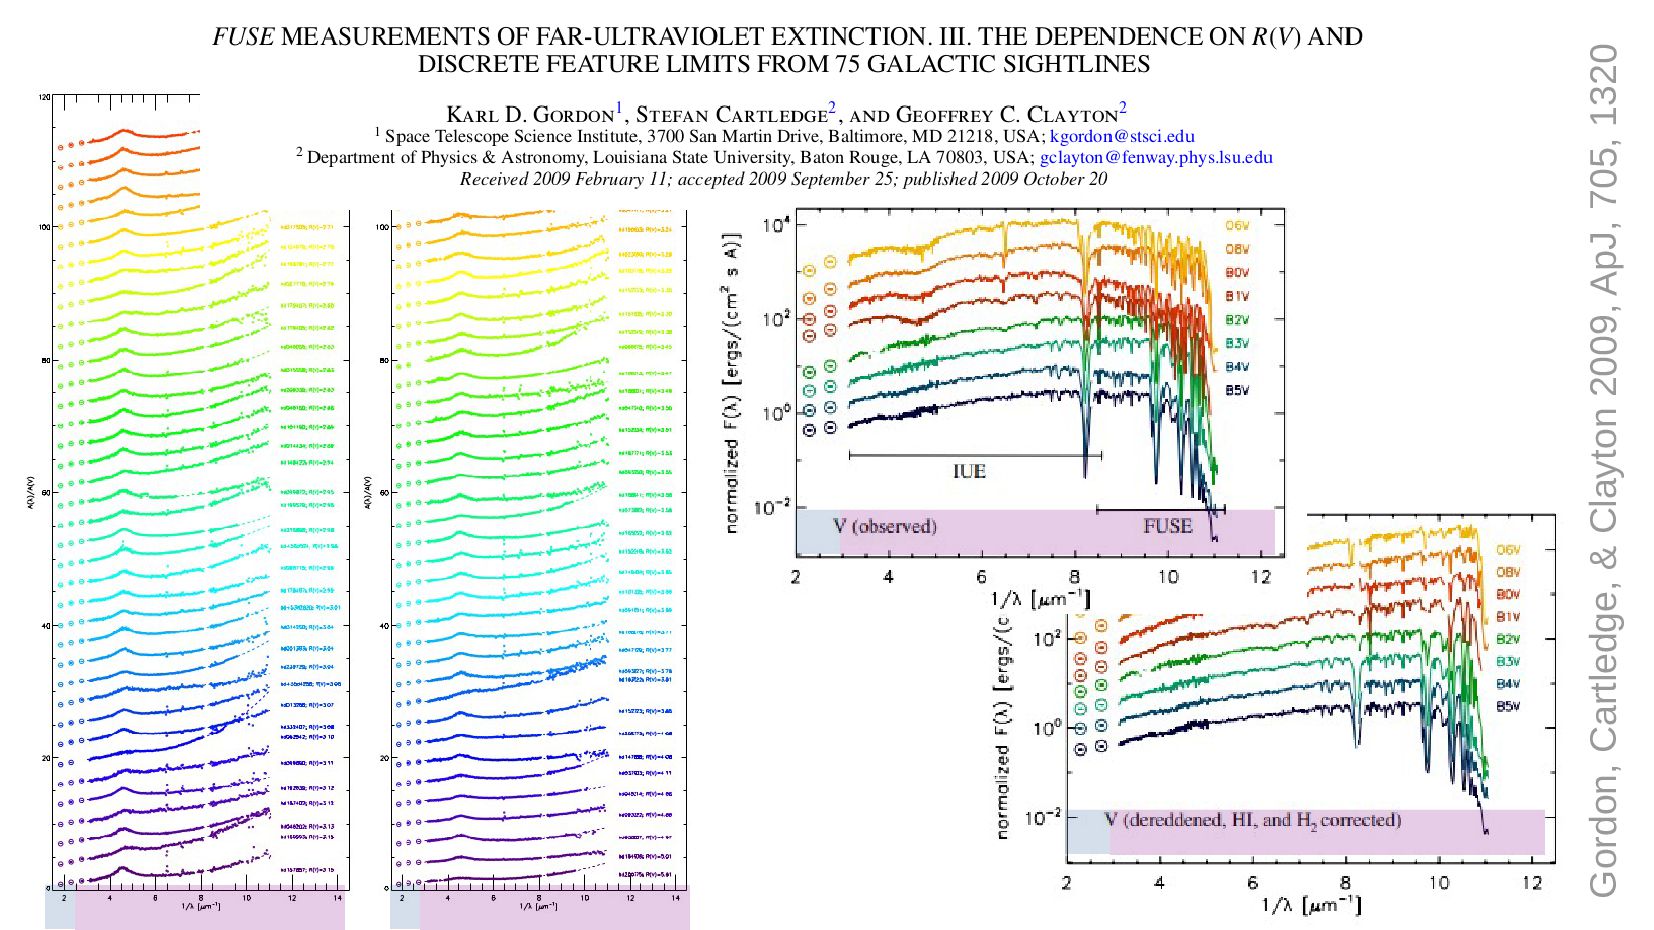
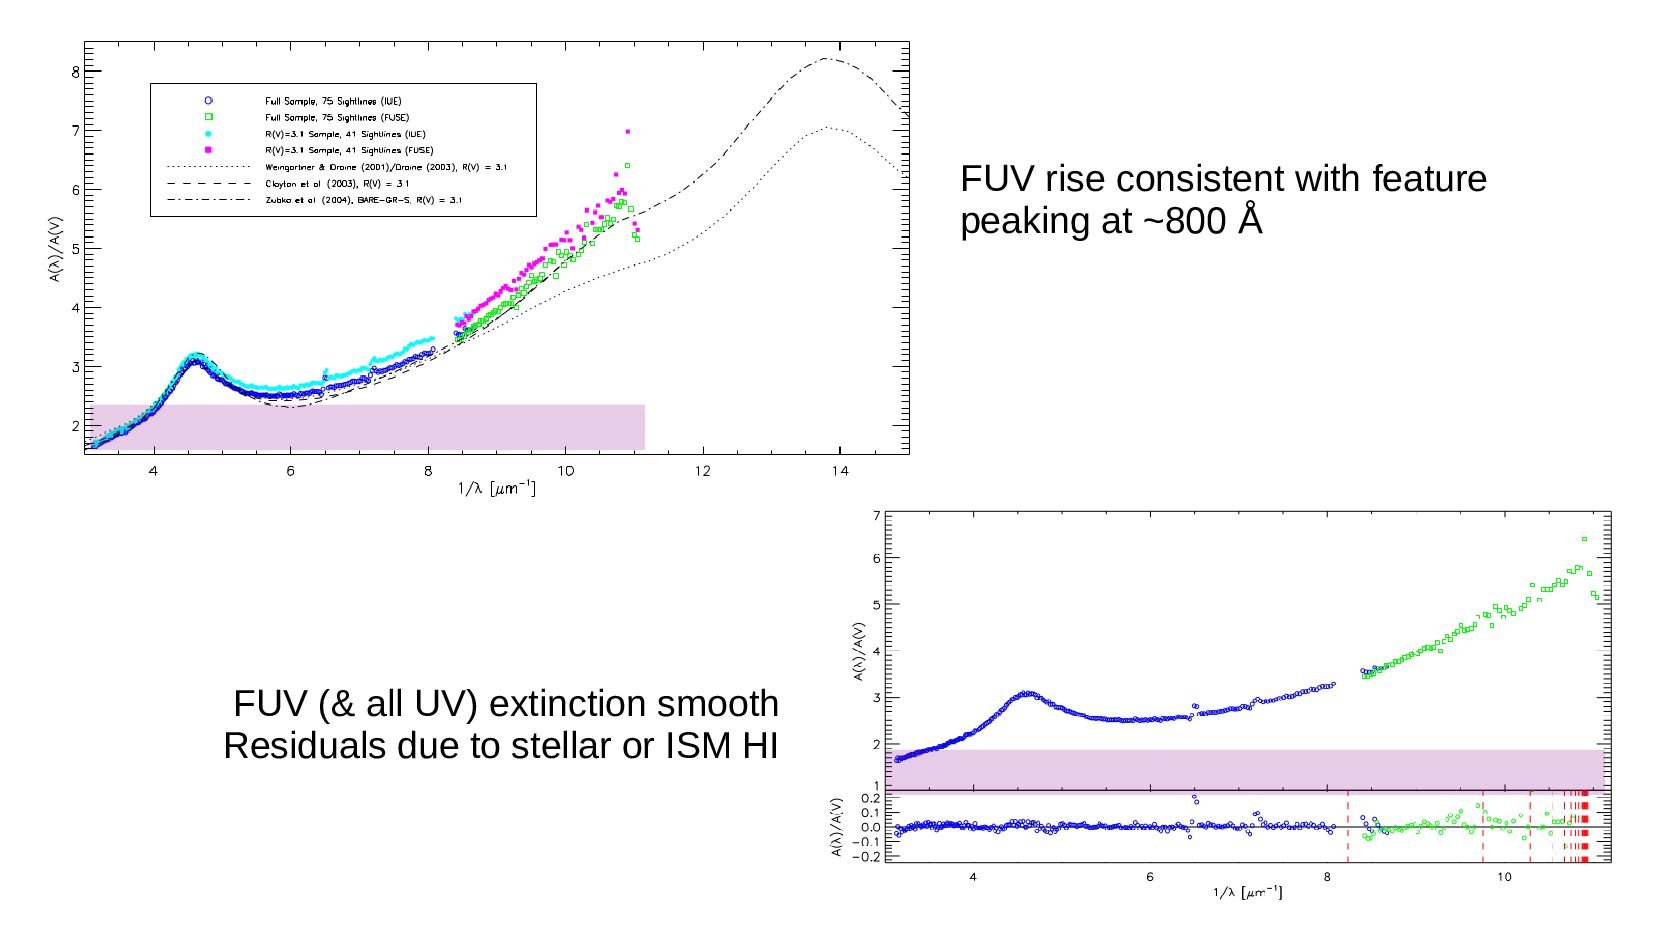
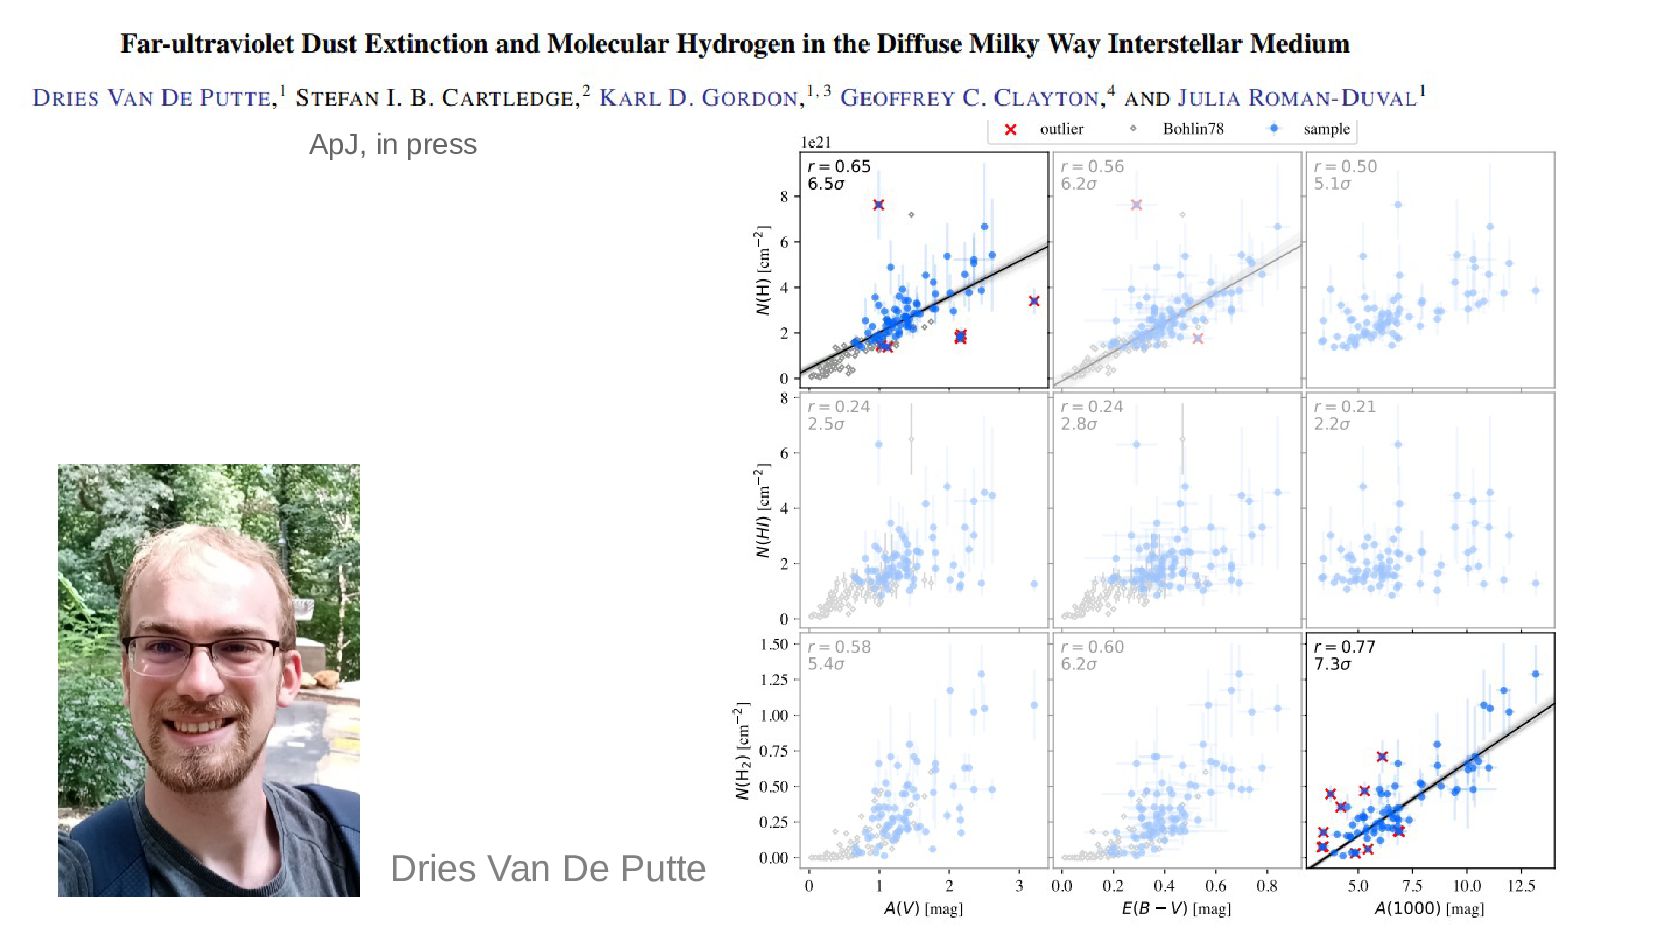
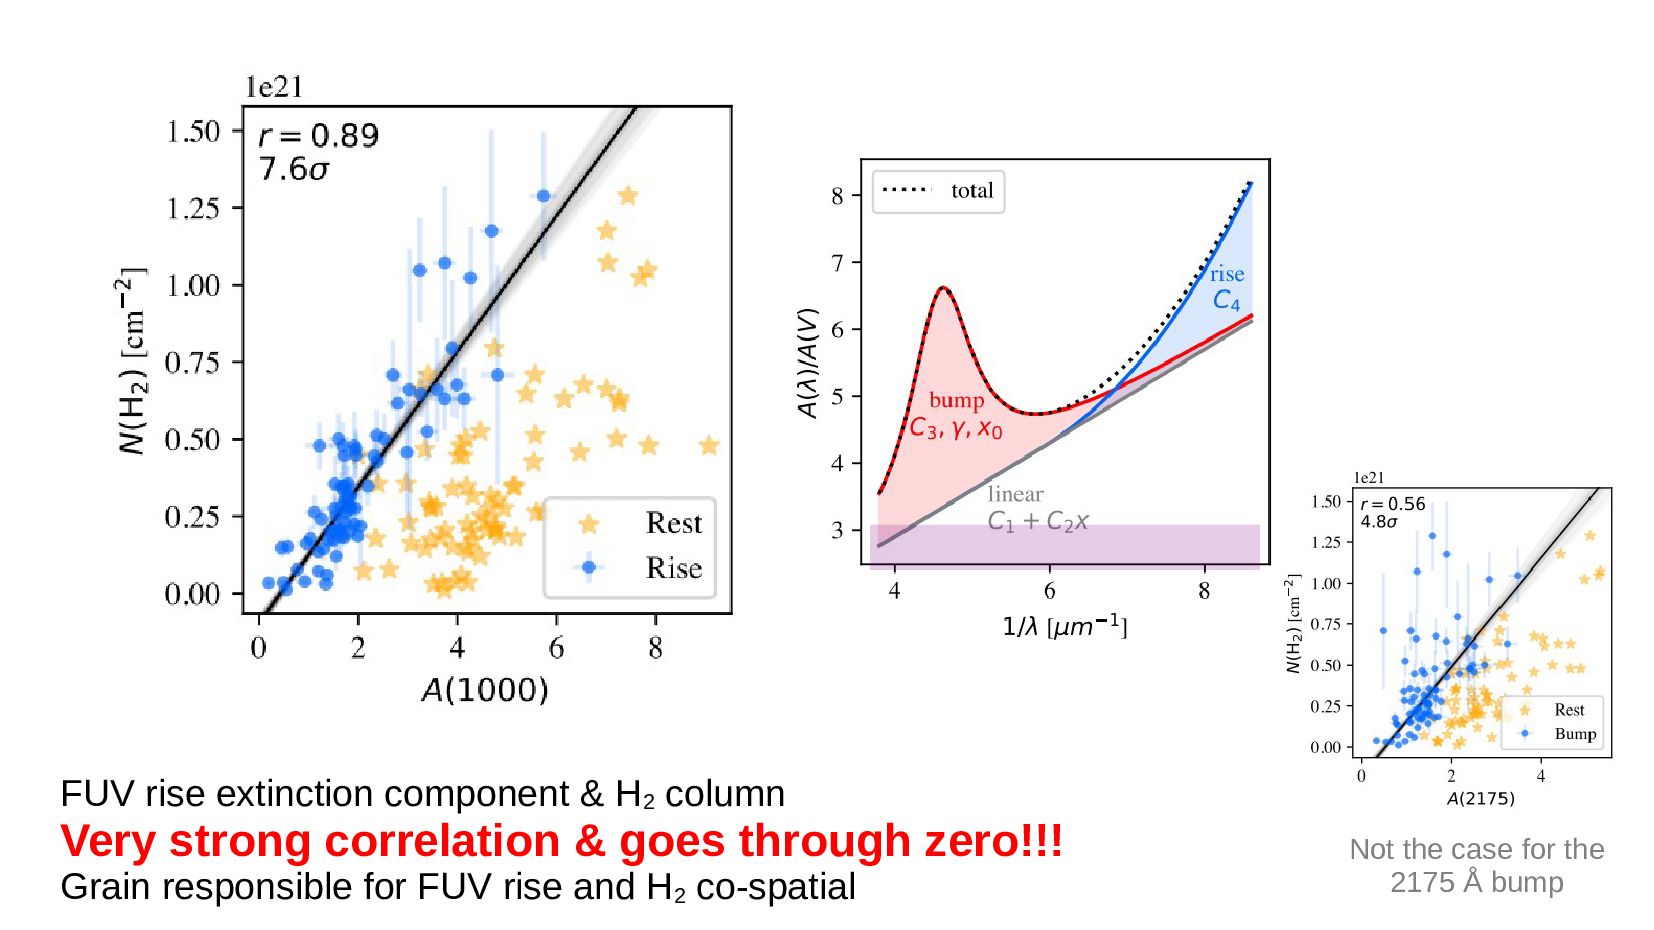
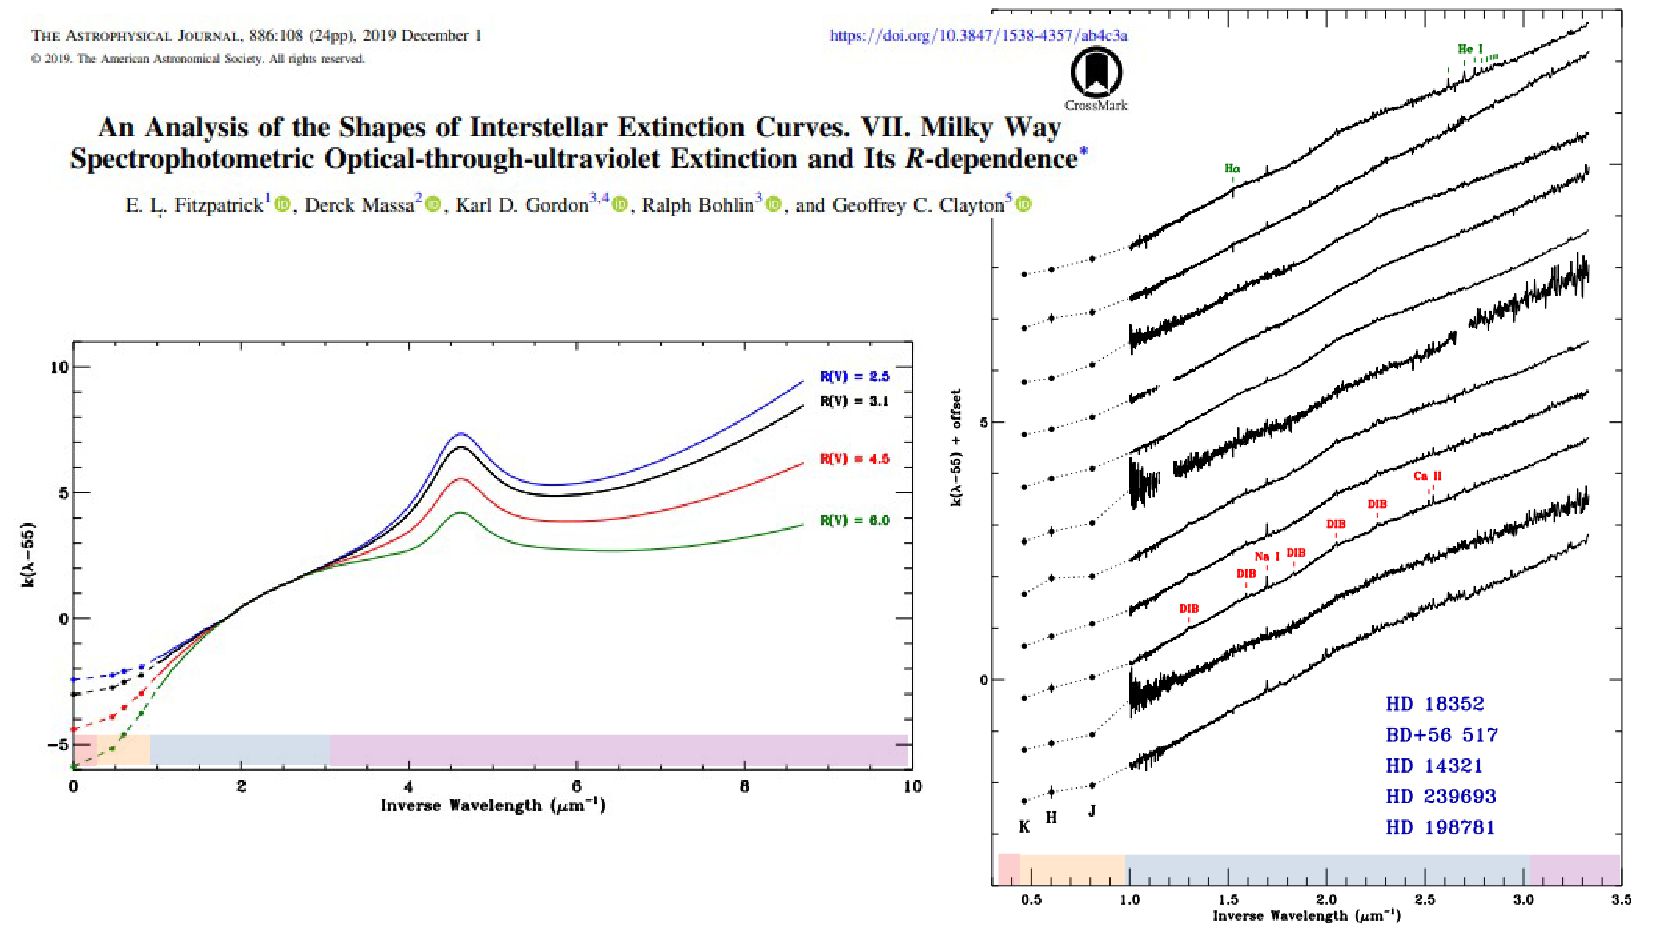
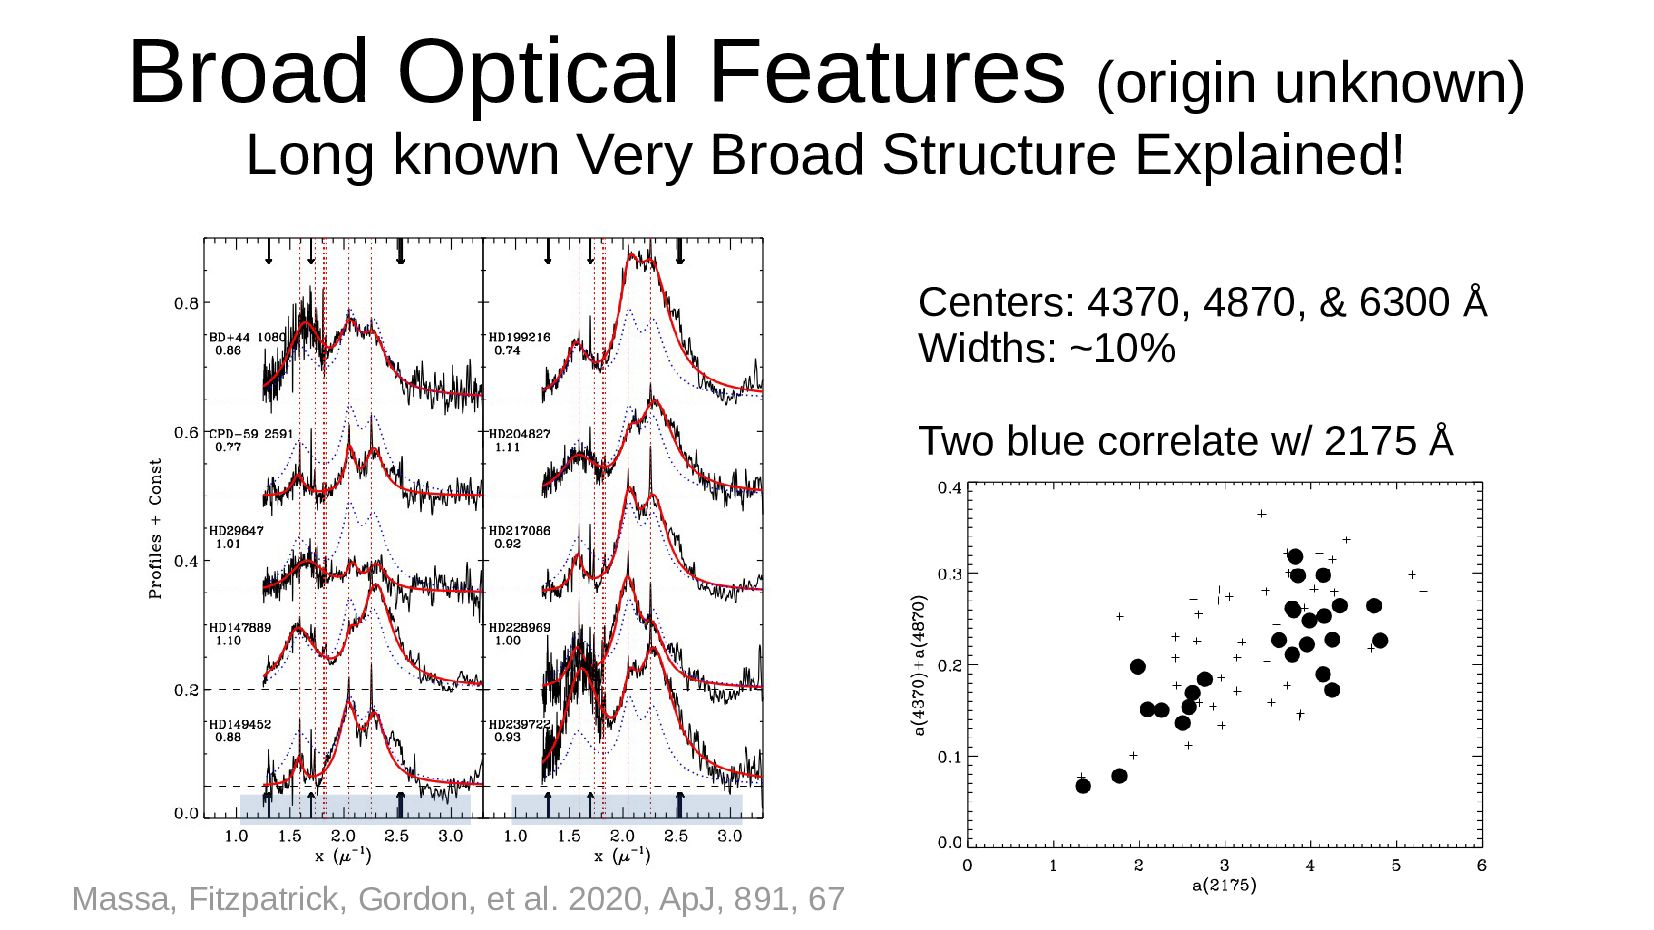
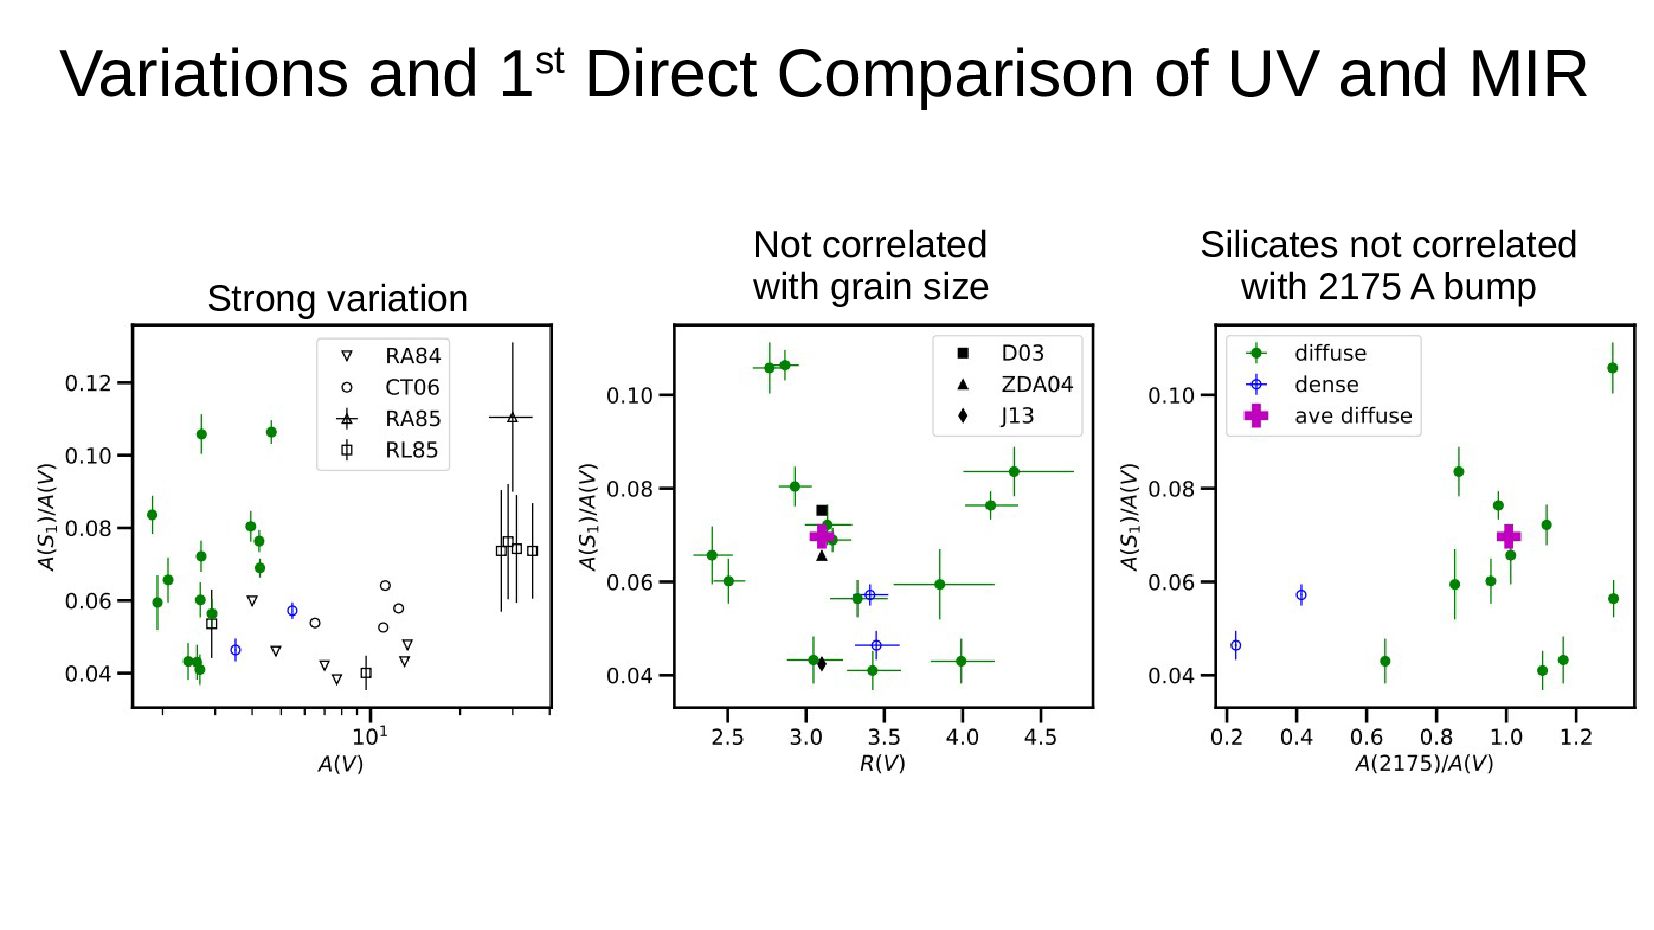
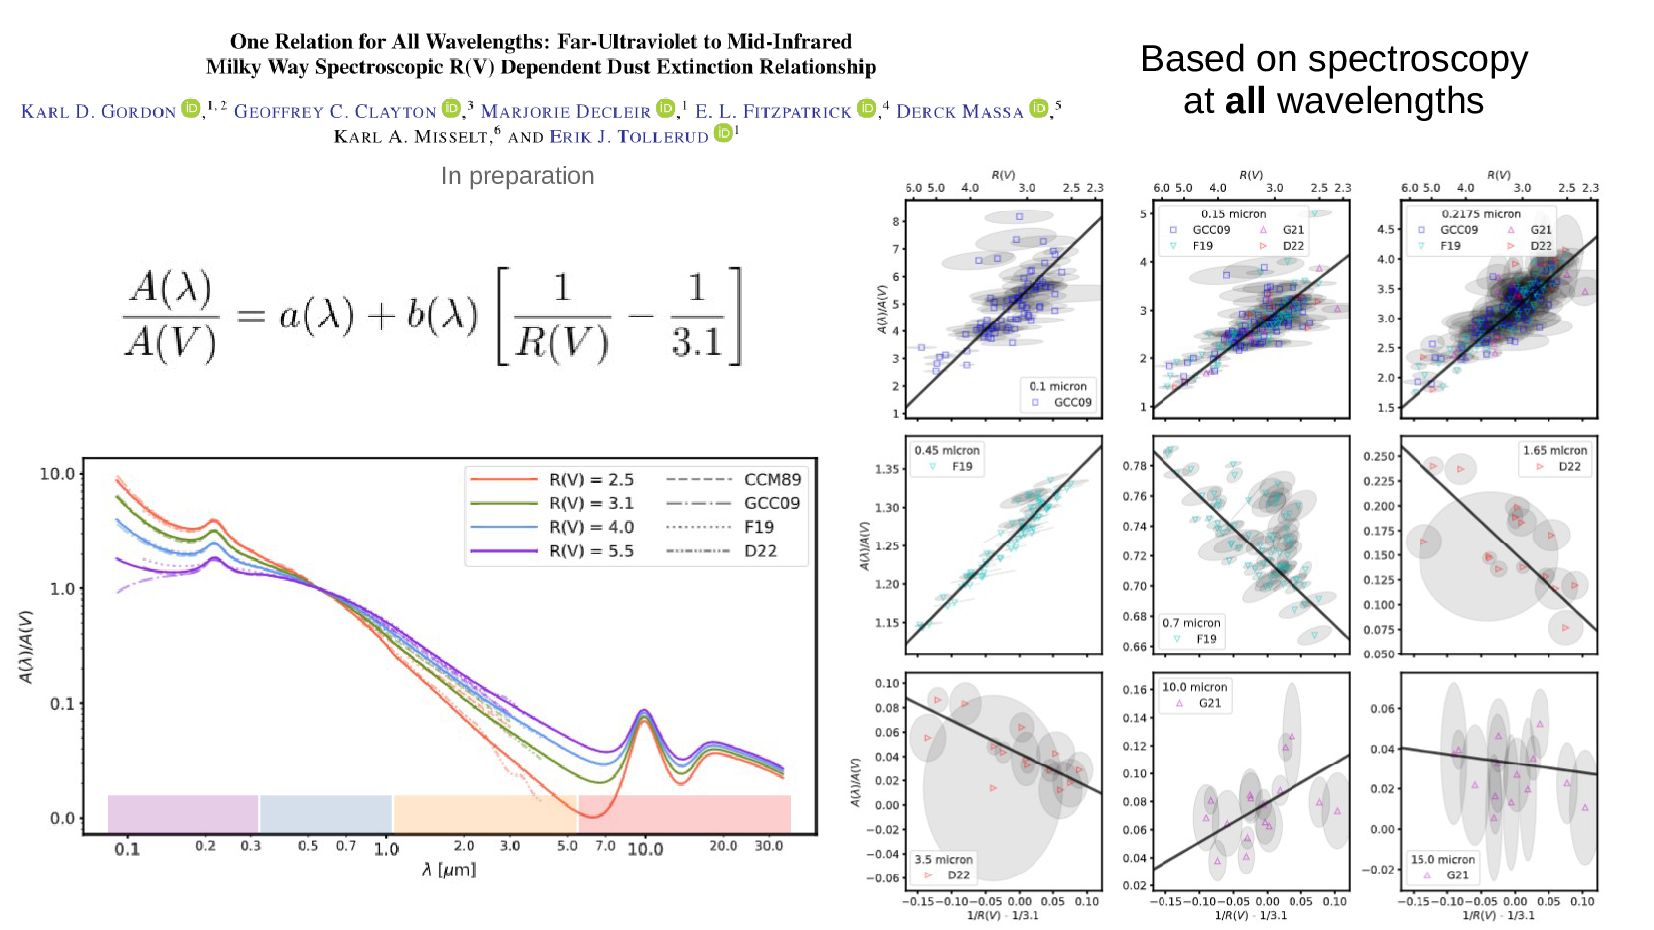
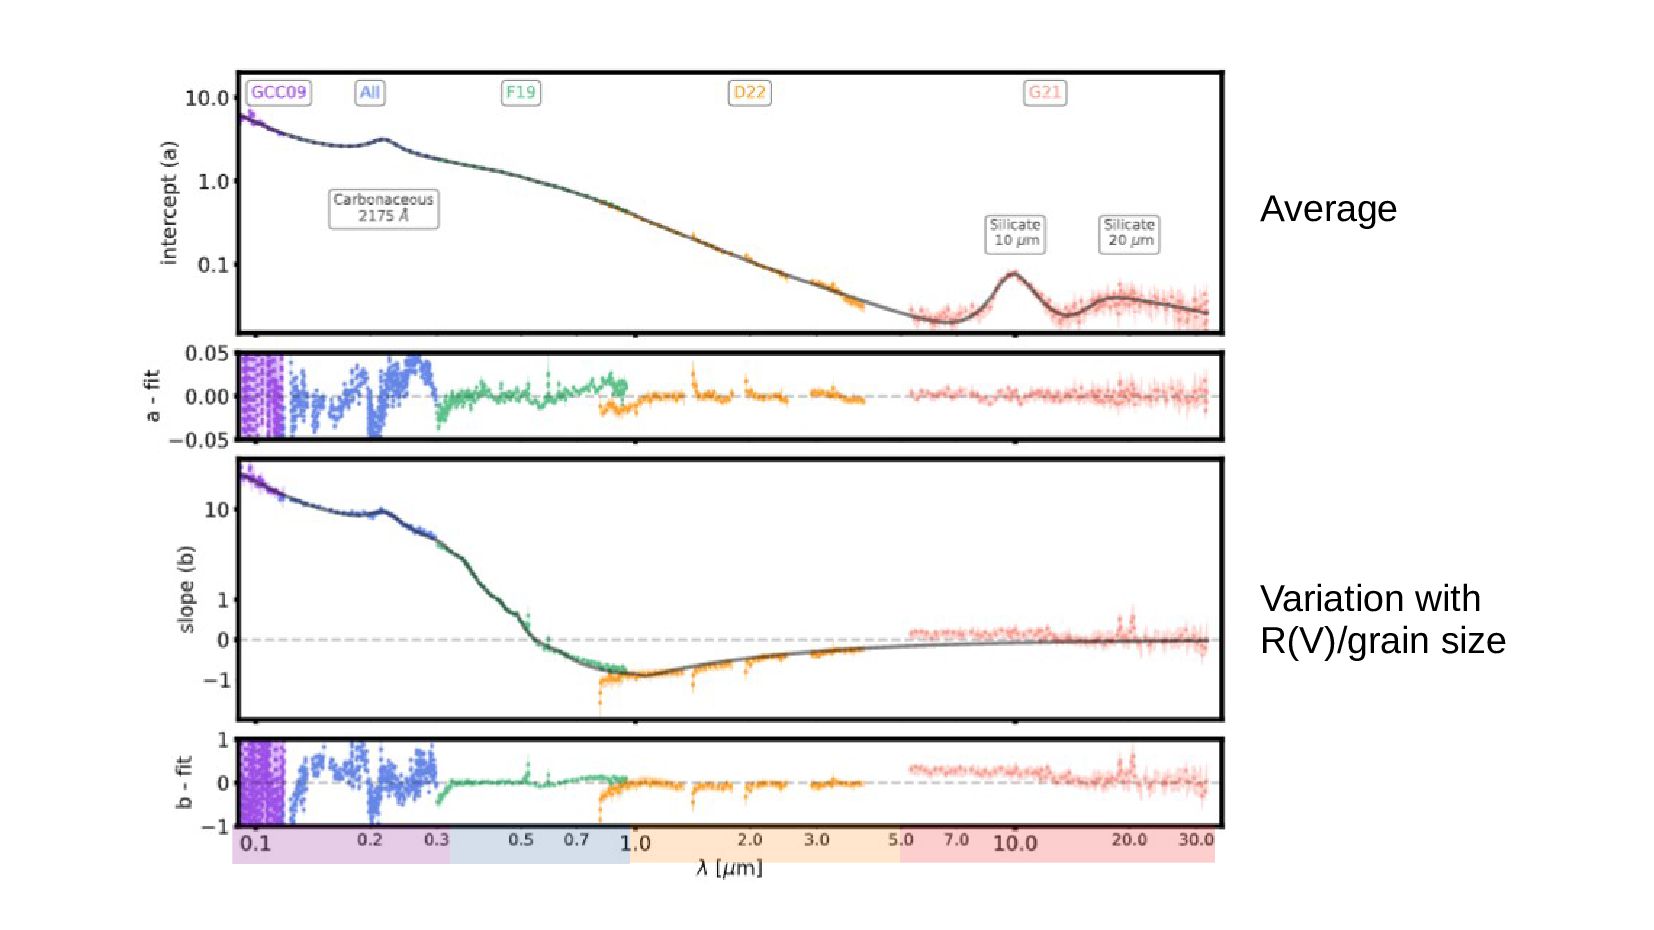
    – FUV smooth & consistent with feature peaking ~800 Å
    – H2
    correlates with FUV rise → co-spatial!
    – New optical features → unknown origin
    – NIR powerlaw & may contain H2
    0 ice
    – MIR versus UV features → 2175 Å not due to silicates
    – R(V) dependent extinction relationship → on
    relationship for all wavelengths

    View Slide

  45. Beyond Milky Way

    View Slide

  46. Clayton & Martin 1985, ApJ, 288, 558
    Add figure
    showing 30
    Dor/LMC2

    View Slide

  47. Misselt, Clayton, & Gordon 1999, ApJ, 515, 128

    View Slide

  48. Prevot et al. 1984, A&A, 132, 389

    View Slide

  49. SMC Extinction Curves
    Milky Way-like!
    (2175 Å bump)
    4 similar 
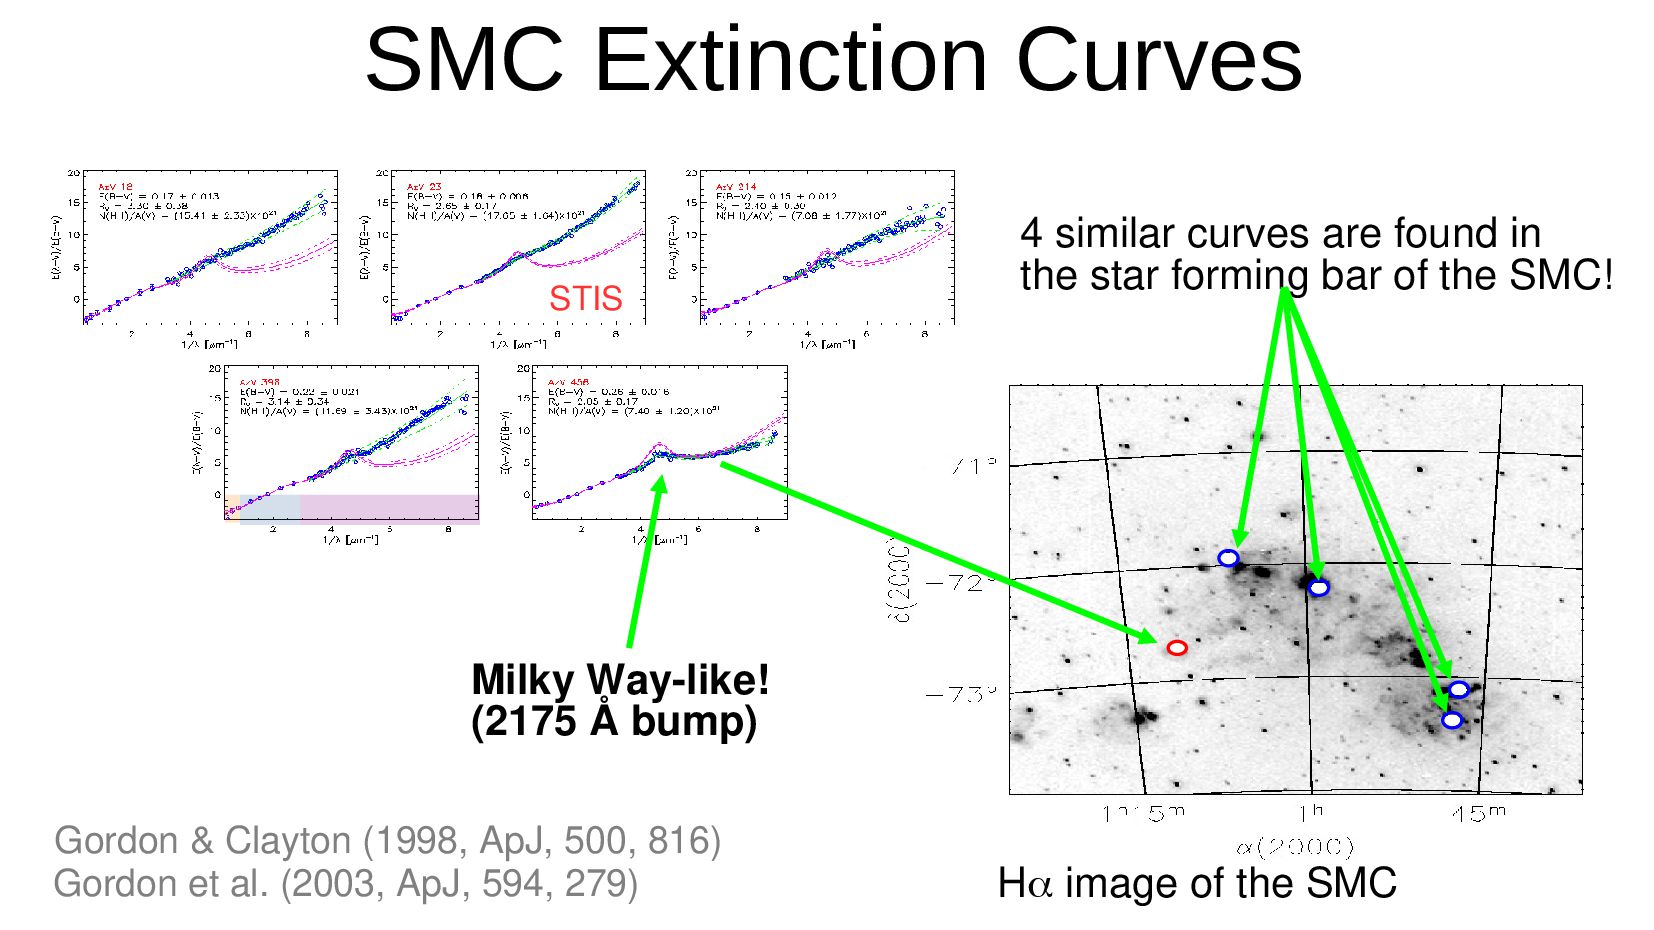
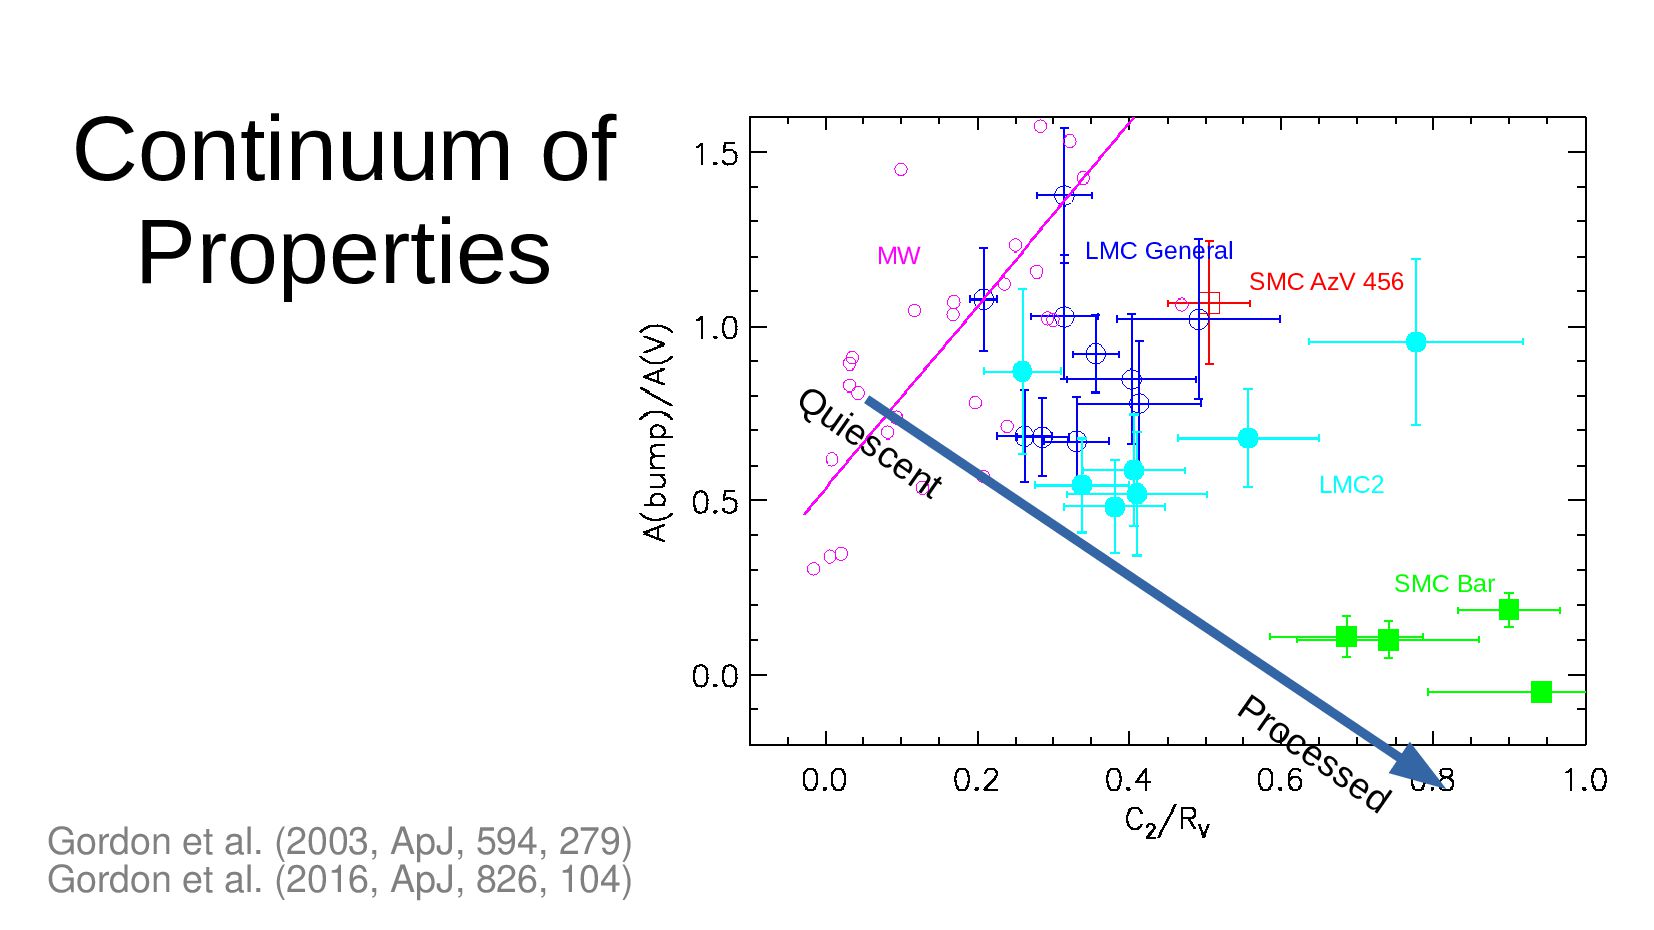
curves are found in
    the star forming bar of the SMC!
    Ha image of the SMC
    Gordon & Clayton (1998, ApJ, 500, 816)
    Gordon et al. (2003, ApJ, 594, 279)
    STIS
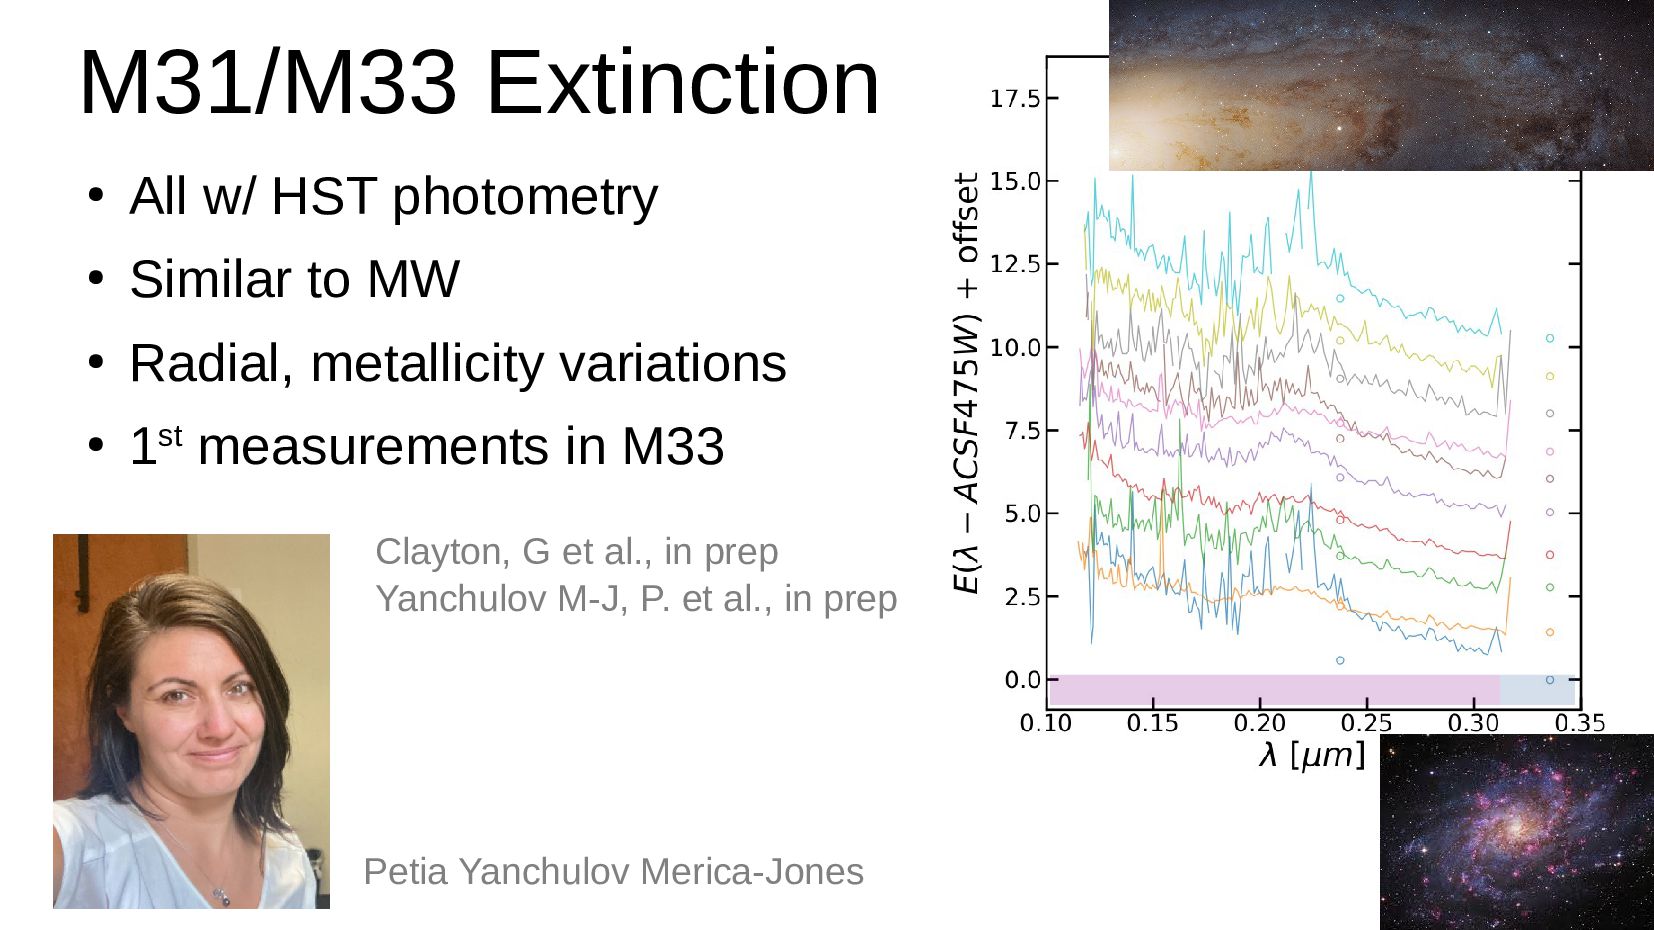
    View Slide

  50. SMC AzV 456
    SMC Bar
    LMC2
    LMC General
    MW
    Quiescent
    Processed
    Continuum of
    Properties
    Gordon et al. (2003, ApJ, 594, 279)
    Gordon et al. (2016, ApJ, 826, 104)

    View Slide

  51. In preparation

    View Slide

  52. Clayton et al. 2015, ApJ, 815, 14

    View Slide

  53. M31/M33 Extinction

    All w/ HST photometry

    Similar to MW

    Radial, metallicity variations

    1st measurements in M33
    Petia Yanchulov Merica-Jones
    Clayton, G et al., in prep
    Yanchulov M-J, P. et al., in prep

    View Slide

  54. Beyond the MW Summary

    Large Magellanic Cloud (½ solar)
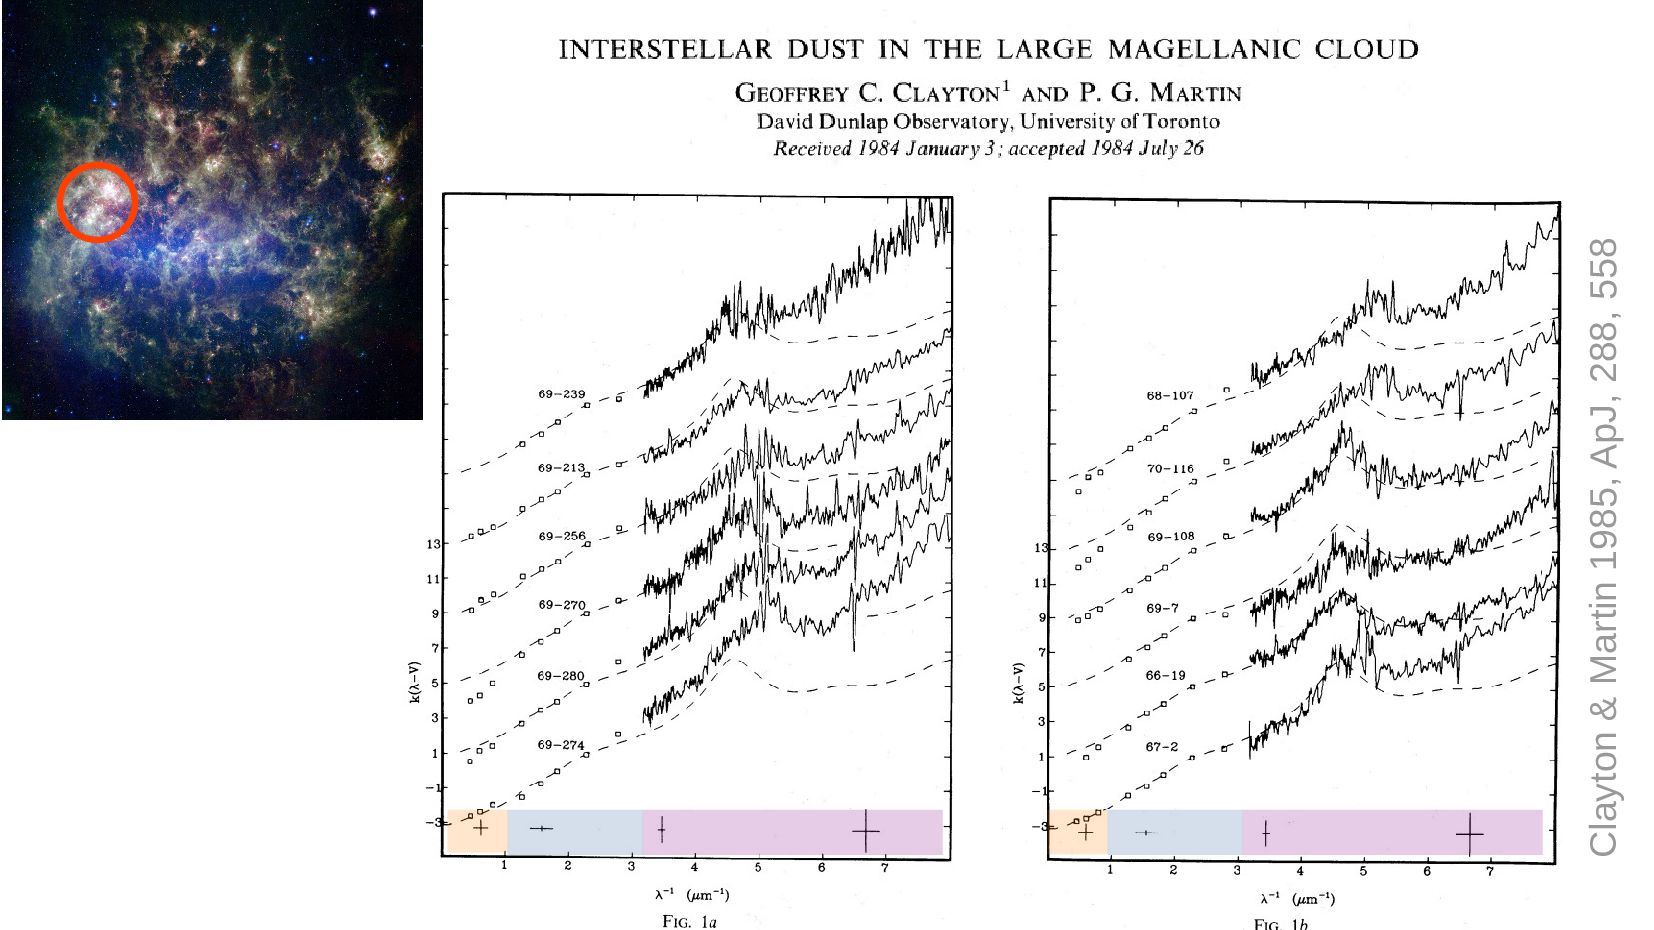
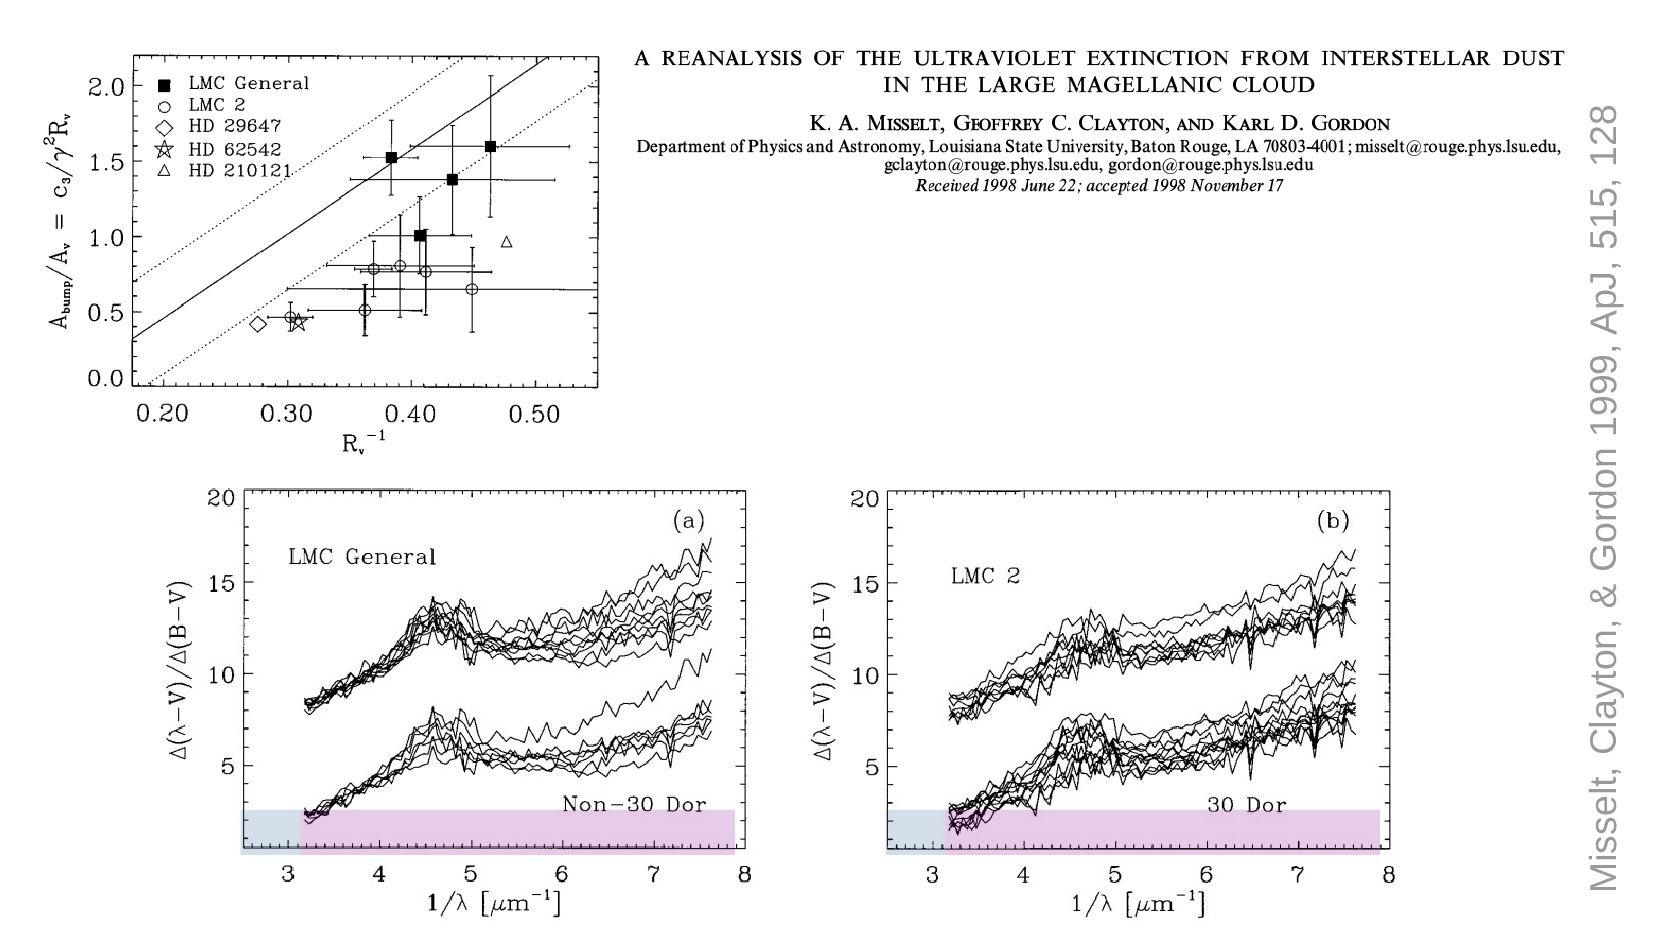
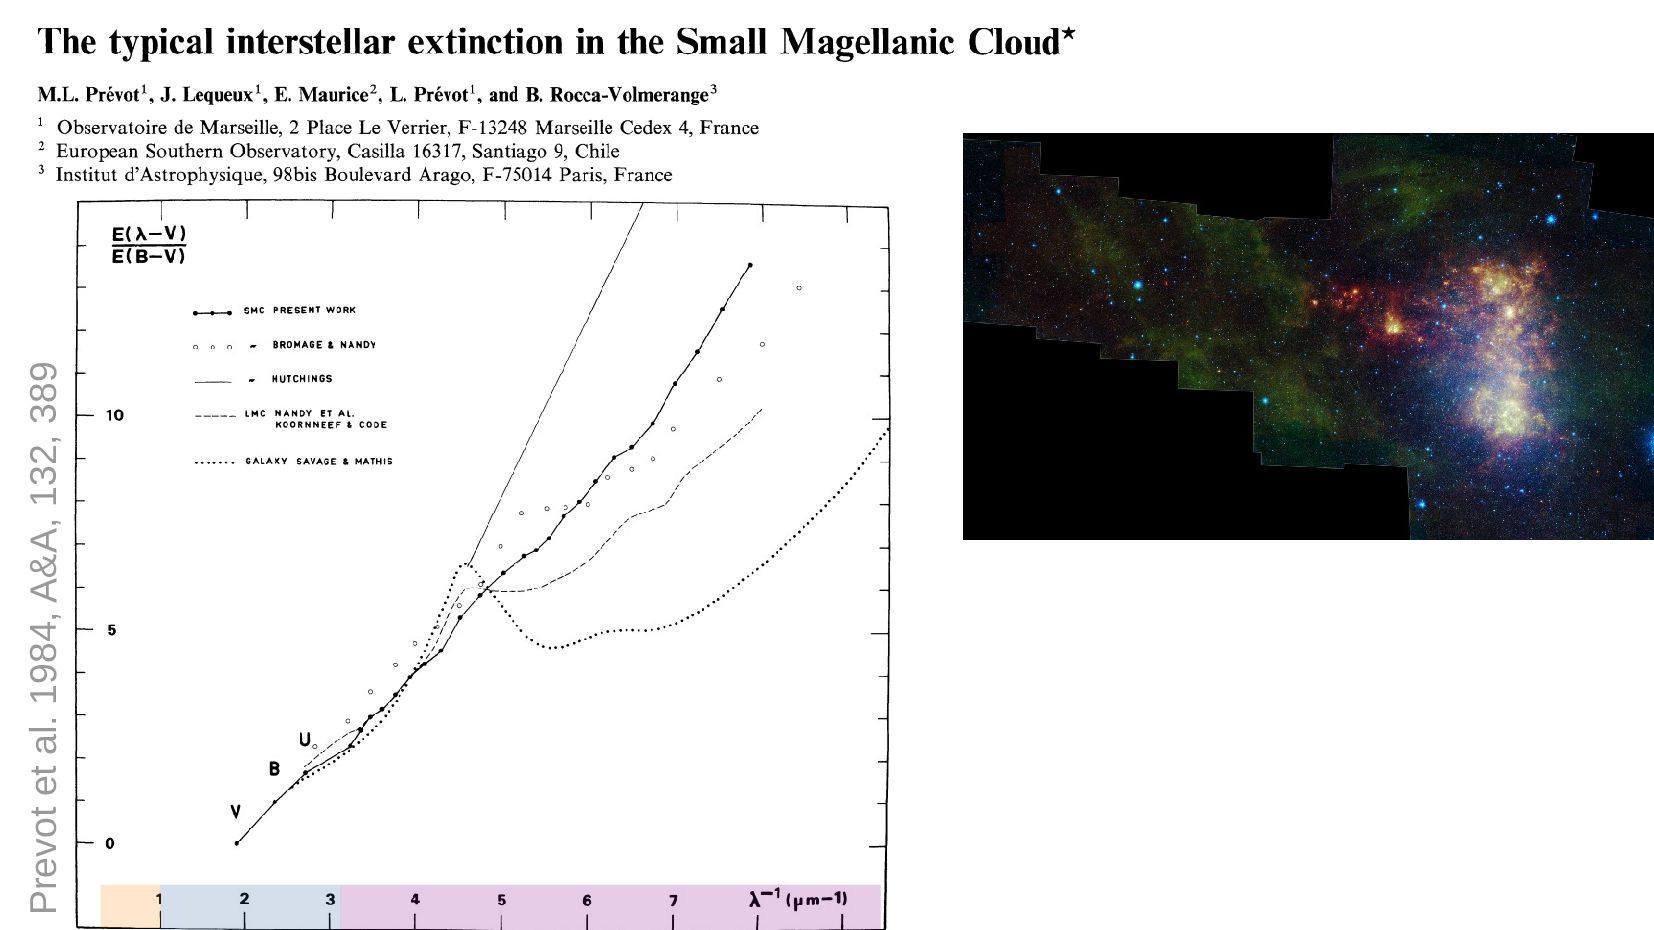
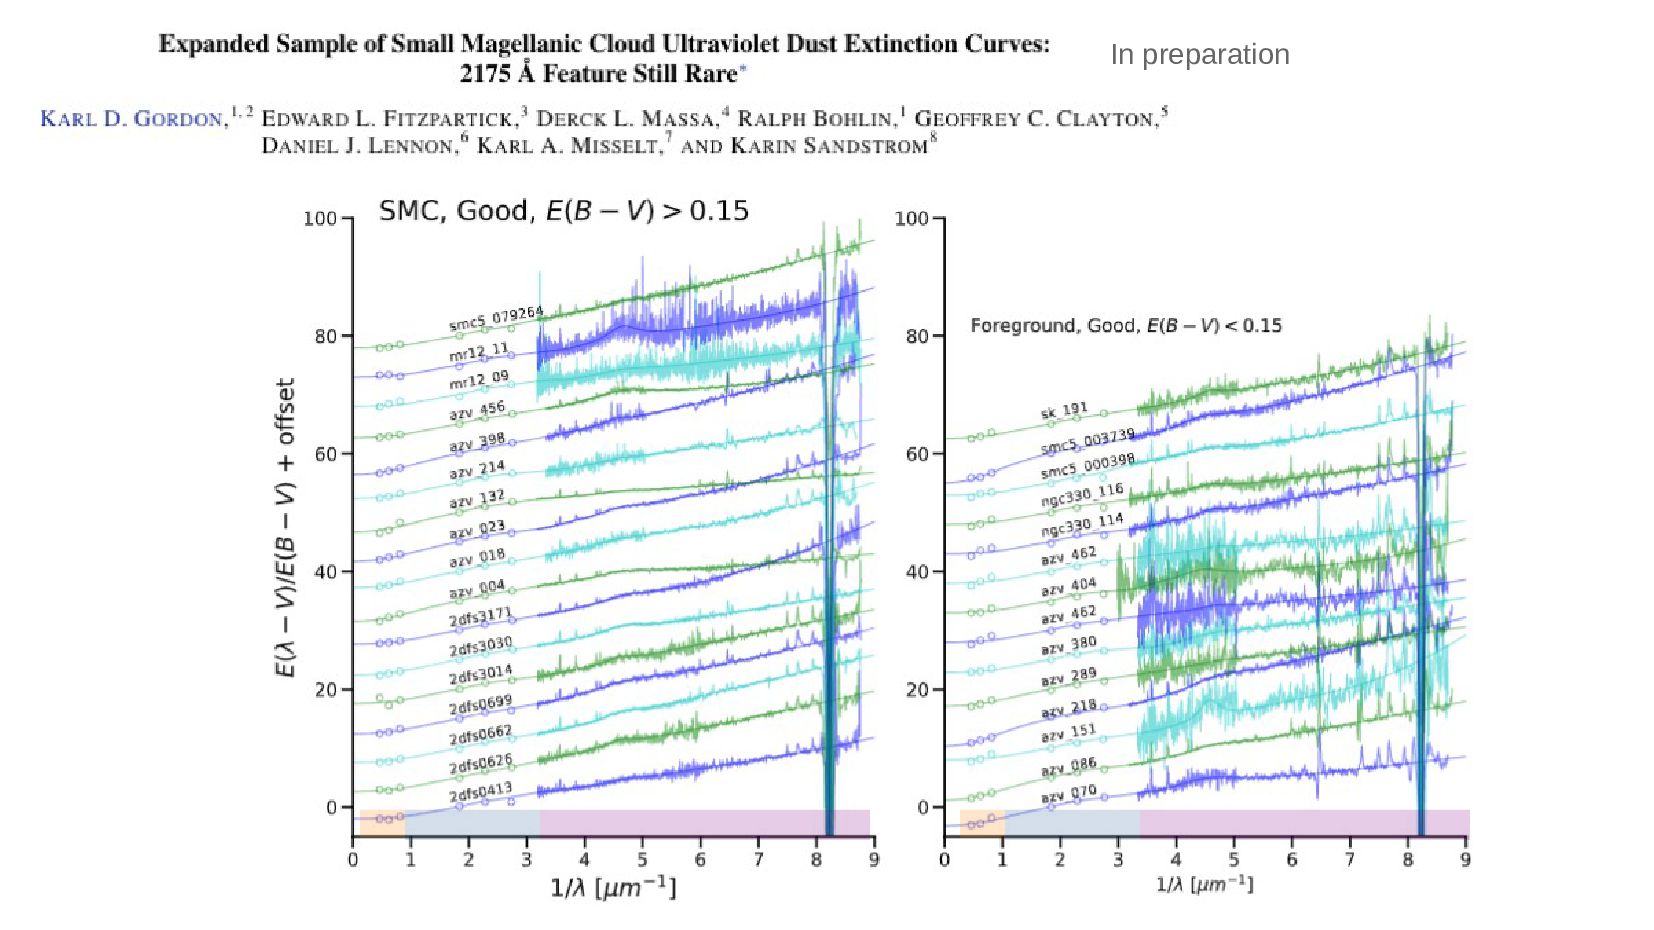
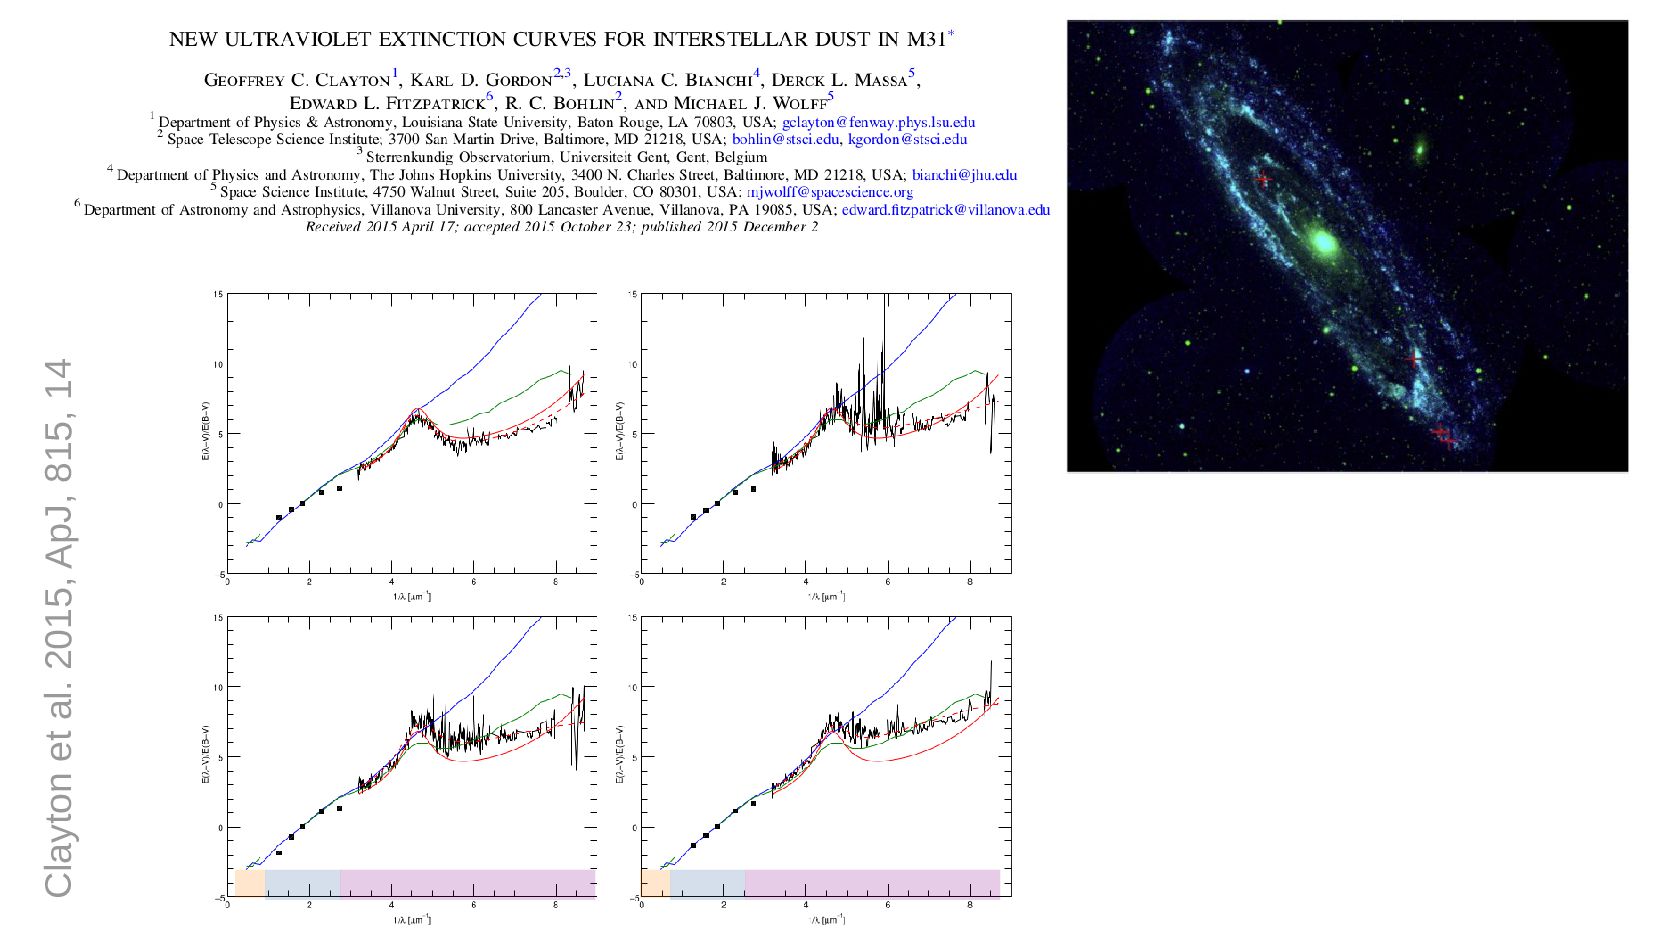
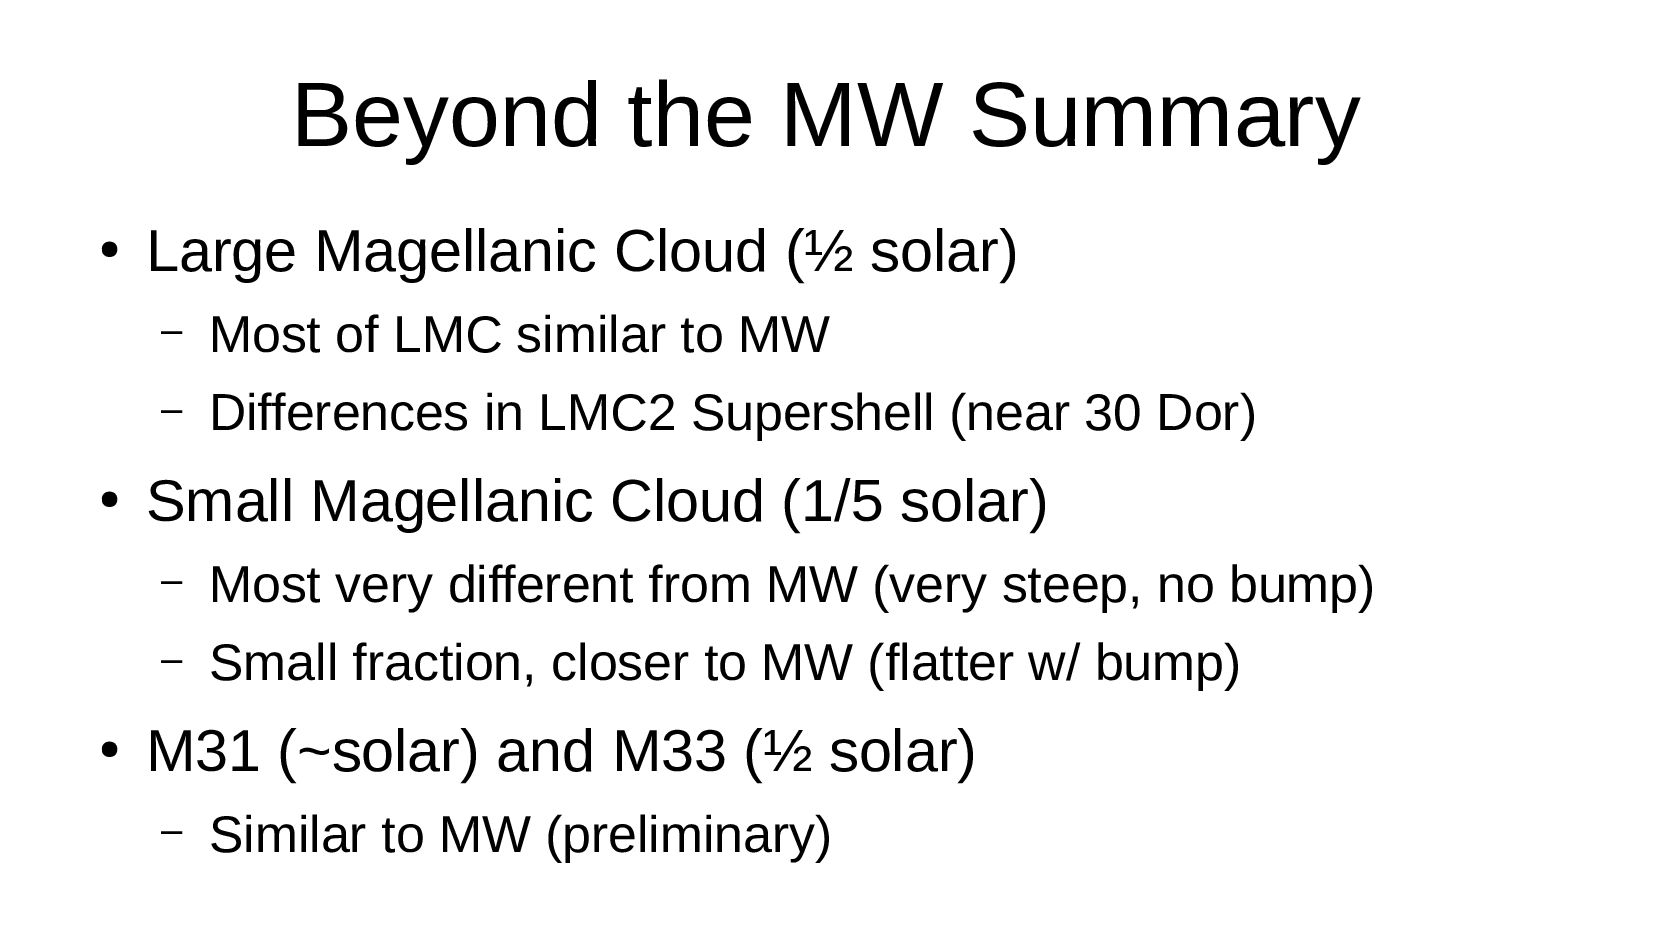
    – Most of LMC similar to MW
    – Differences in LMC2 Supershell (near 30 Dor)

    Small Magellanic Cloud (1/5 solar)
    – Most very different from MW (very steep, no bump)
    – Small fraction, closer to MW (flatter w/ bump)

    M31 (~solar) and M33 (½ solar)
    – Similar to MW (preliminary)

    View Slide

  55. Future

    View Slide

  56. HST

    More galaxies
    – Investigate low metallicity galaxies

    SMC unique?
    – Expand samples in large galaxies

    Milky Way R(V) dependent extinction relationship works?

    High/low R(V)
    – Probe extremes of dust size, curvature in R(V) relationship?

    View Slide

  57. JWST

    Two cycle 1 programs (PIs: Decleir & Zeegers)
    – 21 Milky Way sightlines from 2.4-28 μm
    – Continuum and 3.4, 10, & 20 μm features

    Map features photometrically

    LMC/SMC continuum & silicate measurements

    Other galaxies (sensitivity?)

    View Slide

  58. Photometric Feature Measurements
    10 μm silicate
    3 μm ice
    3.4 μm
    hydrocarbon
    Burcu Günay

    View Slide

  59. Summary

    Extinction measurements are fundamental to understanding dust

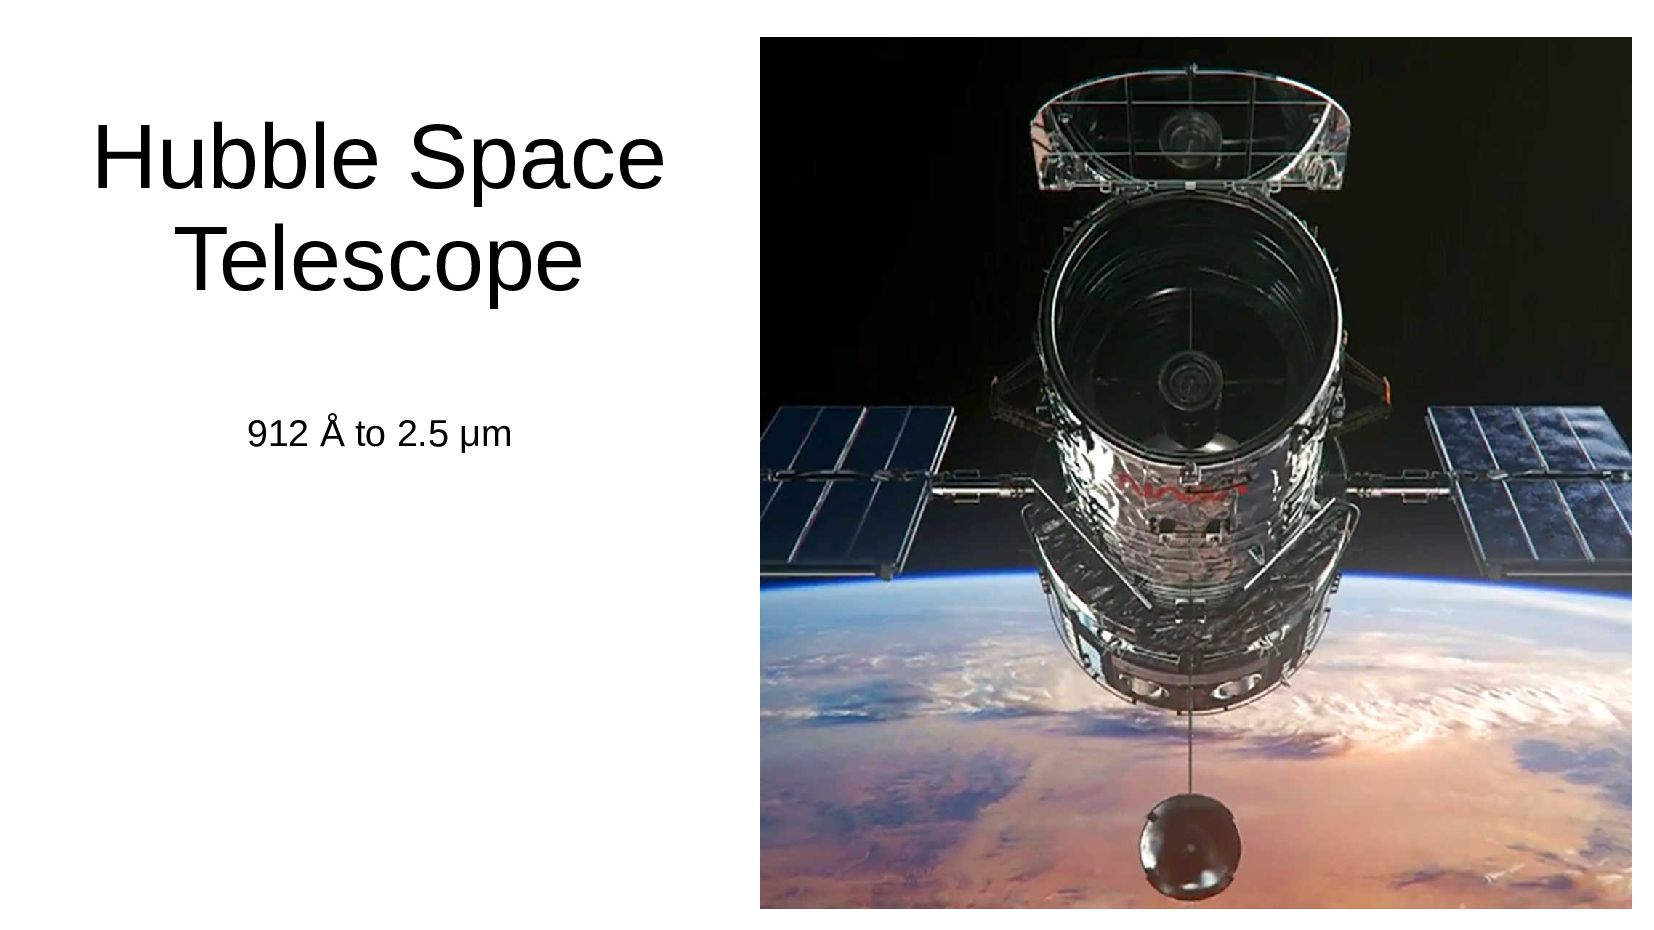
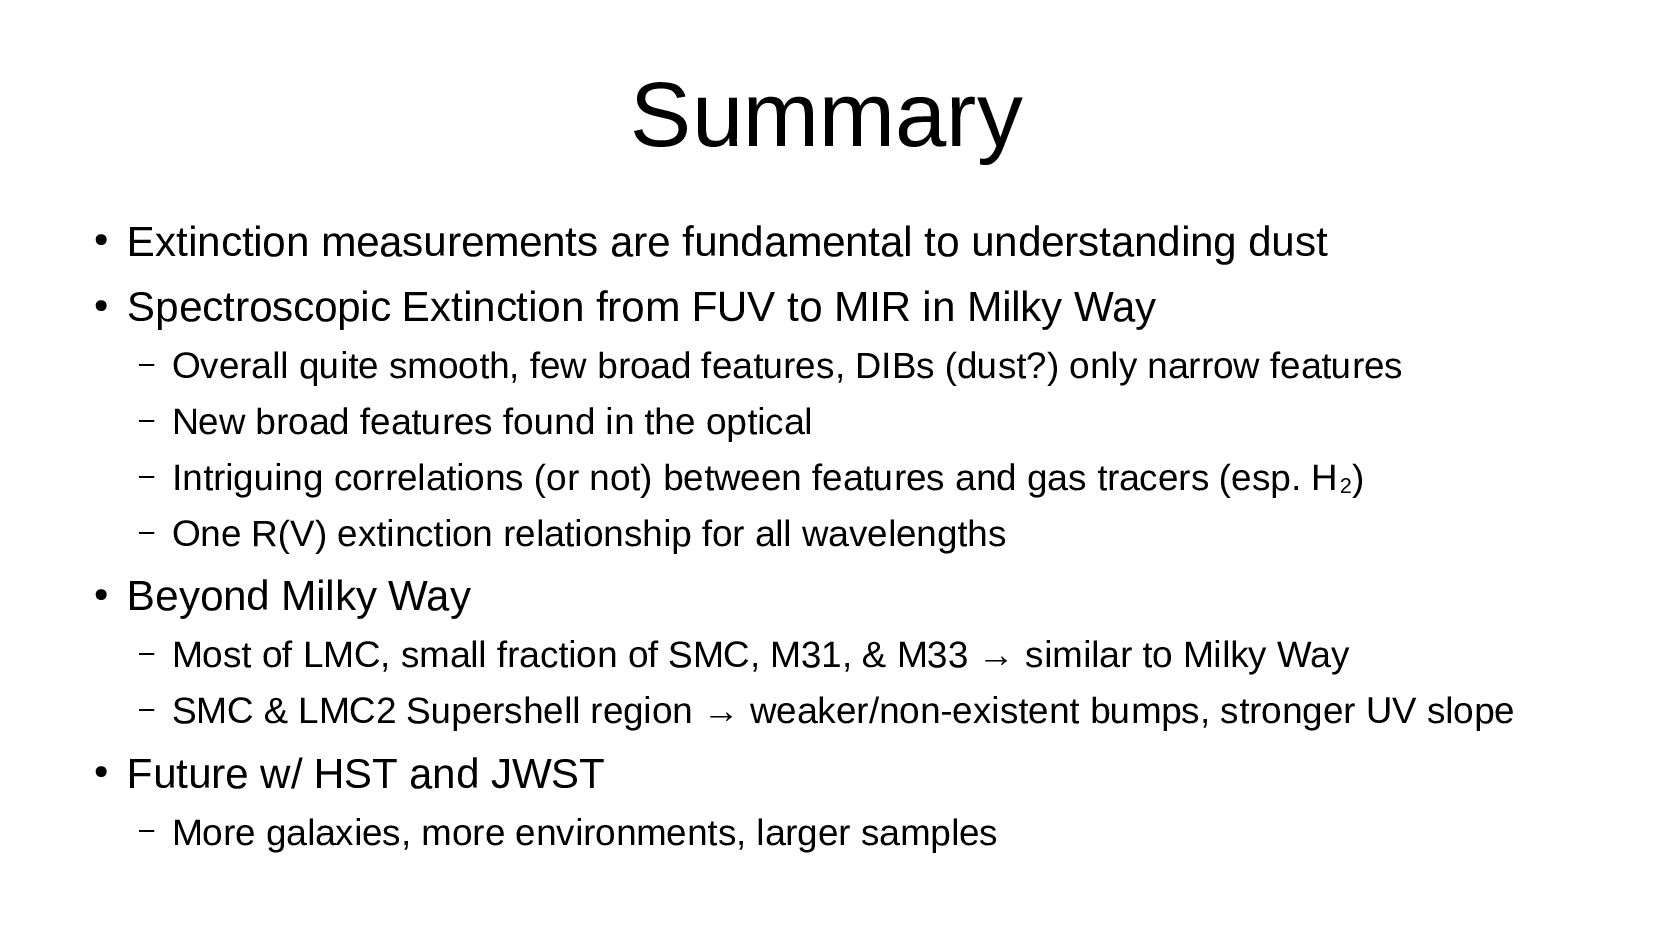
    Spectroscopic Extinction from FUV to MIR in Milky Way
    – Overall quite smooth, few broad features, DIBs (dust?) only narrow features
    – New broad features found in the optical
    – Intriguing correlations (or not) between features and gas tracers (esp. H2
    )
    – One R(V) extinction relationship for all wavelengths

    Beyond Milky Way
    – Most of LMC, small fraction of SMC, M31, & M33 → similar to Milky Way
    – SMC & LMC2 Supershell region → weaker/non-existent bumps, stronger UV slope

    Future w/ HST and JWST
    – More galaxies, more environments, larger samples

    View Slide

  60. Thanks

    View Slide