strategy is extremely important to reduce/eliminate application downtime and outages and achieve the goal of YBYO • Monitoring complexity is increasing and we need to plan monitoring upfront to ensure successful outcomes • To be truly agile we need to ensure that we are collecting and analyzing all the data that the application generates
to log large amount of highly structured JSON log messages • Enables logging of wide range of metrics which can be easily analyzed and visualized • Use cloud sleuth to introduce IDs that will help in distributed tracing, debugging and troubleshooting • Cloud Sleuth and logback makes adding fields to logs easy and automatic • The REST interface of elastic search can be leveraged for further integrations
charts, Bar charts etc.) • We can leverage the structured fields in the logs to build rich visualizations. • Visualizations can be further combined into dashboards to provide actionable insights into the performance of the system • Using Kibana we can build highly focused and targeted dashboards to analyze large amount of data and provide immense business value
build visualizations to track per user velocity of various important service invocations • Focus primarily on the metrics that help drive business decisions • These dashboards have also enabled us to crunch and analyze lot of data in small amount of time
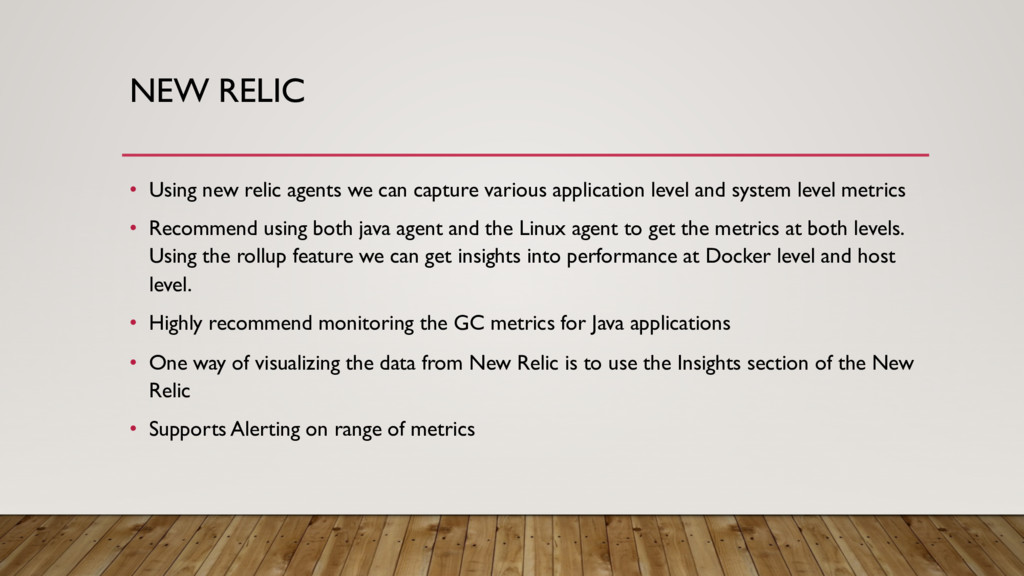
various application level and system level metrics • Recommend using both java agent and the Linux agent to get the metrics at both levels. Using the rollup feature we can get insights into performance at Docker level and host level. • Highly recommend monitoring the GC metrics for Java applications • One way of visualizing the data from New Relic is to use the Insights section of the New Relic • Supports Alerting on range of metrics
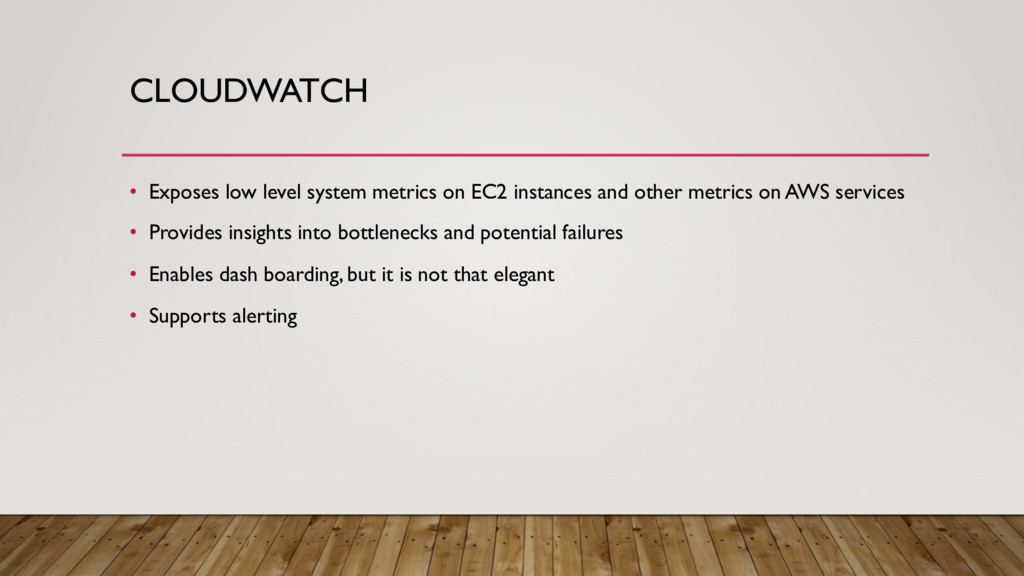
and other metrics on AWS services • Provides insights into bottlenecks and potential failures • Enables dash boarding, but it is not that elegant • Supports alerting
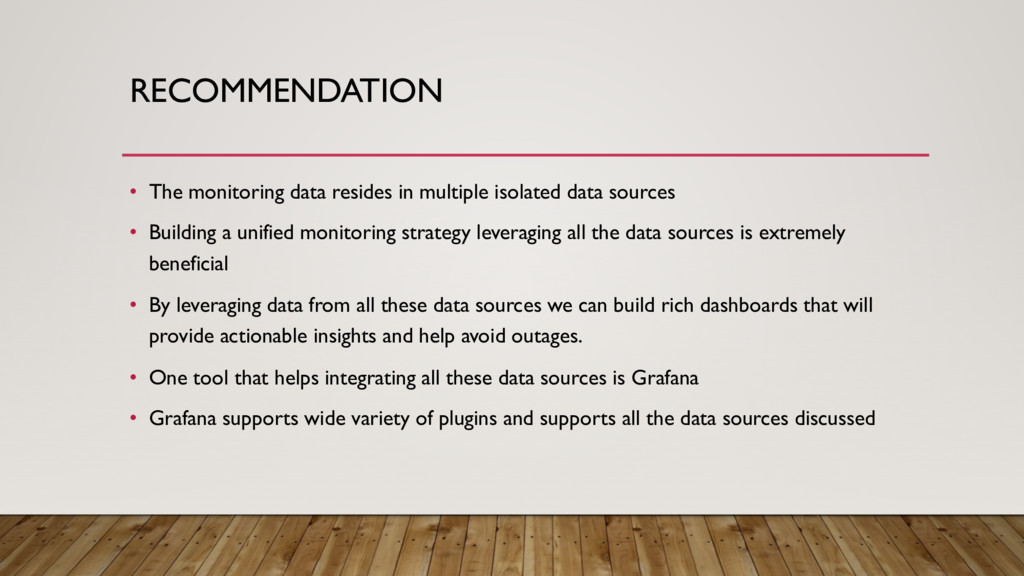
sources • Building a unified monitoring strategy leveraging all the data sources is extremely beneficial • By leveraging data from all these data sources we can build rich dashboards that will provide actionable insights and help avoid outages. • One tool that helps integrating all these data sources is Grafana • Grafana supports wide variety of plugins and supports all the data sources discussed