Upgrade to Pro — share decks privately, control downloads, hide ads and more …

Unlocking the Potential of Data

Unlocking the Potential of Data

Slides from a talk that I gave at Fifth Elephant, a Big Data Conference in Bangalore, in July 2013.

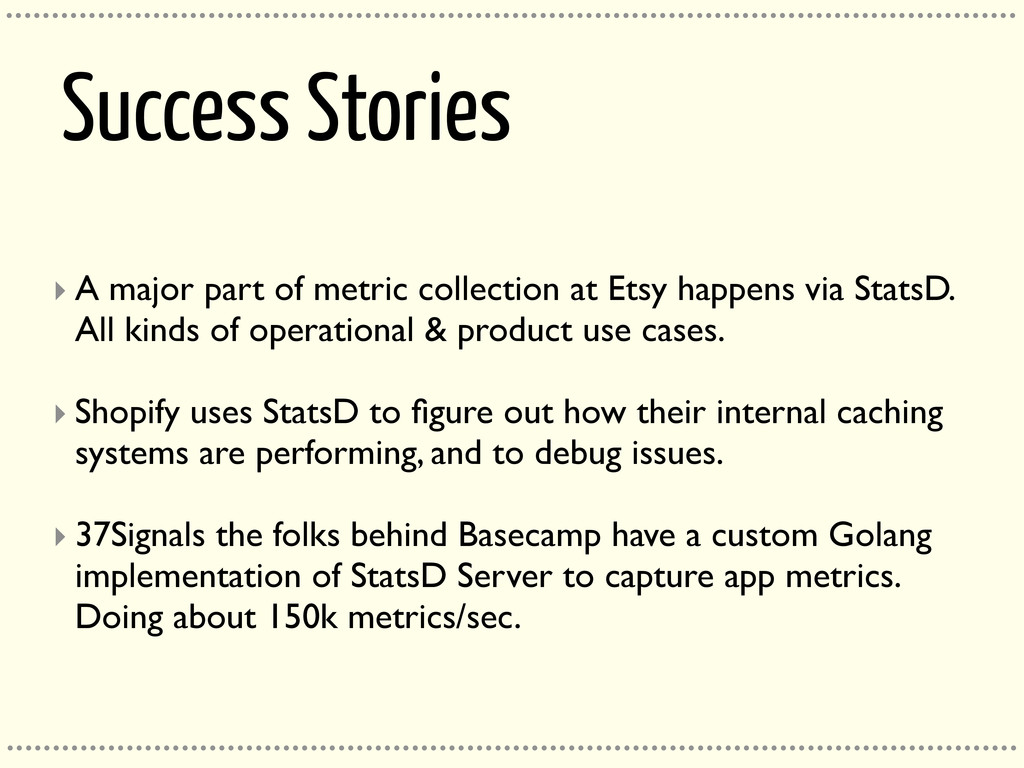
This talk focusses on how product managers and developers can use simple techniques, and unlock the potential of data in building better products and applications everyday!

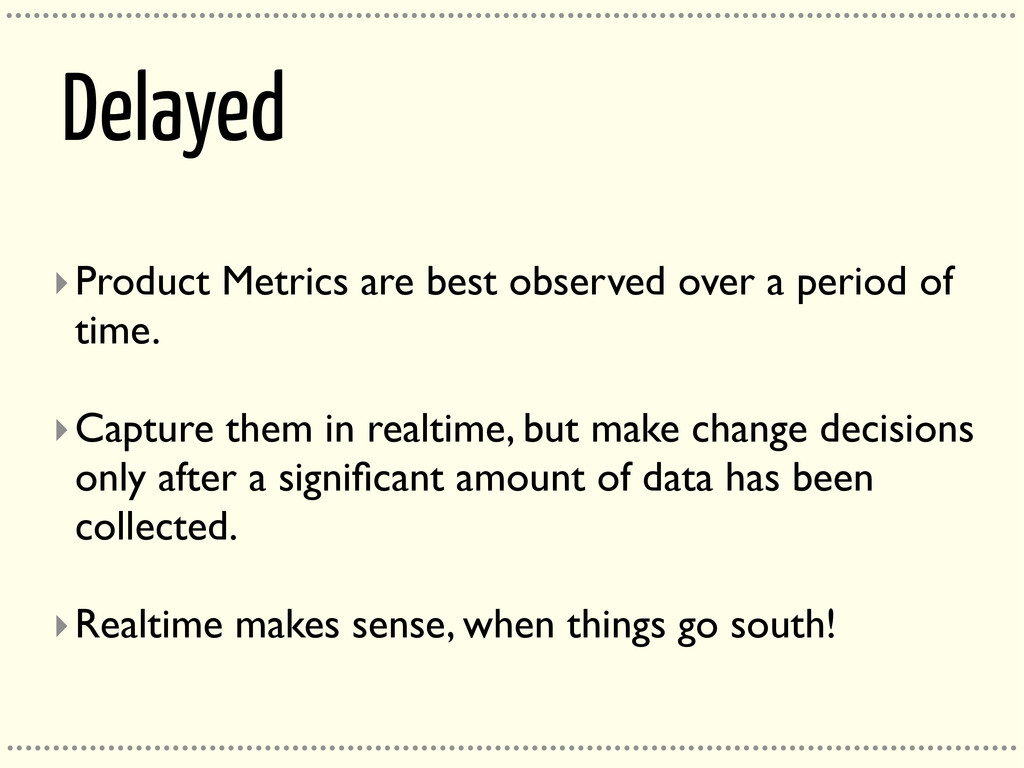
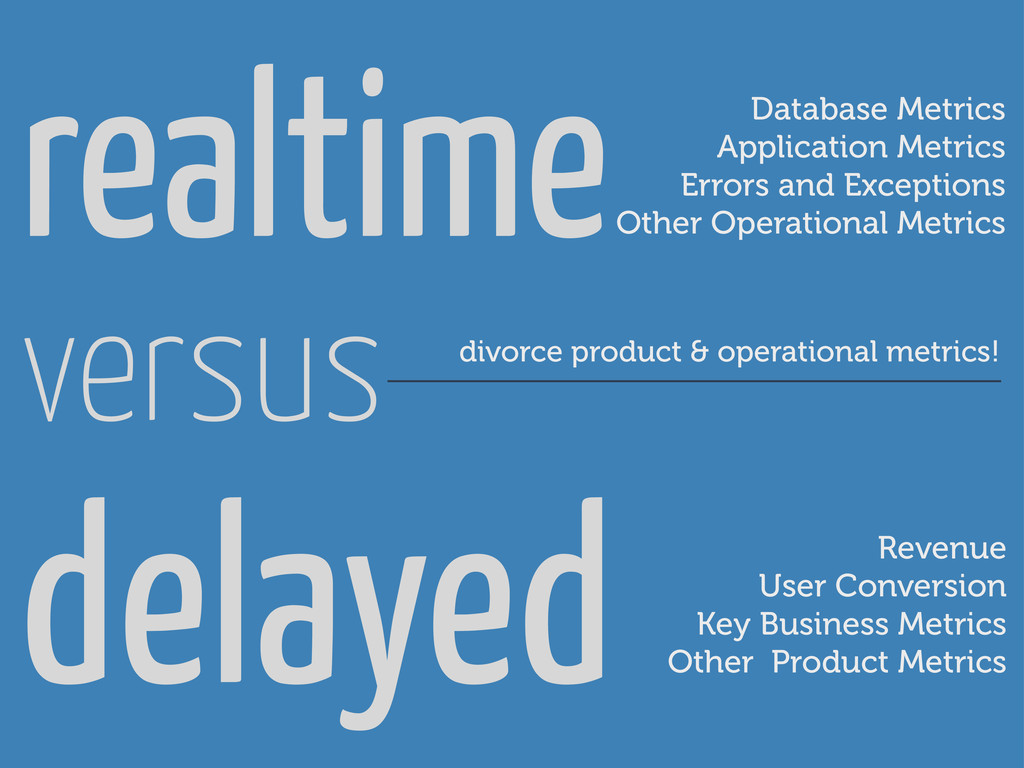
Focusses on the potential of real time analytics, and instrumentation of the application, and how that would lead to better insights on the application everyday and every minute it runs!

Karthik Kastury

July 13, 2013
Tweet

More Decks by Karthik Kastury

Other Decks in Technology

Transcript

  1. Karthik Kastury Software Engineer - PayPal India Engineer / Hacker

    / Blogger / Apple fanboi and evil minded. *Pun Intended* 24x7 Internet Geek | Unlucky in Cards ................................................................................................................................ ................................................................................................................................ Twitter Email [email protected] @KarthikDot Internet Addict for 12+ Years...
  2. .............................................................................................................. .............................................................................................................. Benefits ‣Total visibility into your app’s behavior in

    production. ‣No more “Hey it works fine on my machine!” ‣Feedback loops are extremely short, so the time between a change, and things going bad is is super *small* ‣Quickly find the needle in the haystack when things mess up!
  3. .............................................................................................................. .............................................................................................................. What is StatsD? ‣A network daemon that listens

    for statistics and aggregates them on the fly. ‣Multiple types of metrics, counters, timers, gauges. ‣Default Backend is Graphite, but can send data downstream to all sorts of backends.
  4. .............................................................................................................. .............................................................................................................. Backend Configuration ‣Configure your stats backend to capture

    mean, median, 75th, 90th, 95th and 99th percentile data. ‣Just capturing mean/median is generally not recommended. pro tip! ‣Don’t do DNS resolution while sending stats to StatsD or to the backend.
  5. .............................................................................................................. .............................................................................................................. Scalability ‣A Single StatsD Server can receive ten’s

    of thousands of events per second on a decently powered machine. ‣Horizontally Scalable. You can shard metrics depending on their namespace and send them to different StatsD instances. ‣StatsD receives metrics over UDP rather than TCP.
  6. .............................................................................................................. .............................................................................................................. Metric Roll Ups ‣Graphite, and most other backends

    allow you to roll up data as you go to lower precisions. ‣StatsD by default flushes aggregated metrics to the backend every 10s. ‣Here’s my roll up scheme. 10s, 1min, 5min, 60min, 24hr, 30days, 1year
  7. .............................................................................................................. .............................................................................................................. Metrics Backends ‣You can send data to one

    or multiple backends from StatsD. ‣Graphite is the most popular and the default backend for StatsD. http://graphite.wikidot.com/ ‣Commercial alternatives like InstrumentalApp, Librato Metrics exist. https://instrumentalapp.com/ https://metrics.librato.com/
  8. .............................................................................................................. .............................................................................................................. Dashboards (Open Source) ‣Graphite allows to build dashboards

    fairly easily, combining different metrics in any way you want. ‣But Graphite’s Graphs are kinda boring! ‣Whole lot of open source, dashboard/graphing solutions that work with Graphite exist.
  9. Graphite Giraffe Graphiti Tasseo Dashing GDash Graphene graphite.wikidot.com/start giraffe.kenhub.com github.com/paperlesspost/graphiti

    github.com/obfuscurity/tasseo shopify.github.io/dashing github.com/ripienaar/gdash jondot.github.io/graphene .............................................................................................................. ..............................................................................................................
  10. .............................................................................................................. .............................................................................................................. Dashboards (Commercial) ‣StatsD supports various other backends to

    which it send data to. ‣InstrumentalApp is a wonderful choice, if you quickly want to build dashboards. https://instrumentalapp.com/ ‣Librato Metrics is *even* more awesome. Dashboards + Alerts and Notifications via Email / PagerDuty etc. https://metrics.librato.com/
  11. .............................................................................................................. .............................................................................................................. Realtime ‣Extra pressure. You tend to over measure

    every small change. ‣Never take product decisions with a few hours worth of data. Wait for a few days for patterns to kick in. ‣Realtime makes sense for key business metrics, application metrics, infrastructure. ‣Divorce Product and Operational Metrics.
  12. realtime versus delayed Database Metrics Application Metrics Errors and Exceptions

    Other Operational Metrics Revenue User Conversion Key Business Metrics Other Product Metrics divorce product & operational metrics!
  13. .............................................................................................................. .............................................................................................................. Success Stories ‣ A major part of metric

    collection at Etsy happens via StatsD. All kinds of operational & product use cases. ‣ Shopify uses StatsD to figure out how their internal caching systems are performing, and to debug issues. ‣ 37Signals the folks behind Basecamp have a custom Golang implementation of StatsD Server to capture app metrics. Doing about 150k metrics/sec.