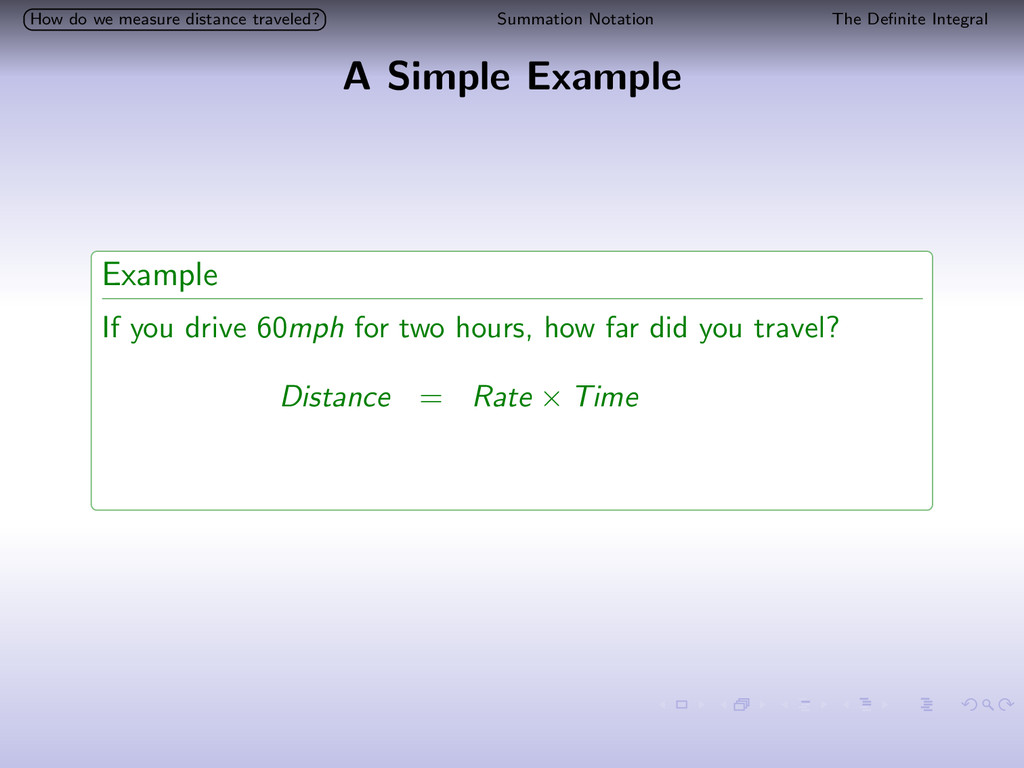
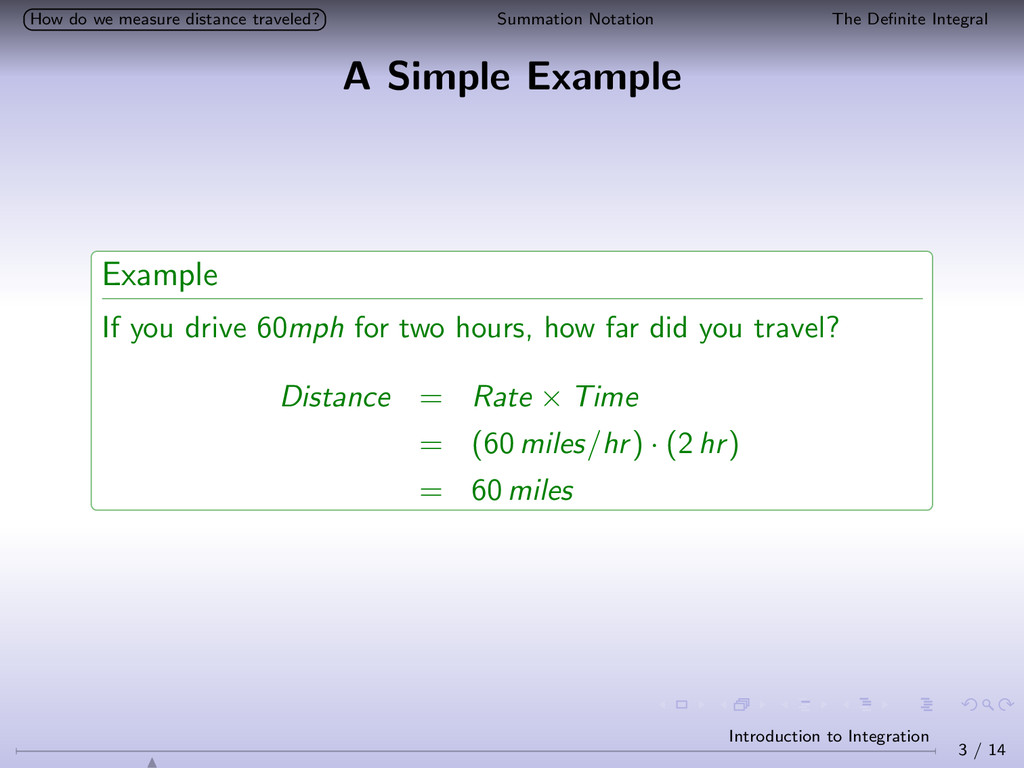
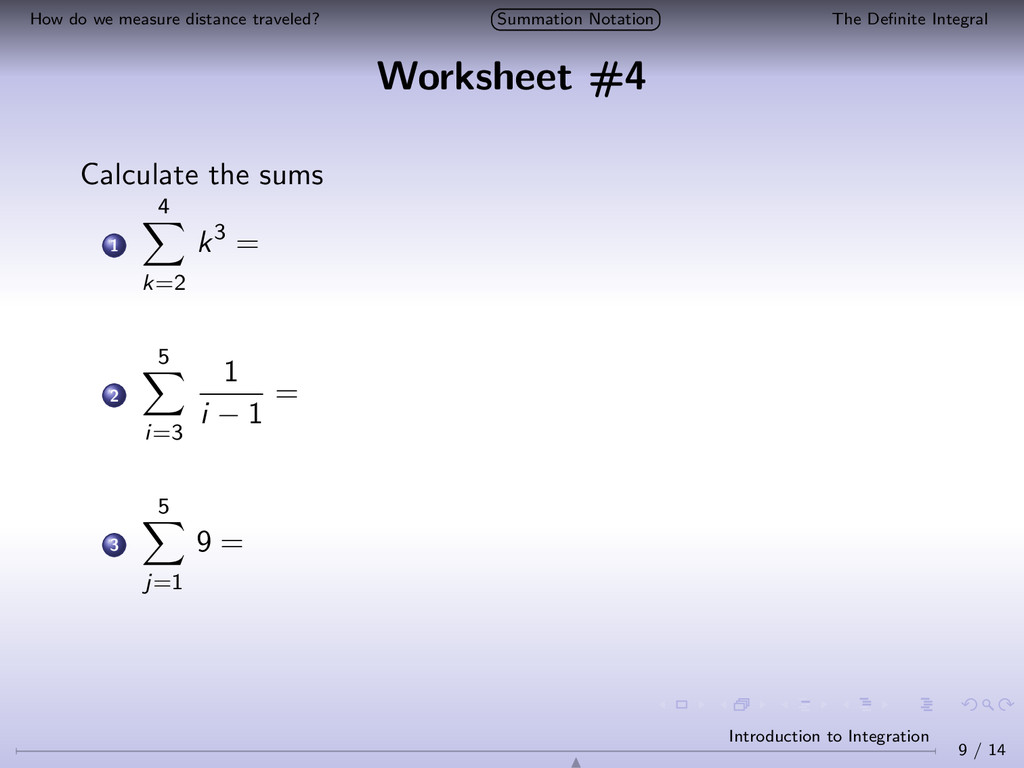
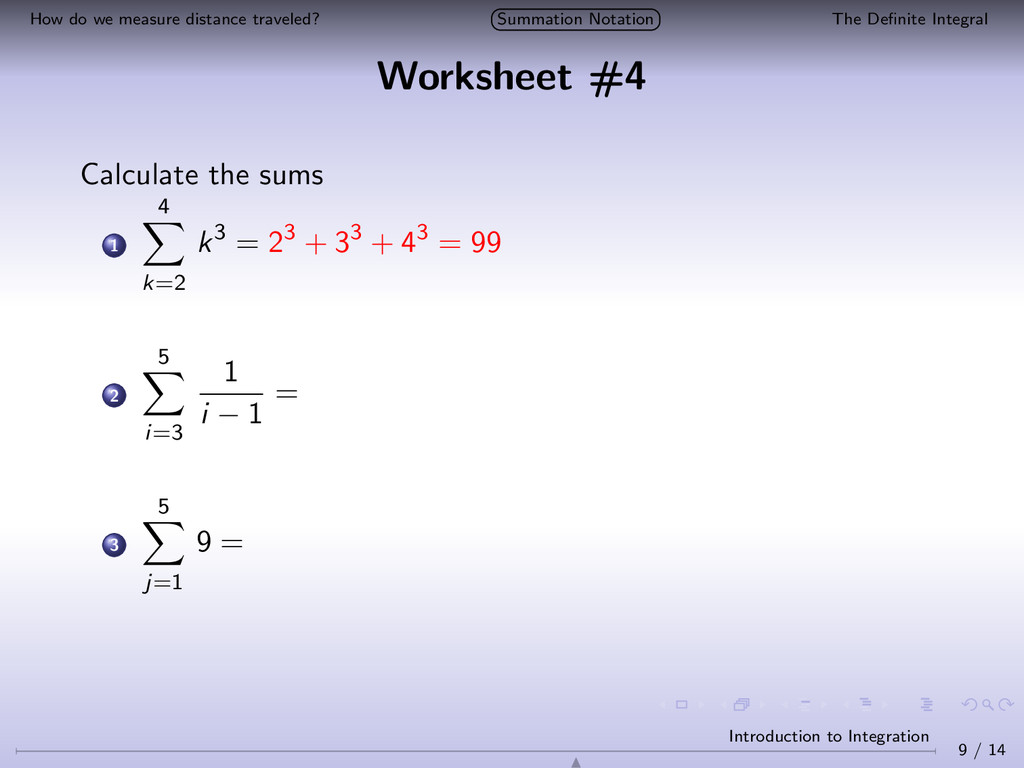
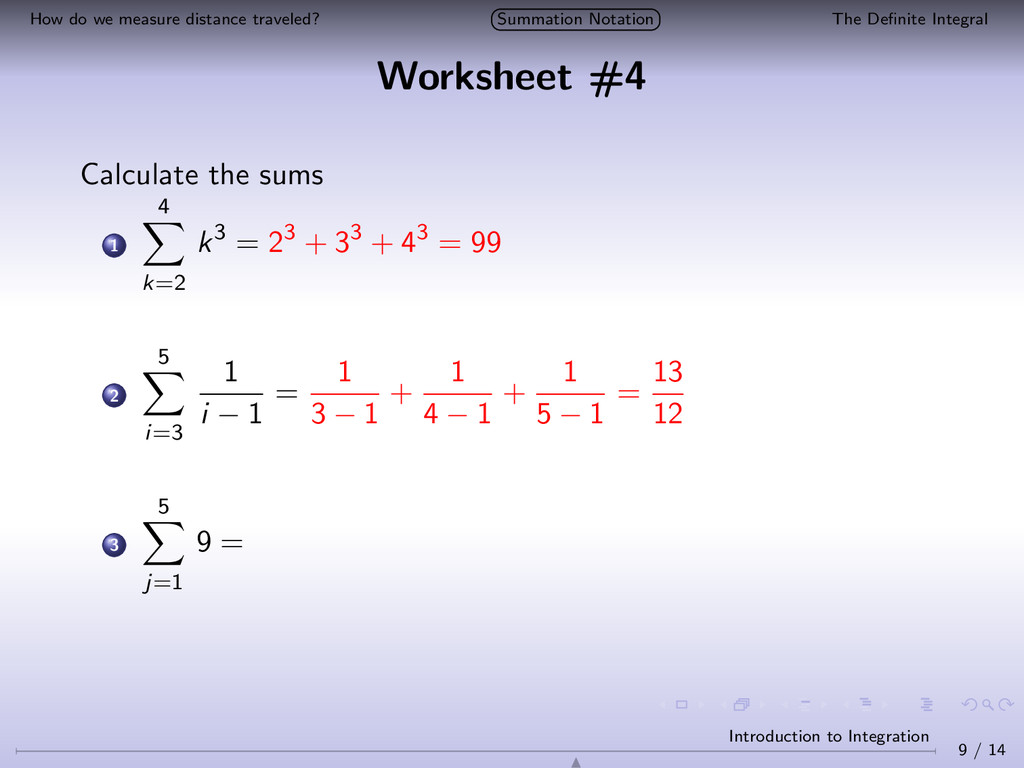
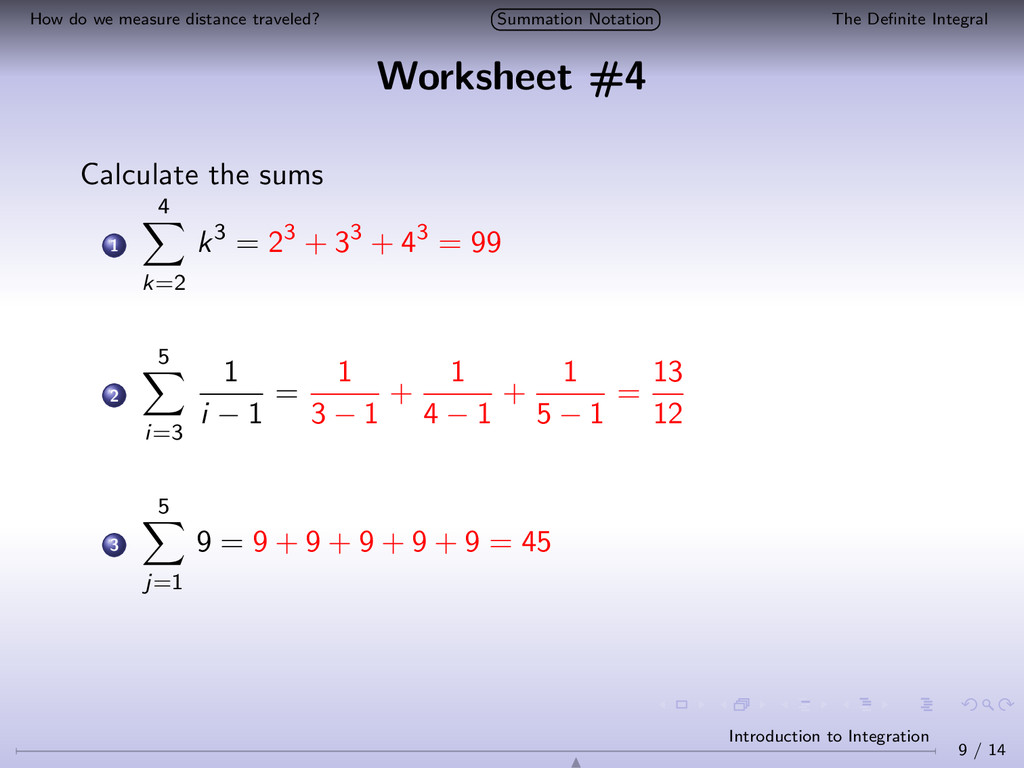
Integral A Simple Example Example If you drive 60mph for two hours, how far did you travel? Distance = Rate × Time = (60 miles/hr) · (2 hr) = 60 miles 3 / 14 Introduction to Integration
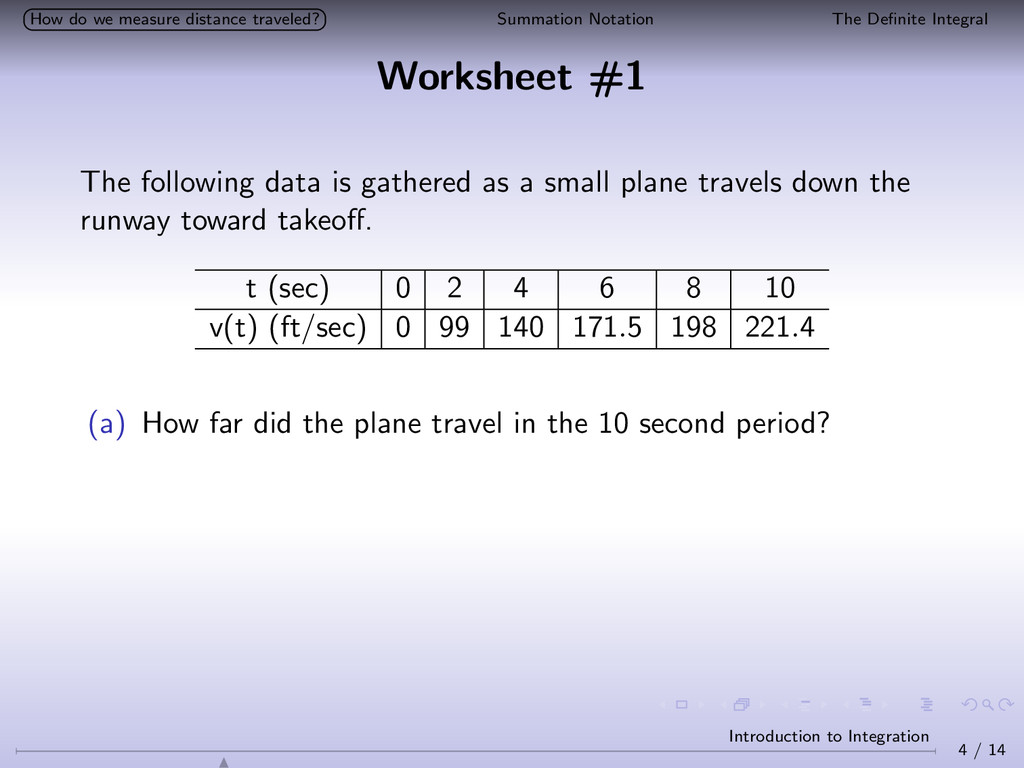
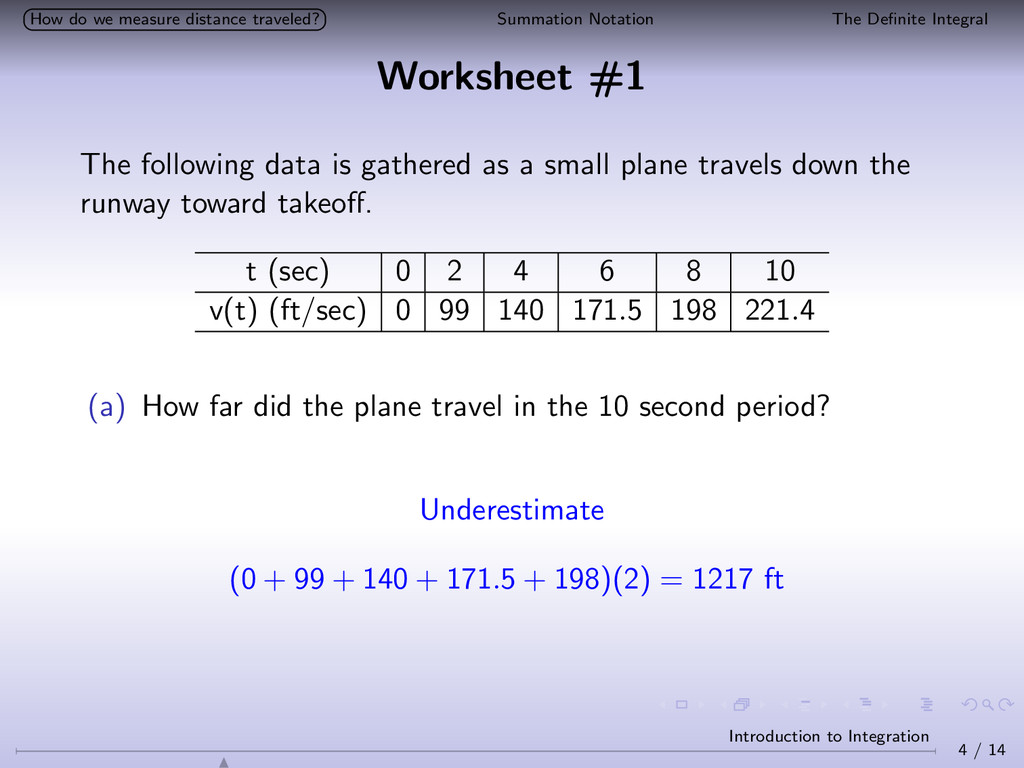
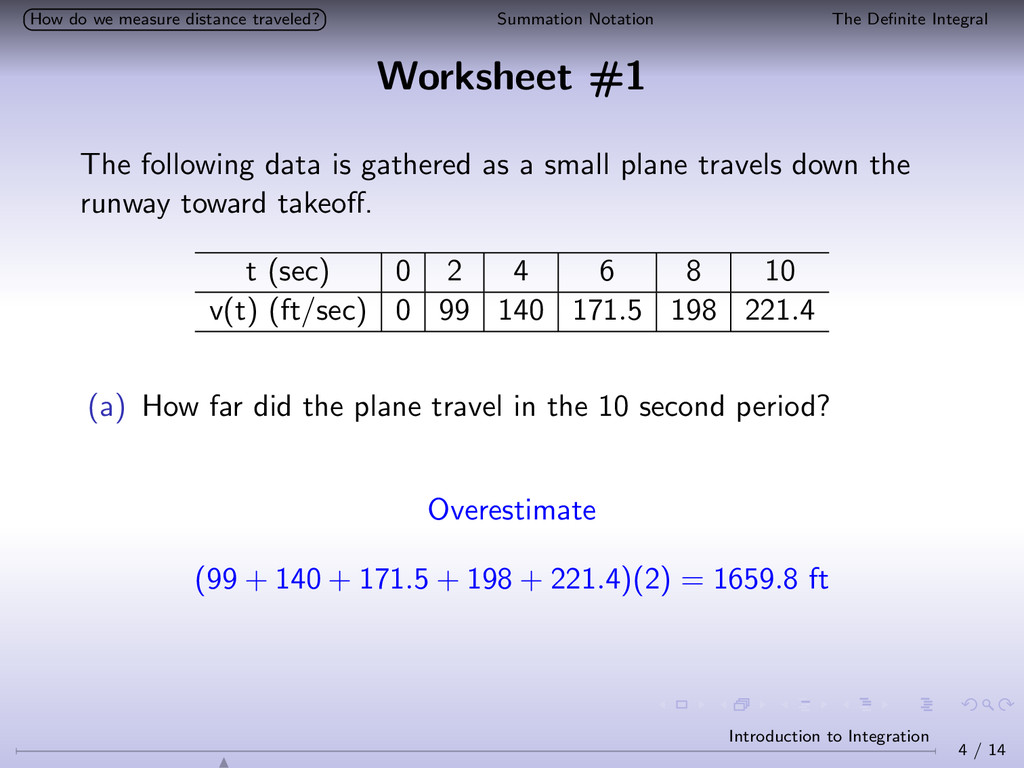
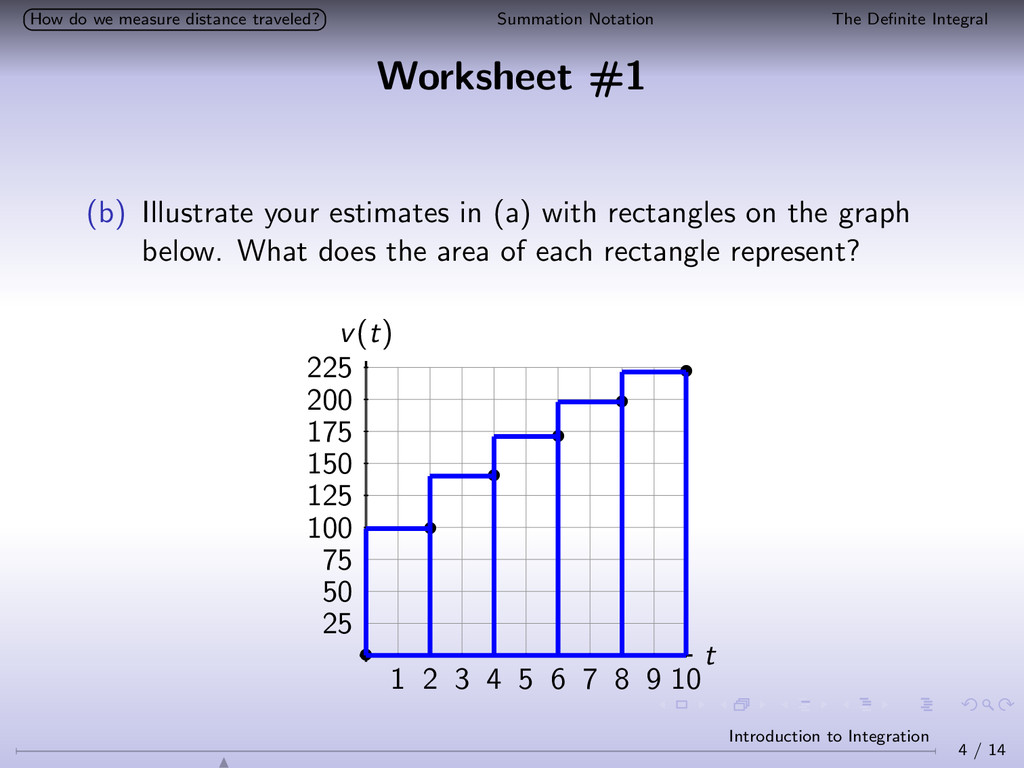
Integral Worksheet #1 The following data is gathered as a small plane travels down the runway toward takeoff. t (sec) 0 2 4 6 8 10 v(t) (ft/sec) 0 99 140 171.5 198 221.4 (a) How far did the plane travel in the 10 second period? 4 / 14 Introduction to Integration
Integral Worksheet #1 The following data is gathered as a small plane travels down the runway toward takeoff. t (sec) 0 2 4 6 8 10 v(t) (ft/sec) 0 99 140 171.5 198 221.4 (a) How far did the plane travel in the 10 second period? Underestimate (0 + 99 + 140 + 171.5 + 198)(2) = 1217 ft 4 / 14 Introduction to Integration
Integral Worksheet #1 The following data is gathered as a small plane travels down the runway toward takeoff. t (sec) 0 2 4 6 8 10 v(t) (ft/sec) 0 99 140 171.5 198 221.4 (a) How far did the plane travel in the 10 second period? Overestimate (99 + 140 + 171.5 + 198 + 221.4)(2) = 1659.8 ft 4 / 14 Introduction to Integration
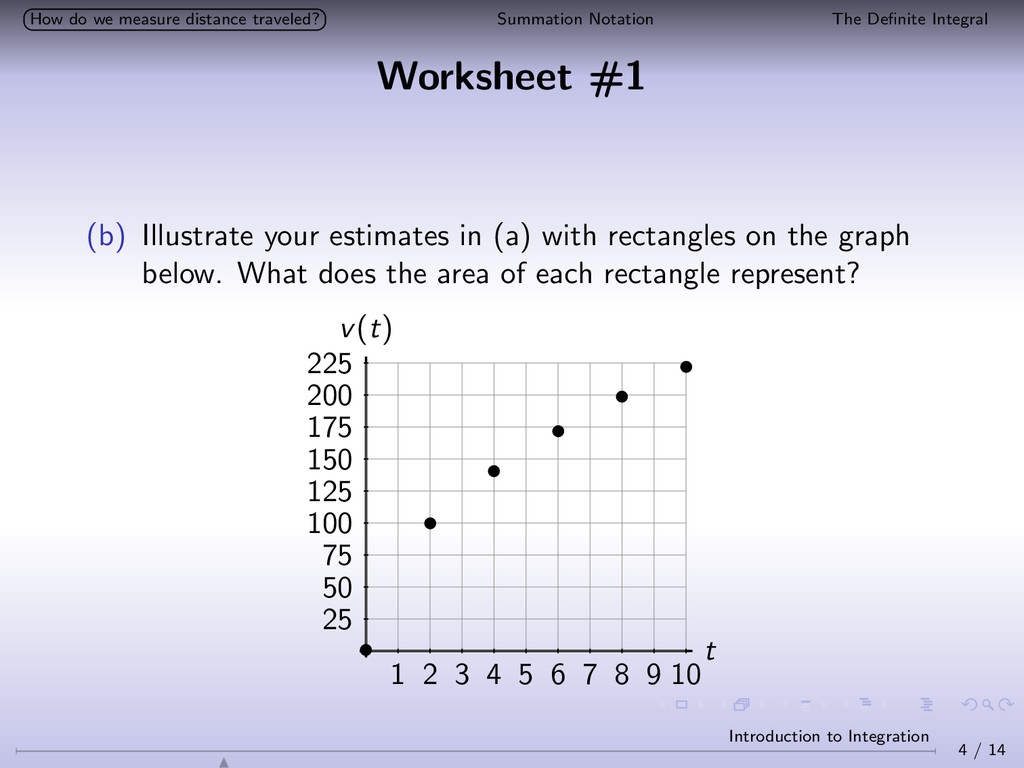
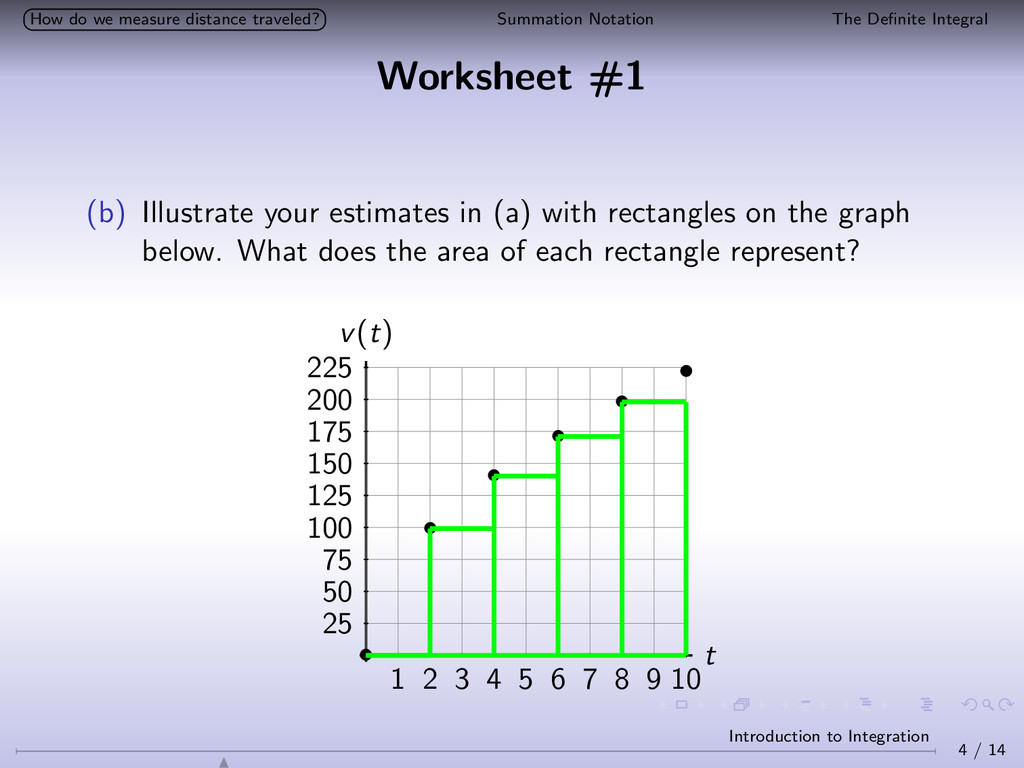
Integral Worksheet #1 (b) Illustrate your estimates in (a) with rectangles on the graph below. What does the area of each rectangle represent? v(t) t 1 2 3 4 5 6 7 8 9 10 25 50 75 100 125 150 175 200 225 • • • • • • 4 / 14 Introduction to Integration
Integral Worksheet #1 (b) Illustrate your estimates in (a) with rectangles on the graph below. What does the area of each rectangle represent? v(t) t 1 2 3 4 5 6 7 8 9 10 25 50 75 100 125 150 175 200 225 • • • • • • 4 / 14 Introduction to Integration
Integral Worksheet #1 (b) Illustrate your estimates in (a) with rectangles on the graph below. What does the area of each rectangle represent? v(t) t 1 2 3 4 5 6 7 8 9 10 25 50 75 100 125 150 175 200 225 • • • • • • 4 / 14 Introduction to Integration
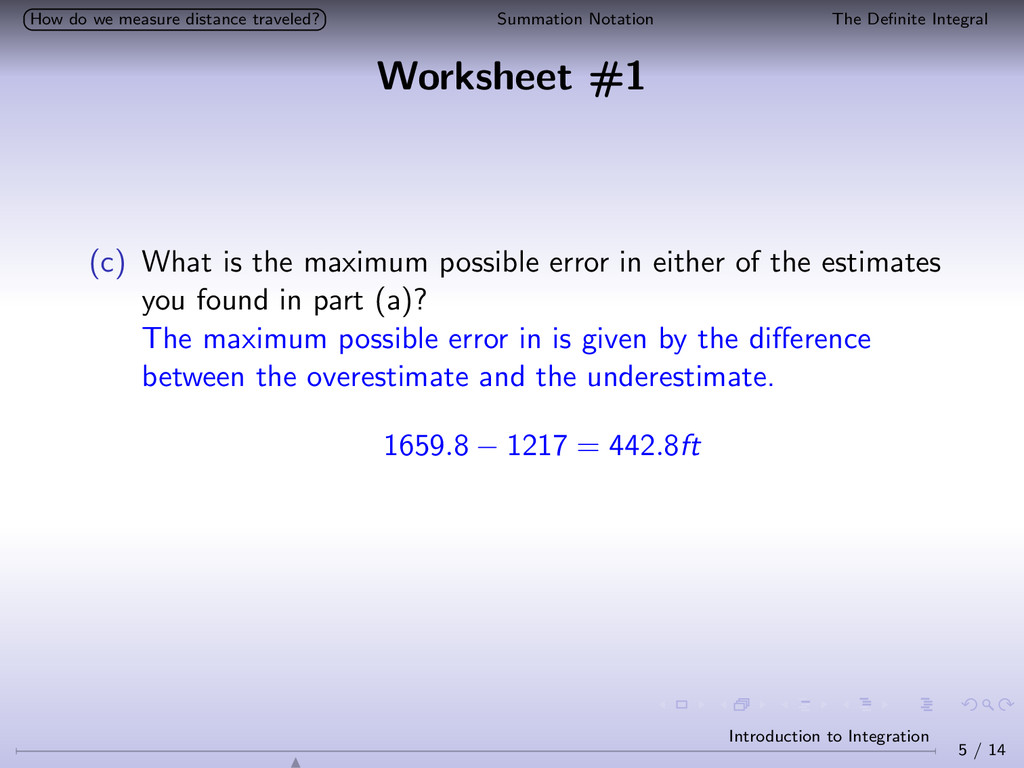
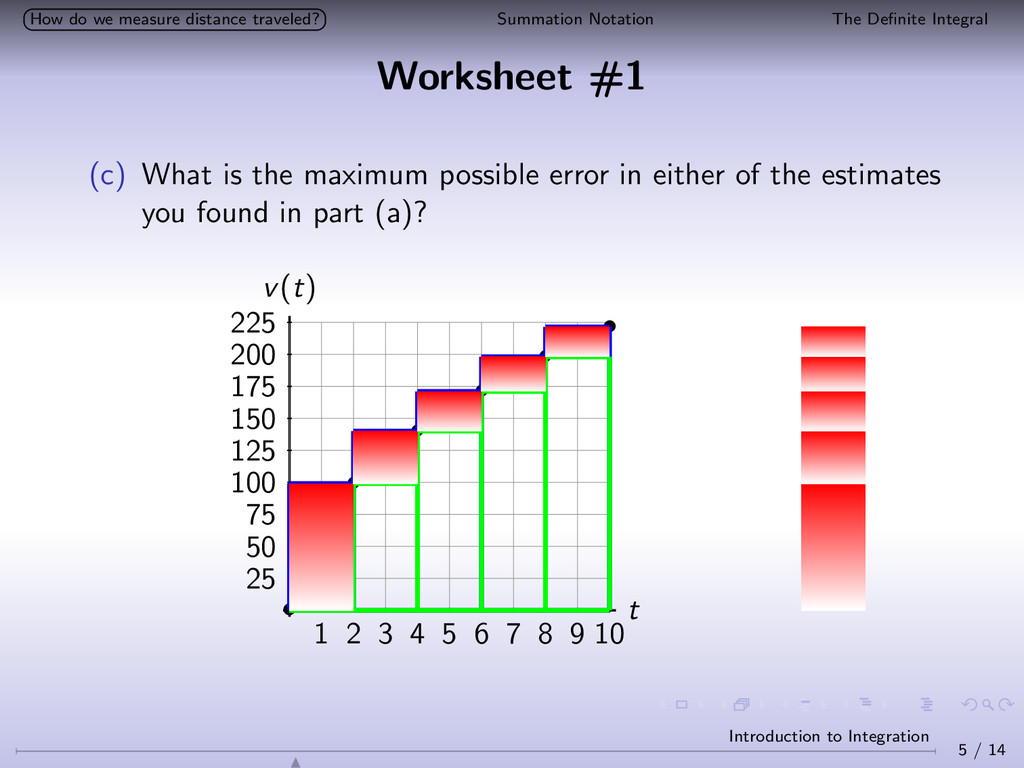
Integral Worksheet #1 (c) What is the maximum possible error in either of the estimates you found in part (a)? The maximum possible error in is given by the difference between the overestimate and the underestimate. 1659.8 − 1217 = 442.8ft 5 / 14 Introduction to Integration
Integral Worksheet #1 (c) What is the maximum possible error in either of the estimates you found in part (a)? v(t) t 1 2 3 4 5 6 7 8 9 10 25 50 75 100 125 150 175 200 225 • • • • • • 5 / 14 Introduction to Integration
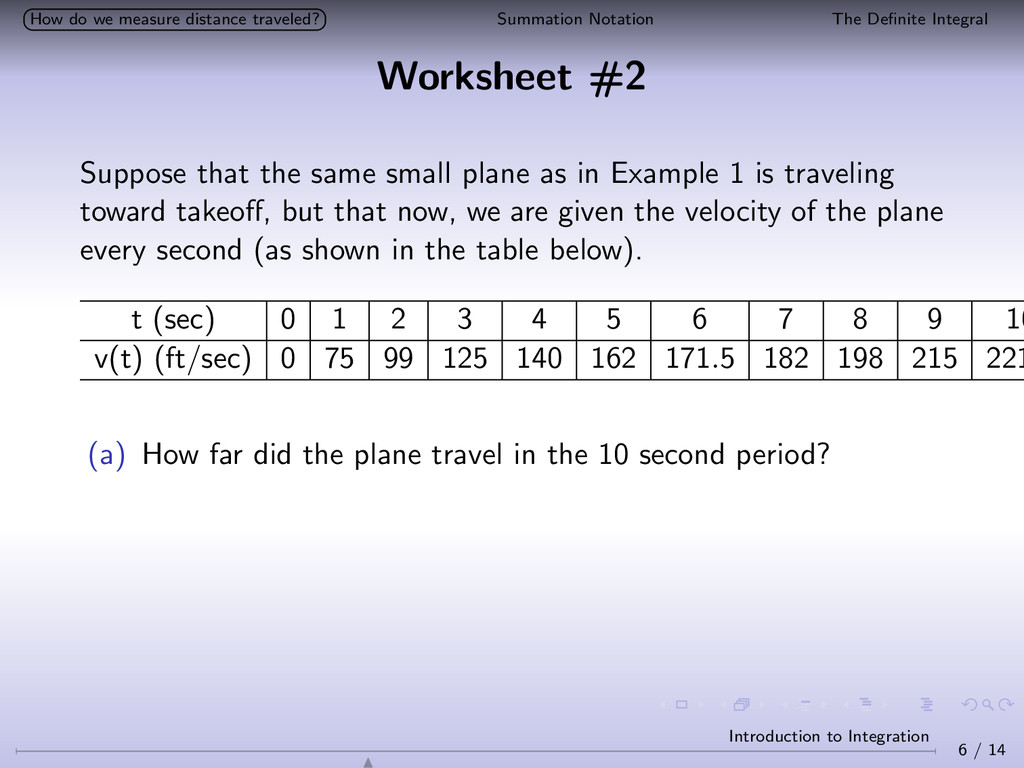
Integral Worksheet #2 Suppose that the same small plane as in Example 1 is traveling toward takeoff, but that now, we are given the velocity of the plane every second (as shown in the table below). t (sec) 0 1 2 3 4 5 6 7 8 9 10 v(t) (ft/sec) 0 75 99 125 140 162 171.5 182 198 215 221 (a) How far did the plane travel in the 10 second period? 6 / 14 Introduction to Integration
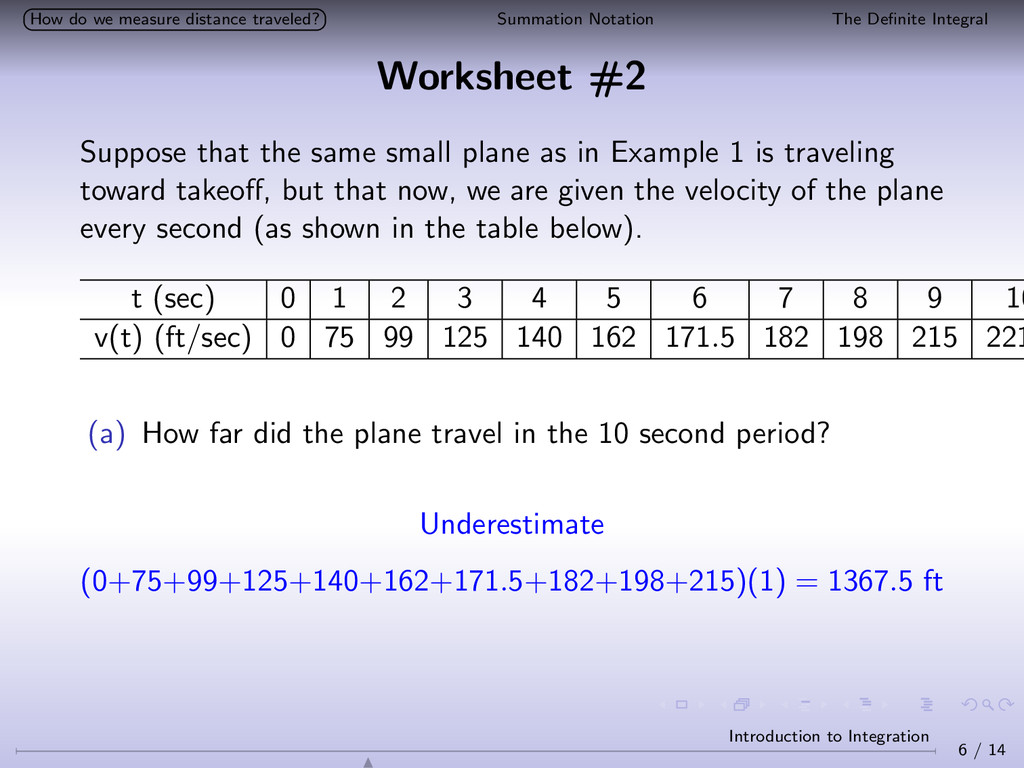
Integral Worksheet #2 Suppose that the same small plane as in Example 1 is traveling toward takeoff, but that now, we are given the velocity of the plane every second (as shown in the table below). t (sec) 0 1 2 3 4 5 6 7 8 9 10 v(t) (ft/sec) 0 75 99 125 140 162 171.5 182 198 215 221 (a) How far did the plane travel in the 10 second period? Underestimate (0+75+99+125+140+162+171.5+182+198+215)(1) = 1367.5 ft 6 / 14 Introduction to Integration
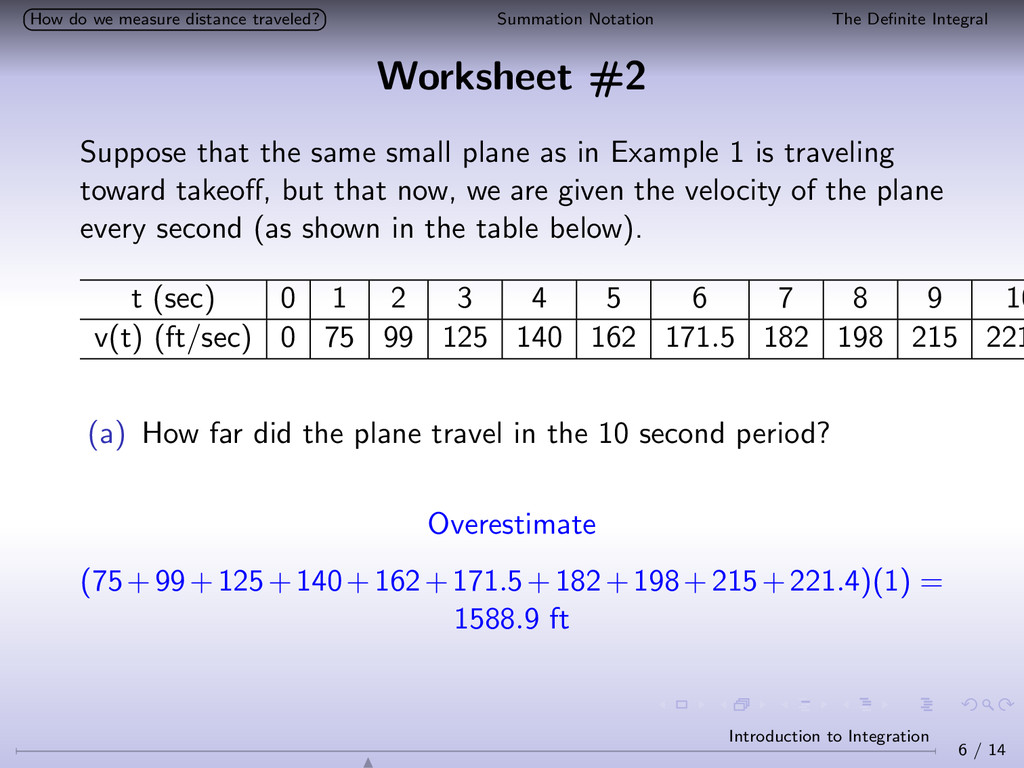
Integral Worksheet #2 Suppose that the same small plane as in Example 1 is traveling toward takeoff, but that now, we are given the velocity of the plane every second (as shown in the table below). t (sec) 0 1 2 3 4 5 6 7 8 9 10 v(t) (ft/sec) 0 75 99 125 140 162 171.5 182 198 215 221 (a) How far did the plane travel in the 10 second period? Overestimate (75+99+125+140+162+171.5+182+198+215+221.4)(1) = 1588.9 ft 6 / 14 Introduction to Integration
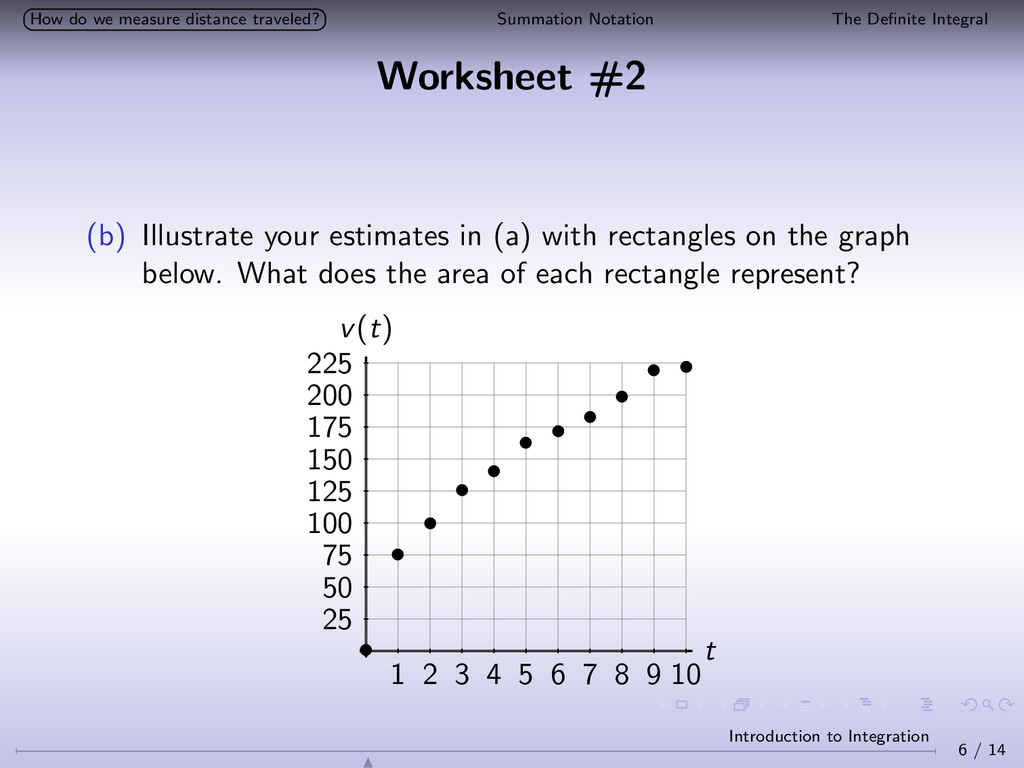
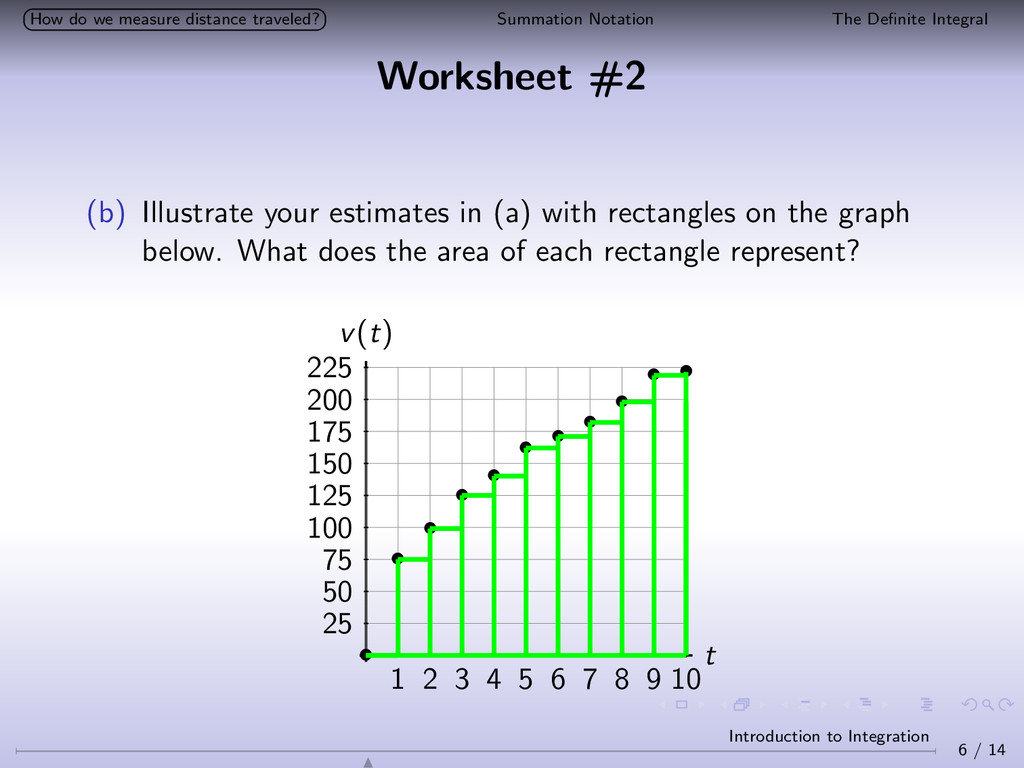
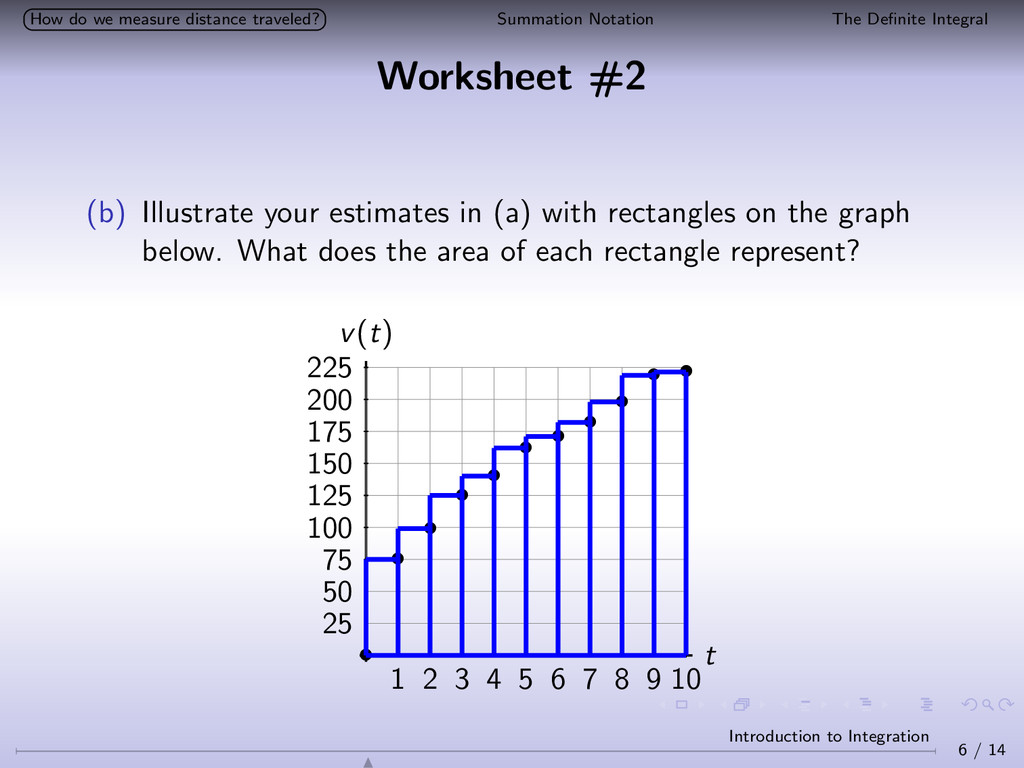
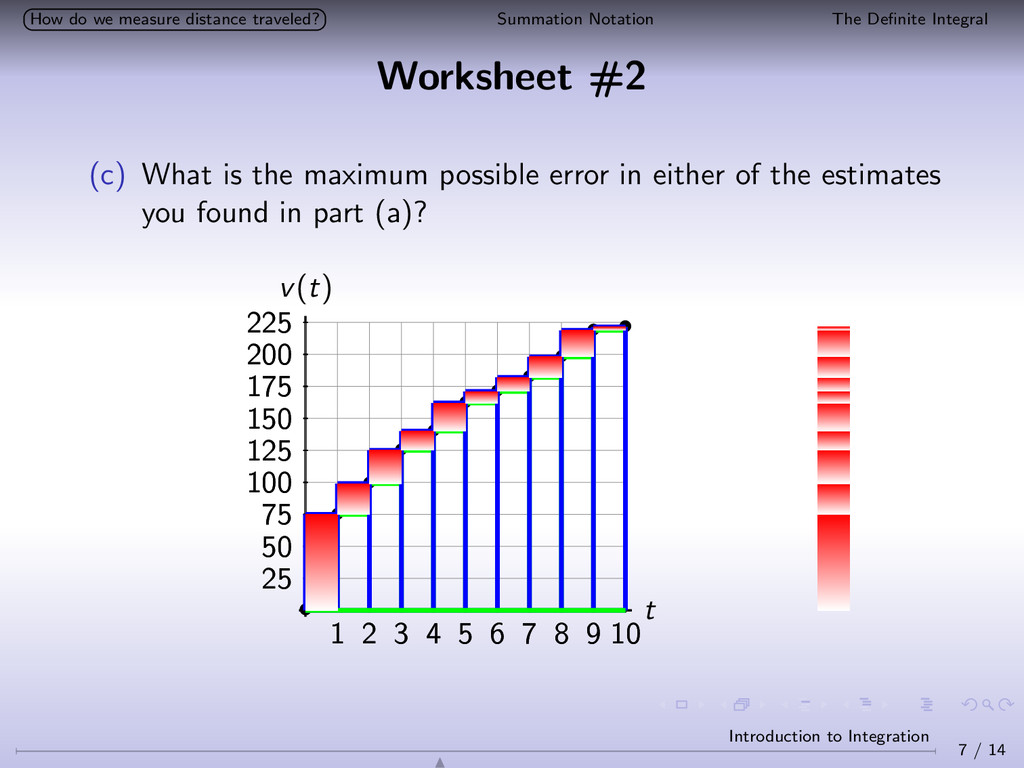
Integral Worksheet #2 (b) Illustrate your estimates in (a) with rectangles on the graph below. What does the area of each rectangle represent? v(t) t 1 2 3 4 5 6 7 8 9 10 25 50 75 100 125 150 175 200 225 • • • • • • • • • • • 6 / 14 Introduction to Integration
Integral Worksheet #2 (b) Illustrate your estimates in (a) with rectangles on the graph below. What does the area of each rectangle represent? v(t) t 1 2 3 4 5 6 7 8 9 10 25 50 75 100 125 150 175 200 225 • • • • • • • • • • • 6 / 14 Introduction to Integration
Integral Worksheet #2 (b) Illustrate your estimates in (a) with rectangles on the graph below. What does the area of each rectangle represent? v(t) t 1 2 3 4 5 6 7 8 9 10 25 50 75 100 125 150 175 200 225 • • • • • • • • • • • 6 / 14 Introduction to Integration
Integral Worksheet #2 (c) What is the maximum possible error in either of the estimates you found in part (a)? The maximum possible error in is given by the difference between the overestimate and the underestimate. 1588.9 − 1367.5 = 221.4ft 7 / 14 Introduction to Integration
Integral Worksheet #2 (c) What is the maximum possible error in either of the estimates you found in part (a)? v(t) t 1 2 3 4 5 6 7 8 9 10 25 50 75 100 125 150 175 200 225 1 2 3 4 5 6 7 8 9 10 25 50 75 100 125 150 175 200 225 • • • • • • • • • • • 7 / 14 Introduction to Integration
Integral Quick Check A sprinter practices by running various distances back and forth in a straight line in a gym. Her velocity at t seconds is given by the function v(t). What does 60 0 |v(t)|dt represent? 1 The total distance the sprinter ran in one minute 2 The sprinter’s average velocity in one minute 3 The sprinter’s distance from the starting point after one minute 4 None of the above 8 / 14 Introduction to Integration
Integral Quick Check A sprinter practices by running various distances back and forth in a straight line in a gym. Her velocity at t seconds is given by the function v(t). What does 60 0 |v(t)|dt represent? 1 The total distance the sprinter ran in one minute 2 The sprinter’s average velocity in one minute 3 The sprinter’s distance from the starting point after one minute 4 None of the above 8 / 14 Introduction to Integration
Integral Quick Check A sprinter practices by running various distances back and forth in a straight line in a gym. Her velocity at t seconds is given by the function v(t). What does 60 0 |v(t)|dt represent? 1 The total distance the sprinter ran in one minute 2 The sprinter’s average velocity in one minute 3 The sprinter’s distance from the starting point after one minute 4 None of the above The integral 60 0 v(t) dt represents the total displacement of the runner relative to her starting position. 8 / 14 Introduction to Integration
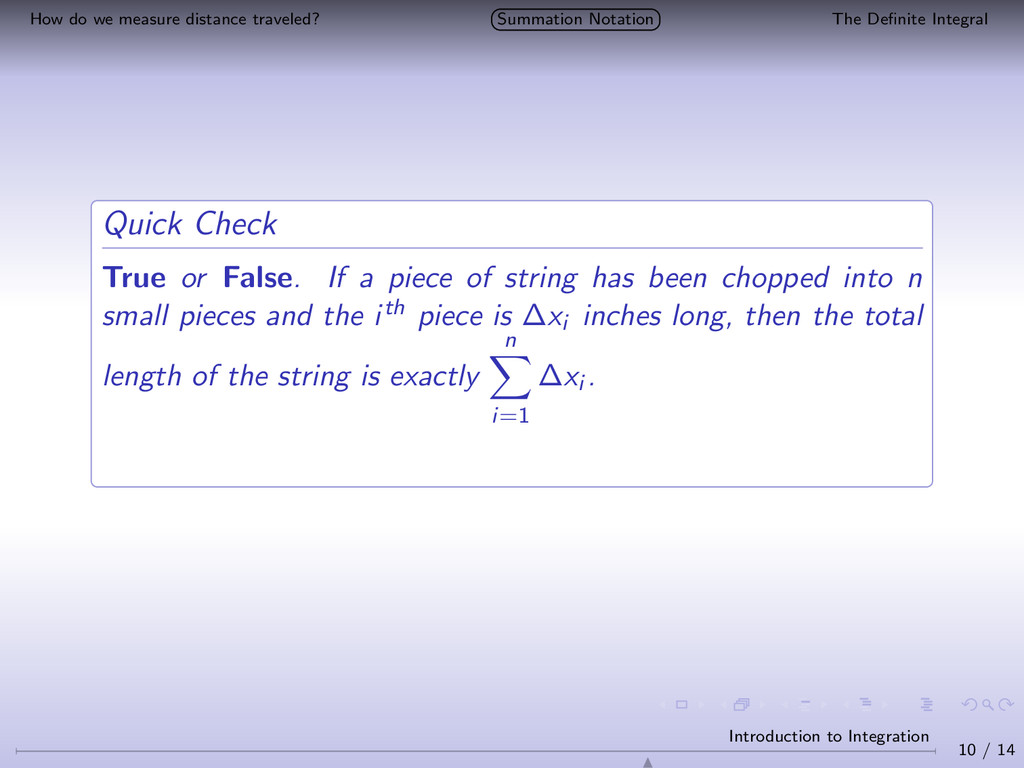
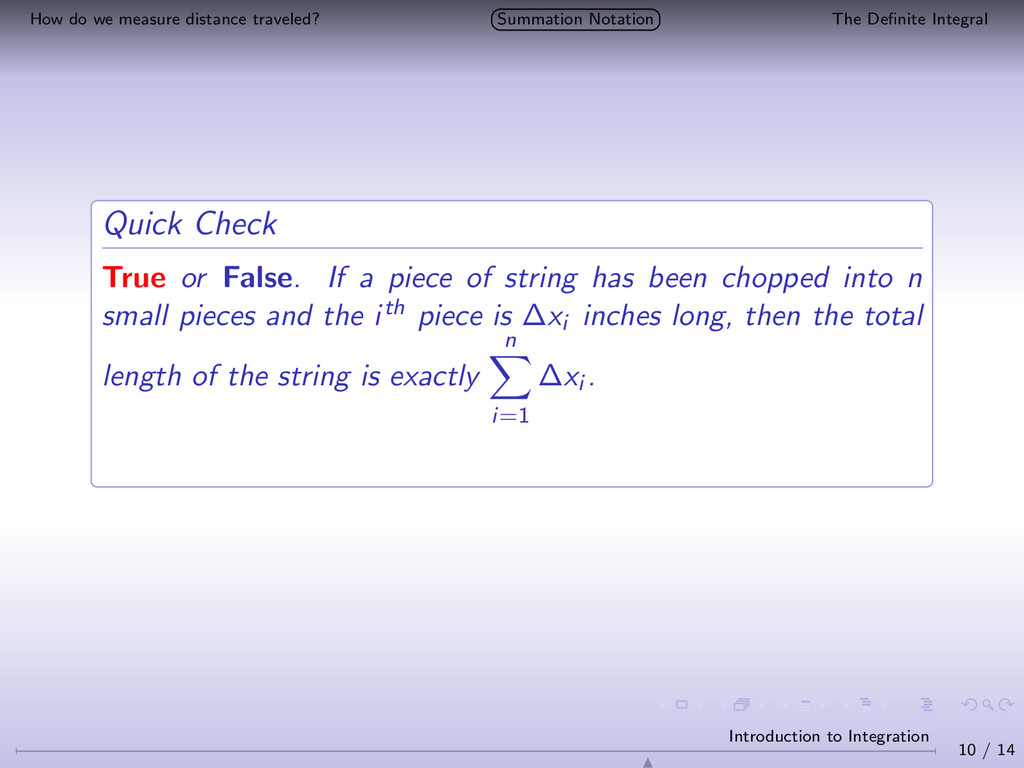
Integral Quick Check True or False. If a piece of string has been chopped into n small pieces and the ith piece is ∆xi inches long, then the total length of the string is exactly n i=1 ∆xi . 10 / 14 Introduction to Integration
Integral Quick Check True or False. If a piece of string has been chopped into n small pieces and the ith piece is ∆xi inches long, then the total length of the string is exactly n i=1 ∆xi . 10 / 14 Introduction to Integration
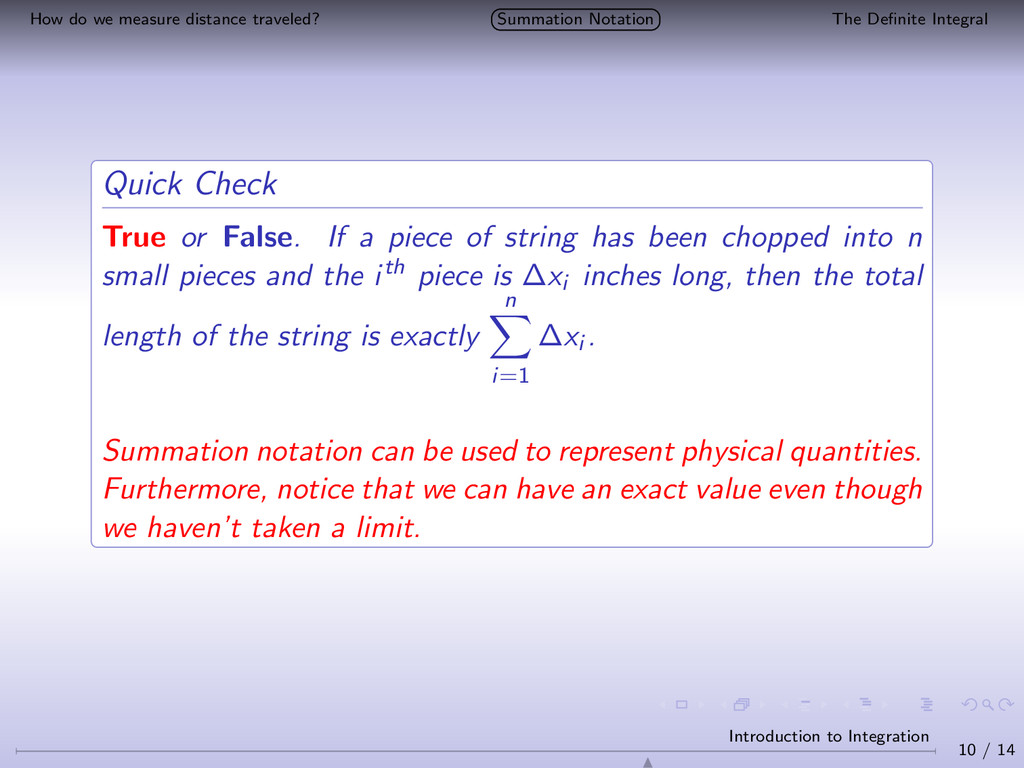
Integral Quick Check True or False. If a piece of string has been chopped into n small pieces and the ith piece is ∆xi inches long, then the total length of the string is exactly n i=1 ∆xi . Summation notation can be used to represent physical quantities. Furthermore, notice that we can have an exact value even though we haven’t taken a limit. 10 / 14 Introduction to Integration
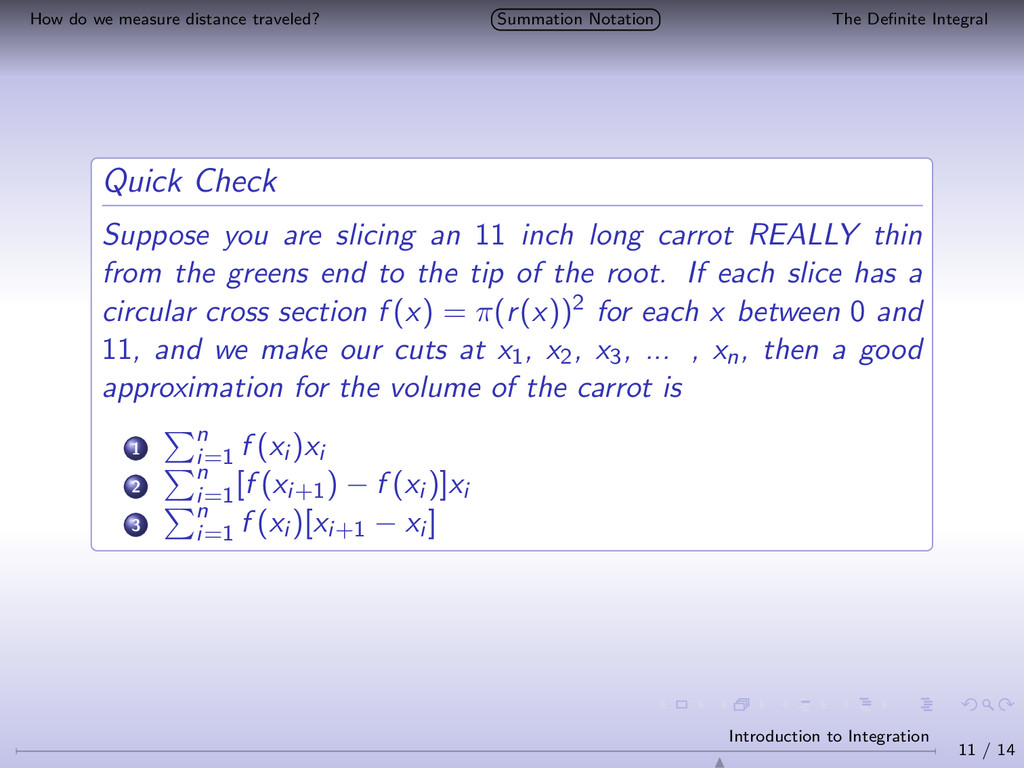
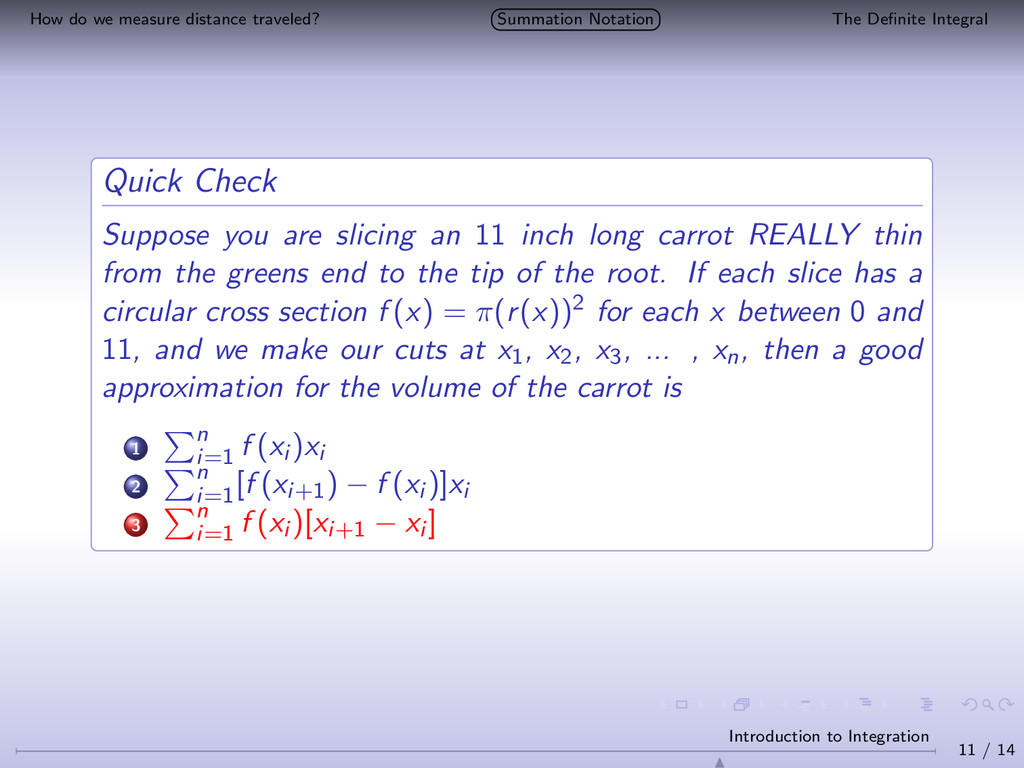
Integral Quick Check Suppose you are slicing an 11 inch long carrot REALLY thin from the greens end to the tip of the root. If each slice has a circular cross section f (x) = π(r(x))2 for each x between 0 and 11, and we make our cuts at x1, x2, x3, ... , xn, then a good approximation for the volume of the carrot is 1 n i=1 f (xi )xi 2 n i=1 [f (xi+1) − f (xi )]xi 3 n i=1 f (xi )[xi+1 − xi ] 11 / 14 Introduction to Integration
Integral Quick Check Suppose you are slicing an 11 inch long carrot REALLY thin from the greens end to the tip of the root. If each slice has a circular cross section f (x) = π(r(x))2 for each x between 0 and 11, and we make our cuts at x1, x2, x3, ... , xn, then a good approximation for the volume of the carrot is 1 n i=1 f (xi )xi 2 n i=1 [f (xi+1) − f (xi )]xi 3 n i=1 f (xi )[xi+1 − xi ] 11 / 14 Introduction to Integration
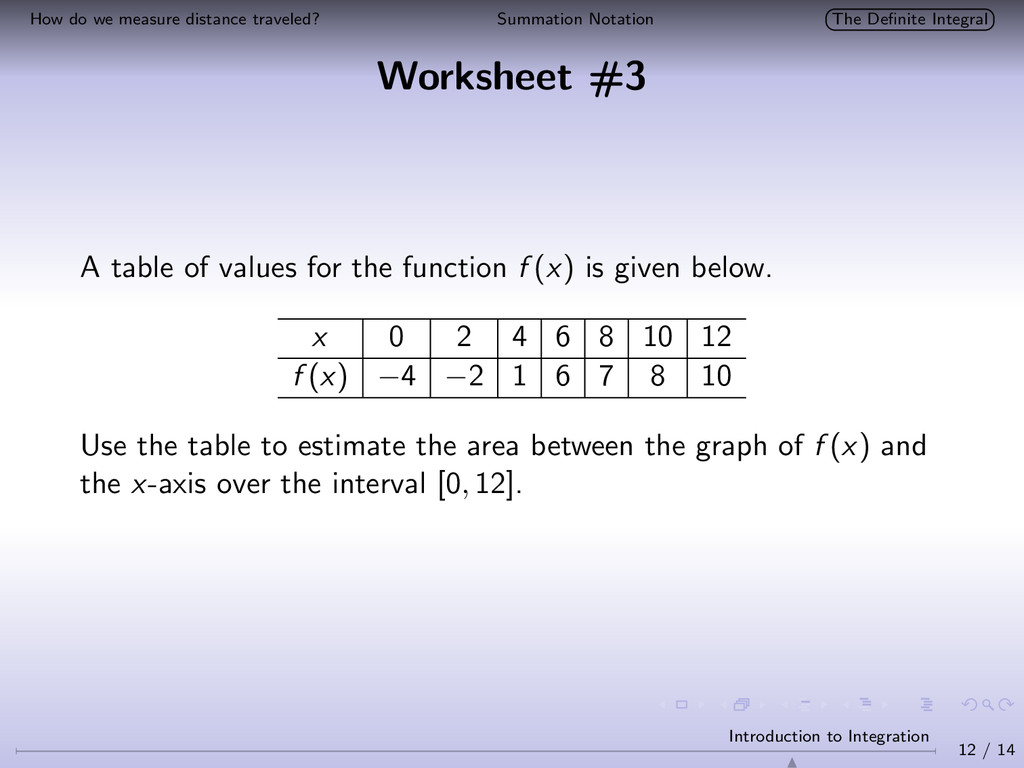
Integral Worksheet #3 A table of values for the function f (x) is given below. x 0 2 4 6 8 10 12 f (x) −4 −2 1 6 7 8 10 Use the table to estimate the area between the graph of f (x) and the x-axis over the interval [0, 12]. 12 / 14 Introduction to Integration
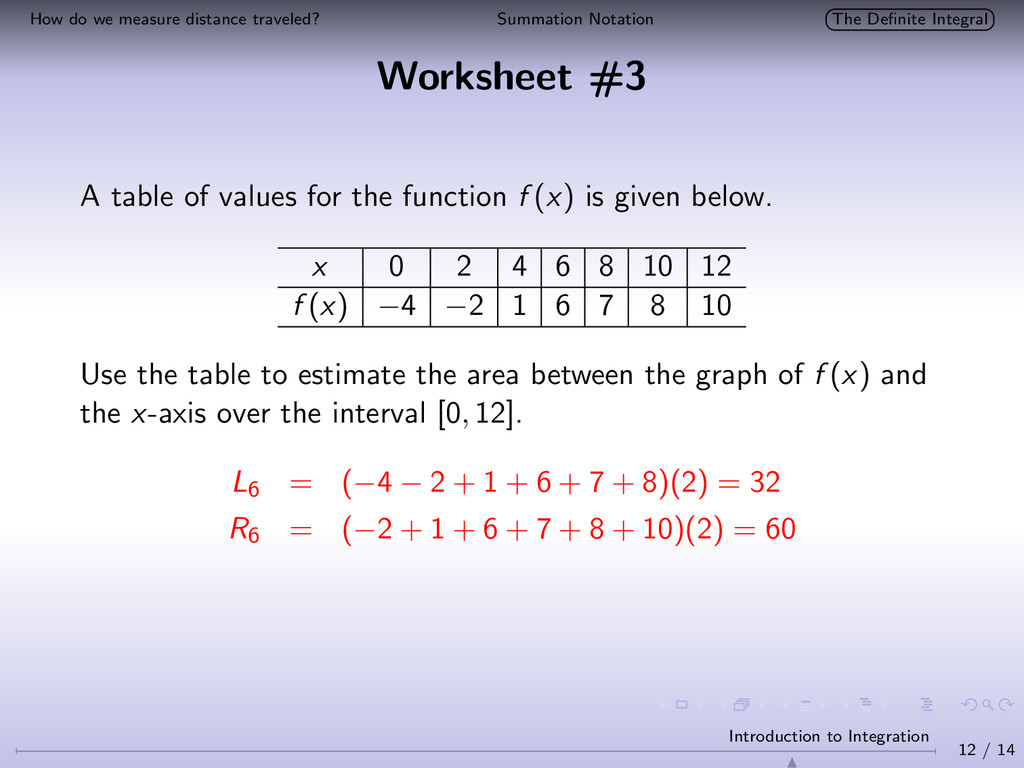
Integral Worksheet #3 A table of values for the function f (x) is given below. x 0 2 4 6 8 10 12 f (x) −4 −2 1 6 7 8 10 Use the table to estimate the area between the graph of f (x) and the x-axis over the interval [0, 12]. L6 = (−4 − 2 + 1 + 6 + 7 + 8)(2) = 32 R6 = (−2 + 1 + 6 + 7 + 8 + 10)(2) = 60 12 / 14 Introduction to Integration
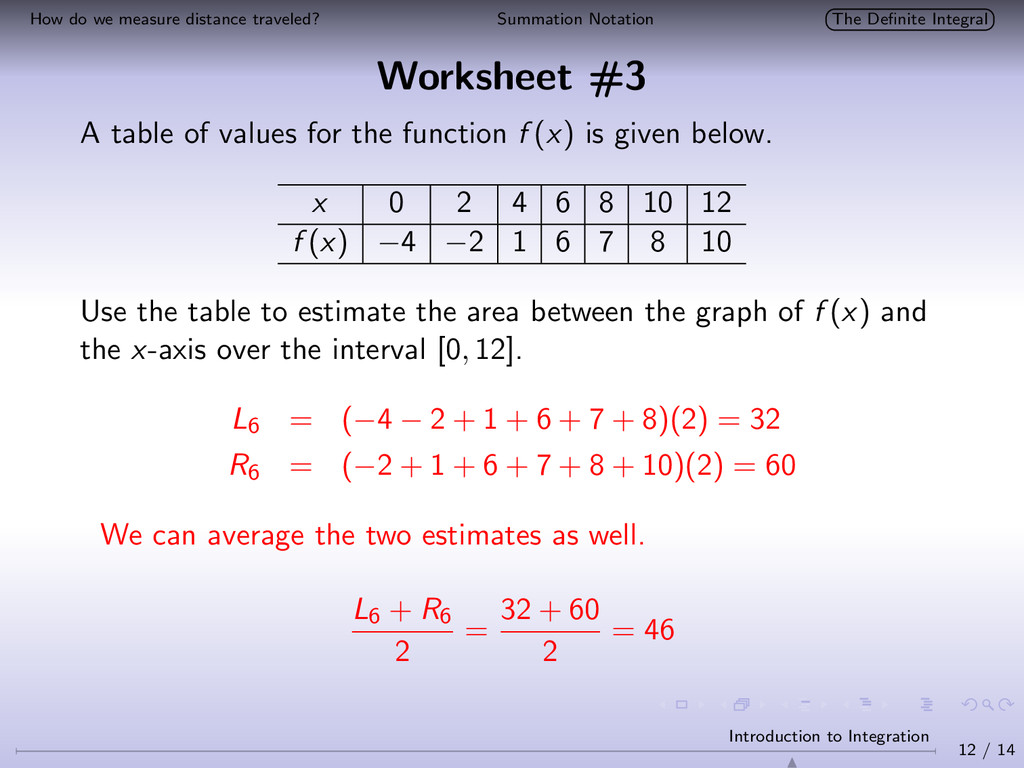
Integral Worksheet #3 A table of values for the function f (x) is given below. x 0 2 4 6 8 10 12 f (x) −4 −2 1 6 7 8 10 Use the table to estimate the area between the graph of f (x) and the x-axis over the interval [0, 12]. L6 = (−4 − 2 + 1 + 6 + 7 + 8)(2) = 32 R6 = (−2 + 1 + 6 + 7 + 8 + 10)(2) = 60 We can average the two estimates as well. L6 + R6 2 = 32 + 60 2 = 46 12 / 14 Introduction to Integration
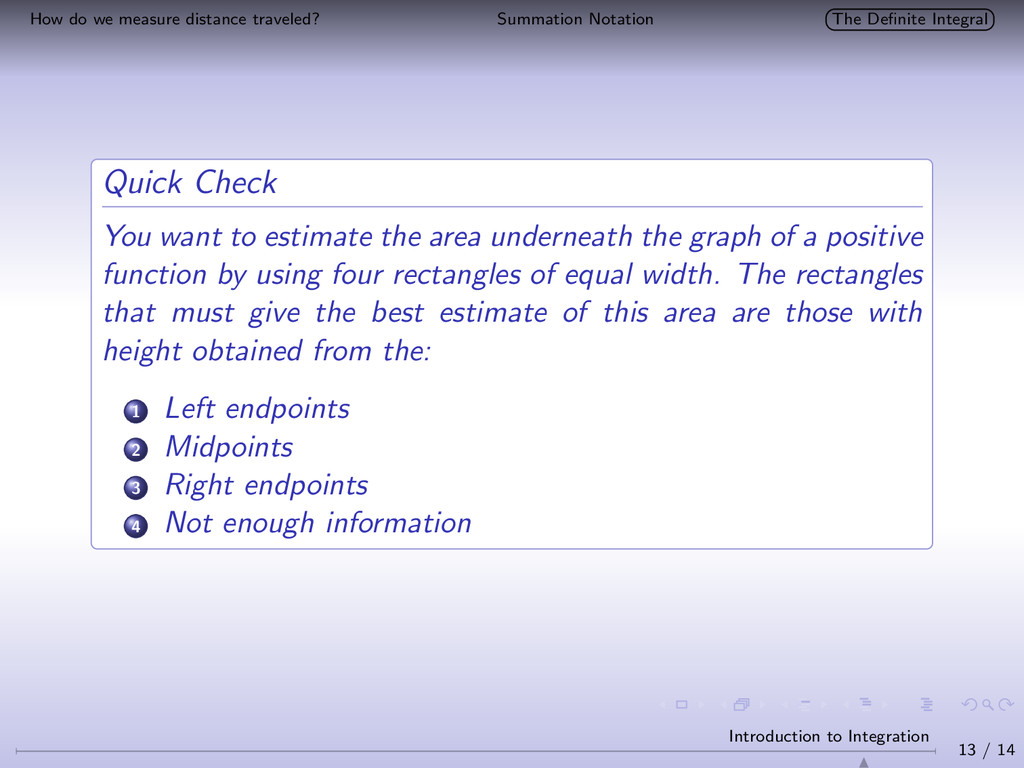
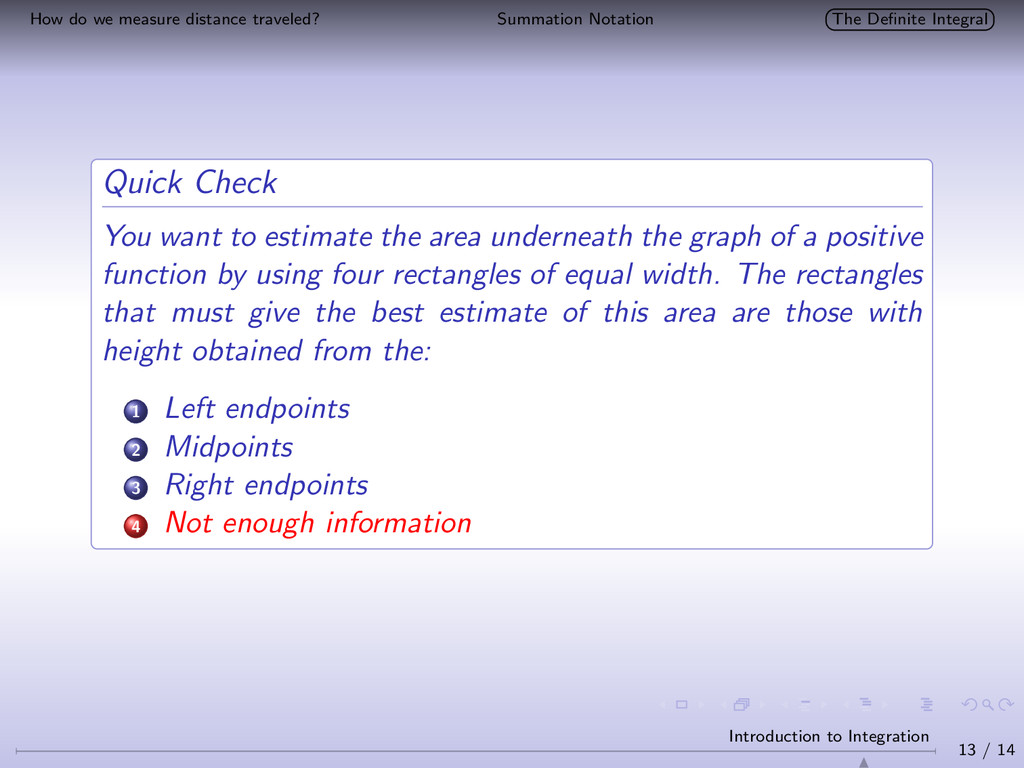
Integral Quick Check You want to estimate the area underneath the graph of a positive function by using four rectangles of equal width. The rectangles that must give the best estimate of this area are those with height obtained from the: 1 Left endpoints 2 Midpoints 3 Right endpoints 4 Not enough information 13 / 14 Introduction to Integration
Integral Quick Check You want to estimate the area underneath the graph of a positive function by using four rectangles of equal width. The rectangles that must give the best estimate of this area are those with height obtained from the: 1 Left endpoints 2 Midpoints 3 Right endpoints 4 Not enough information 13 / 14 Introduction to Integration
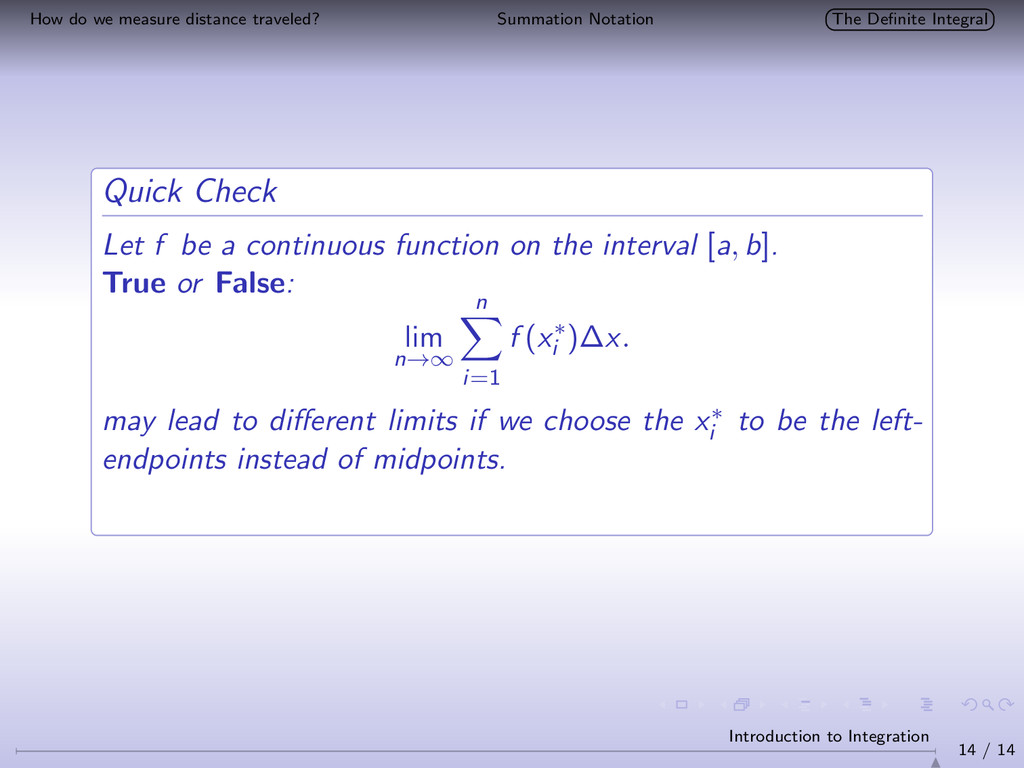
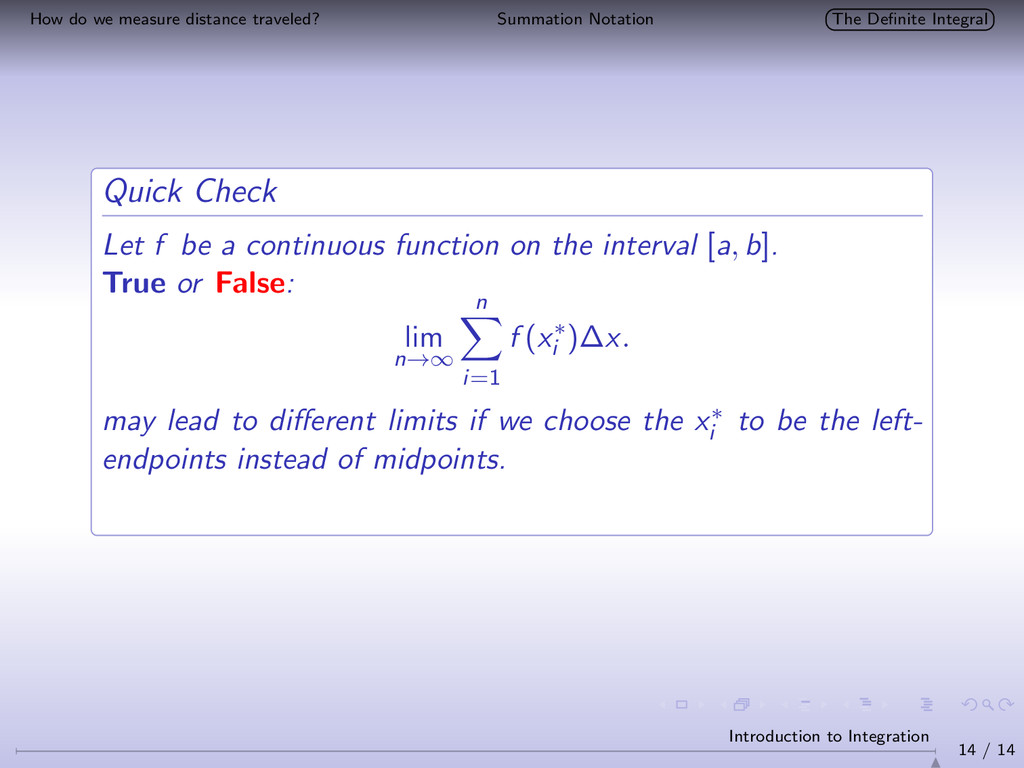
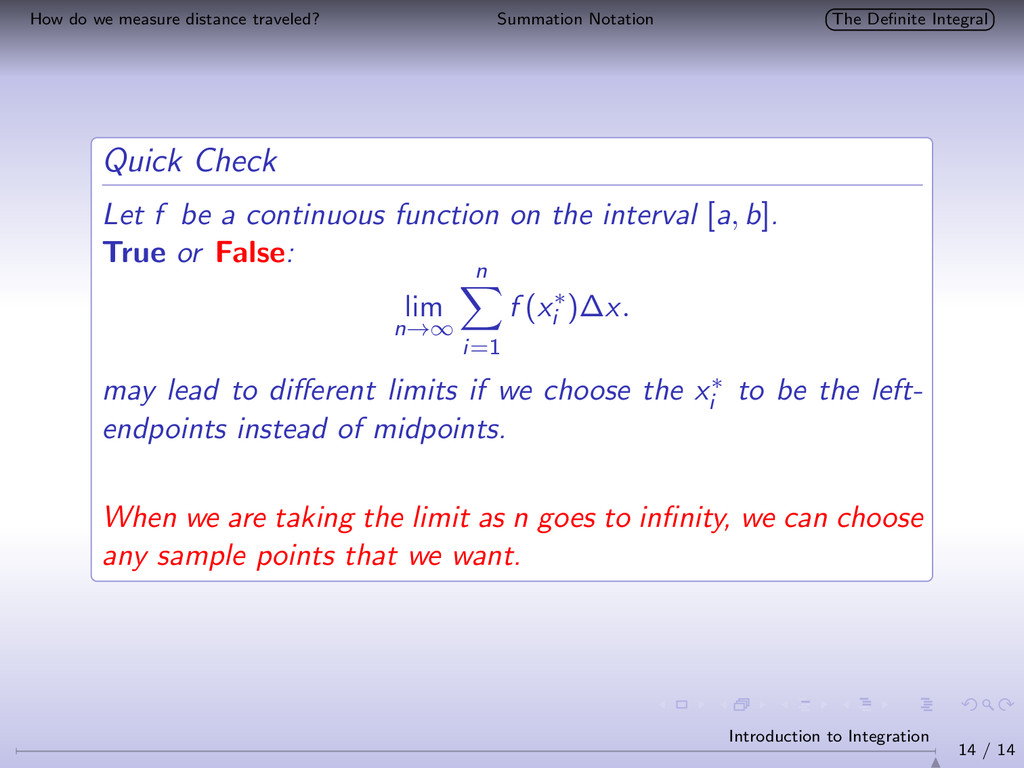
Integral Quick Check Let f be a continuous function on the interval [a, b]. True or False: lim n→∞ n i=1 f (x∗ i )∆x. may lead to different limits if we choose the x∗ i to be the left- endpoints instead of midpoints. 14 / 14 Introduction to Integration
Integral Quick Check Let f be a continuous function on the interval [a, b]. True or False: lim n→∞ n i=1 f (x∗ i )∆x. may lead to different limits if we choose the x∗ i to be the left- endpoints instead of midpoints. 14 / 14 Introduction to Integration
Integral Quick Check Let f be a continuous function on the interval [a, b]. True or False: lim n→∞ n i=1 f (x∗ i )∆x. may lead to different limits if we choose the x∗ i to be the left- endpoints instead of midpoints. When we are taking the limit as n goes to infinity, we can choose any sample points that we want. 14 / 14 Introduction to Integration


 katzmose
 signer
 akiraasano
 juanmartin2026
 matleenalaakso
 robintux
 yoshimura_datam
 spring_aki
 cbtlibrary
 yatabe
 suisan
 uchi8977
 irinanazarova
 codingconduct
 coloredviolet
 garrettdimon
 skipperchong
 jakevdp
 badams
 sstephenson
 uxyall
 aleyda
 smashingmag