Upgrade to Pro — share decks privately, control downloads, hide ads and more …

Monitoring the Golden Signals for Kubernetes

Kevin Crawley
December 17, 2019

Monitoring the Golden Signals for Kubernetes

Kubernetes is complex. This is further compounded by the complexity of microservice architecture and continuous delivery.

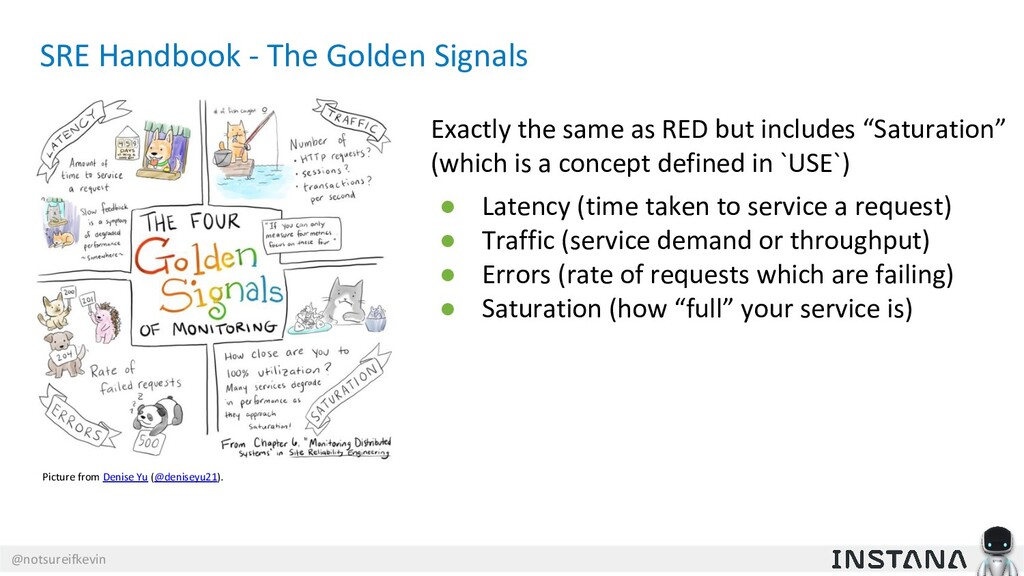
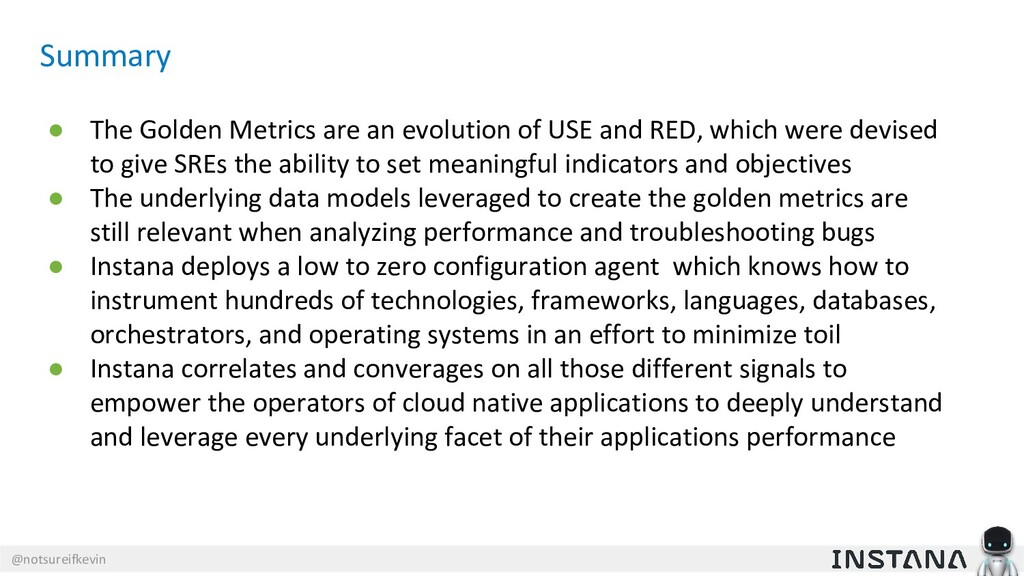
In this presentation, Kevin describes USE, RED, and the Golden Signals from the Google SRE handbook and how they relate to applications running in Kubernetes. By the end of this presentation, you will understand not only how your services are performing, but how your Kubernetes environment relates to every transaction and Golden Signal that occurs in your application.

Kevin Crawley

December 17, 2019
Tweet

More Decks by Kevin Crawley

Other Decks in Technology

Transcript

  1. @notsureifkevin Before we begin... This webinar is being recorded and

    will be shared with you later. Submit any questions throughout the webinar in the Q&A box and we will respond towards the end of the webinar. We are giving out 5 copies of Gene Kim’s book, The Unicorn Project. You must attend the entire webinar to qualify for a chance to win. Names will be randomly selected towards the end of the webinar.
  2. @notsureifkevin Monitoring the Golden Signals for Kubernetes • Describe the

    Golden Signals from the Google SRE handbook and how they relate to applications running in Kubernetes • Discuss how Distributed Tracing powers the technology that enables Instana to generate the Golden Signals for SREs and application developers in real time • Uncover how combining metrics, traces, and logs empower the operators of these complex systems to solve performance and reliability issues on the spot By the end of this webinar, you will understand not only how your services are performing, but how your Kubernetes environment relates to every transaction and Golden Signal that occurs in your application.
  3. @notsureifkevin Topics of Discussion • Highlight on the Golden Signals,

    USE method, and RED method of monitoring for Kubernetes workloads • How Instana collects, correlates, and aggregates the telemetry which helps you understand your applications health and performance • Product Demo and Discussion
  4. @notsureifkevin USE method of instrumentation • Created in 2012 by

    Brendan Gregg as an approach to monitoring resources in an IT environment • USE stands for Utilization, Saturation, and Errors • Resources are defined loosely around the concept of instrumentation of infrastructure and hardware • Includes a “Rosetta Stone” guide for collecting performance metrics http://www.brendangregg.com/usemethod.html http://www.brendangregg.com/USEmethod/use-rosetta.html
  5. @notsureifkevin For every Resource check Utilization, Saturation and Errors •

    Resource - all physical service functional components (CPUs, disks, busses, memory, etc) • Utilization - the average time that the resource was busy servicing work • Saturation - the degree to which the resource has extra work which it can't service, often queued • Errors - the count of error events USE is an effective means to monitor the underlying resources which operate managed and custom business applications.
  6. @notsureifkevin What is the USE for each resource type? •

    CPU ◦ Utilization - per cpu/core, load average ◦ Saturation - run-queue length, steal, wait ◦ Errors - cpu cache ECC, faults • Memory ◦ Utilization - available free mem (system), cached ◦ Saturation - anon paging, swapping, scanning • Network ◦ Utilization - RX/TX / max ◦ Saturation - NIC/OS events, dropped, overruns, are these errors? • Disk ◦ Utilization - busy %, free / used space ◦ Saturation - wait queue length
  7. @notsureifkevin What is the Rosetta Stone • Discovered in 1799

    and eventually helped translators decipher ancient Egyptian Hieroglyphics • In 2012, used as an metaphor for gathering IT performance metrics
  8. @notsureifkevin The “USE” method - What are the challenges? •

    How do we monitor all of these signals and correlate them to our organization's business transactions and logs • For every resource type and runtime environment there are a multitude of telemetry options • Before containers and highly distributed multi-cloud systems this was approached with a few probes and some health check scripts • Most organizations still lack an understanding of how these metrics impact any given service level objectives
  9. @notsureifkevin The RED method: Microservices-Oriented Monitoring The RED method, circa

    2015, by Tom Wilkie • RED focuses on the consistent terminology Rate, Errors, Duration whose goals are to be environment/stack agnostic • A valid approach is to incorporate both USE and RED (which turns out to be the Golden Signals) https://grafana.com/blog/2018/08/02/the-red-method-how-to-instrument-your-services/
  10. @notsureifkevin RED helps us understand customer facing impact For every

    service / endpoint your monitoring solution should track: • Rate - how “busy” my service is (throughput) ◦ Measured in QPS/QPM • Error - how “fail” my service is (error rate) ◦ Includes 5xx errors, db errors, queue errors • Duration - how “slow” my service is (latency) ◦ Mean Avg ◦ Percentiles
  11. @notsureifkevin SRE Handbook - The Golden Signals Exactly the same

    as RED but includes “Saturation” (which is a concept defined in `USE`) • Latency (time taken to service a request) • Traffic (service demand or throughput) • Errors (rate of requests which are failing) • Saturation (how “full” your service is) Picture from Denise Yu (@deniseyu21).
  12. @notsureifkevin Where do we get this data? • Load Balancers

    (AWS ELB/ALB, Nginx, HAproxy, Traefik) • Web Servers (Apache, Nginx) • App Servers (PHP, FPM, Java, Ruby, Python, .NET, Node, Go) • Database Servers (MySQL, Oracle, MSSQL, Redis, Cassandra, etc) • Queue/Messaging (SQS, RabbitMQ, Kafka) • Linux / Windows (Underlying infrastructure)
  13. @notsureifkevin How do we collect event data? • Infrastructure and

    database components must be configured to emit relevant telemetry (USE) ◦ Ideally collected via well-documented and structured APIs ◦ Reference the “Rosetta Stone” for everything else • Application and proxy services must be configured to generate and emit relevant telemetry (both RED and USE) ◦ USE collected via metric libraries/frameworks (JMX, Dropwizard, statsd) ◦ RED collected via distributed trace aggregates • Our applications must be configured programmatically to emit trace telemetry
  14. @notsureifkevin How Distributed Tracing Works (it’s simple) • Every request

    (HTTP/REST, DB, Message, Queue) has a custom header injected into it which is intercepted and processed by Instana • This is visualized with a GANTT chart to show the hierarchical structure and timing of every transaction which occurred after the initial trace was created Google Technical Report dapper-2010-1, April 2010, p. 3, fig. 2 - https://ai.google/research/pubs/pub36356
  15. @notsureifkevin Demo Time • How Instana collects information about K8S

    deployments and events - then correlates the applications performance to the “Golden Metrics” • Journey through a request from the front-end (javascript) client request all the way through the API, message queue, and to the backend (db) system and see every K8S component Pod, Container, and service the request touched • How can “saturation” be monitored and understood within the context of both Kubernetes and specific components in our application • Understand how Instana correlates everything so it’s easy to understand the context of any given aggregate or metric in your system
  16. @notsureifkevin Correlation drives context which drives understanding • No longer

    treating services like Schrödinger's cat • Much more context around events and transactions • Interactive dashboards and metrics generated by aggregated request-scoped events https://peter.bourgon.org/blog/2017/02/21/metrics-tracing-and-logging.html
  17. @notsureifkevin Summary • The Golden Metrics are an evolution of

    USE and RED, which were devised to give SREs the ability to set meaningful indicators and objectives • The underlying data models leveraged to create the golden metrics are still relevant when analyzing performance and troubleshooting bugs • Instana deploys a low to zero configuration agent which knows how to instrument hundreds of technologies, frameworks, languages, databases, orchestrators, and operating systems in an effort to minimize toil • Instana correlates and converages on all those different signals to empower the operators of cloud native applications to deeply understand and leverage every underlying facet of their applications performance
  18. @notsureifkevin Resources Use Method -- http://www.brendangregg.com/usemethod.html Use Method (Rosetta Stone)

    -- http://www.brendangregg.com/USEmethod/use-rosetta.html Red Method -- https://grafana.com/blog/2018/08/02/the-red-method-how-to-instrument-your-services/ SRE Handbook (Chapter 6) -- https://landing.google.com/sre/sre-book/chapters/monitoring-distributed-systems/ Google Dapper Tech Report -- https://ai.google/research/pubs/pub36356 Metrics, Tracing and Logging (p. bourgon) -- https://peter.bourgon.org/blog/2017/02/21/metrics-tracing-and-logging.html Robot Shop (s. waterworth) -- https://github.com/instana/robot-shop