Upgrade to Pro
— share decks privately, control downloads, hide ads and more …
Speaker Deck
Features
Speaker Deck
PRO
Sign in
Sign up for free
Search
Search
Optimizing & Profiling UI Performance
Search
Sponsored
·
Ship Features Fearlessly
Turn features on and off without deploys. Used by thousands of Ruby developers.
→
Brenda Cook
July 29, 2016
Programming
13k
6
Share
Embed
Copy iframe code
Copy JS code
Copy link
Start on current slide
Optimizing & Profiling UI Performance
Presented at 360|AnDev 2016
Brenda Cook
July 29, 2016
More Decks by Brenda Cook
See All by Brenda Cook
Fragments: Why? How? and What For?
kenodoggy
3
3.7k
Other Decks in Programming
See All in Programming
これからAgentCoreを触る方へ トレンドはGatewayです
har1101
6
490
Haskell/Servantを通してWebミドルウェアを捉え直す
pizzacat83
1
580
鹿野さんに聞く!『TypeScriptコードレシピ集』で磨く実践力
tonkotsuboy_com
4
1.1k
自作OSでスライド発表する
uyuki234
1
3.8k
「正の参照」と 「負の導出」で組む ハーネスエンジニアリング
cottpan
1
140
なぜ型を書くのか? TSKaigi2026で改めて考える #tskaigi_smarthr
kajitack
0
370
act2-costs.pdf
sumedhbala
0
110
Generative UI & AI-Assistants for Your Angular Solutions
manfredsteyer
PRO
1
180
【やさしく解説 設計編・中級 #4】ルールの寿命と、システムの年輪
panda728
PRO
2
130
Honoでのサプライチェーン侵害対策 〜 3つのライブラリに学ぶ
yusukebe
7
1.9k
えっ!!コードを読まずに開発を!?
hananouchi
0
210
琵琶湖の水は止められてもNet--HTTPのリトライは止められない / You might be able to stop the water flow of Lake Biwa but you can't stop Net::HTTP retries
luccafort
PRO
0
380
Featured
See All Featured
Fantastic passwords and where to find them - at NoRuKo
philnash
52
3.8k
How to Talk to Developers About Accessibility
jct
2
370
SEO Brein meetup: CTRL+C is not how to scale international SEO
lindahogenes
1
2.8k
Understanding Cognitive Biases in Performance Measurement
bluesmoon
32
3k
JAMstack: Web Apps at Ludicrous Speed - All Things Open 2022
reverentgeek
1
490
The Curious Case for Waylosing
cassininazir
1
430
Designing for humans not robots
tammielis
254
26k
The Web Performance Landscape in 2024 [PerfNow 2024]
tammyeverts
12
1.2k
The Illustrated Children's Guide to Kubernetes
chrisshort
51
53k
The Director’s Chair: Orchestrating AI for Truly Effective Learning
tmiket
1
220
Utilizing Notion as your number one productivity tool
mfonobong
4
420
Let's Do A Bunch of Simple Stuff to Make Websites Faster
chriscoyier
508
140k
Transcript
Optimizing & Profiling UI Performance
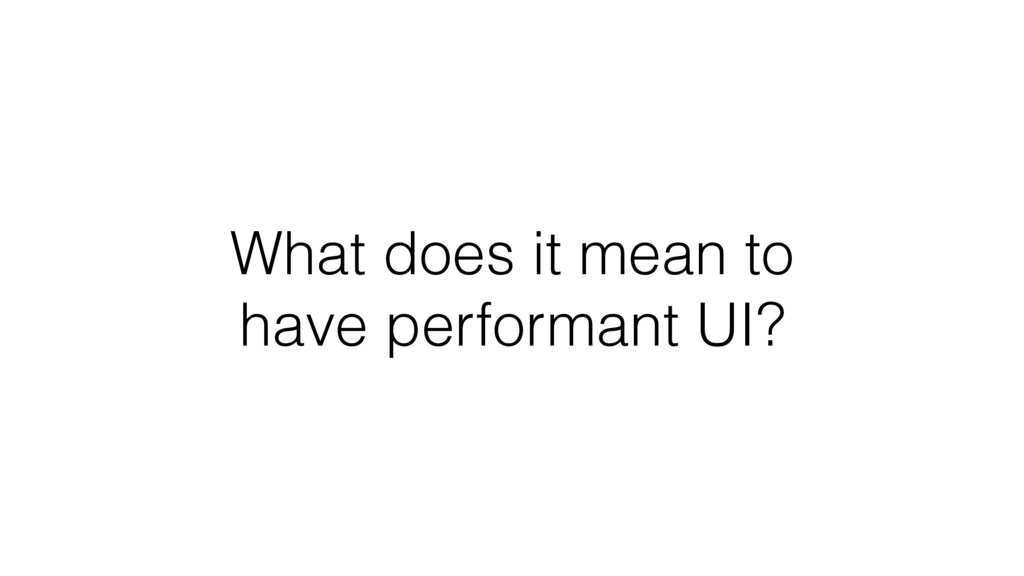
What does it mean to have performant UI?
Jank
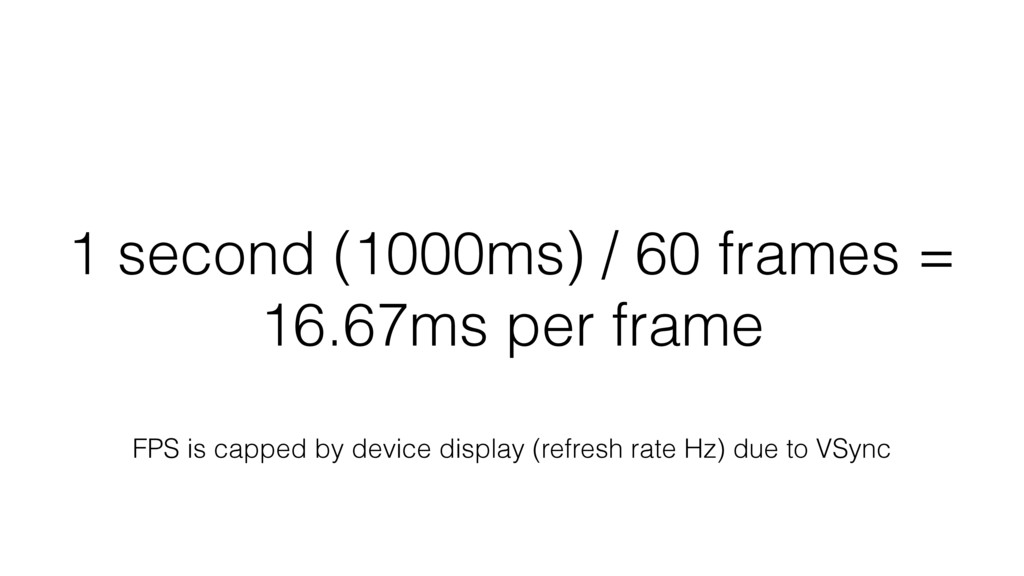
Frame Rate (FPS)
Refresh Rate (Hz)
1 second (1000ms) / 60 frames = 16.67ms per frame
FPS is capped by device display (refresh rate Hz) due to VSync
VSync
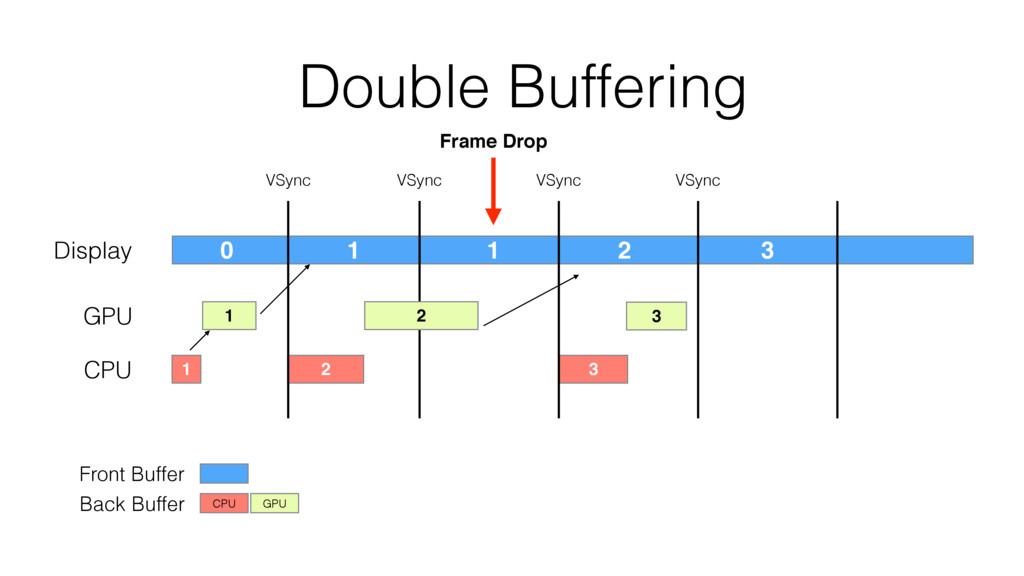
3 Double Buffering 0 1 2 1 2 CPU GPU
Display 1 1 Front Buffer CPU GPU Back Buffer 2 3 3 VSync VSync VSync VSync Frame Drop
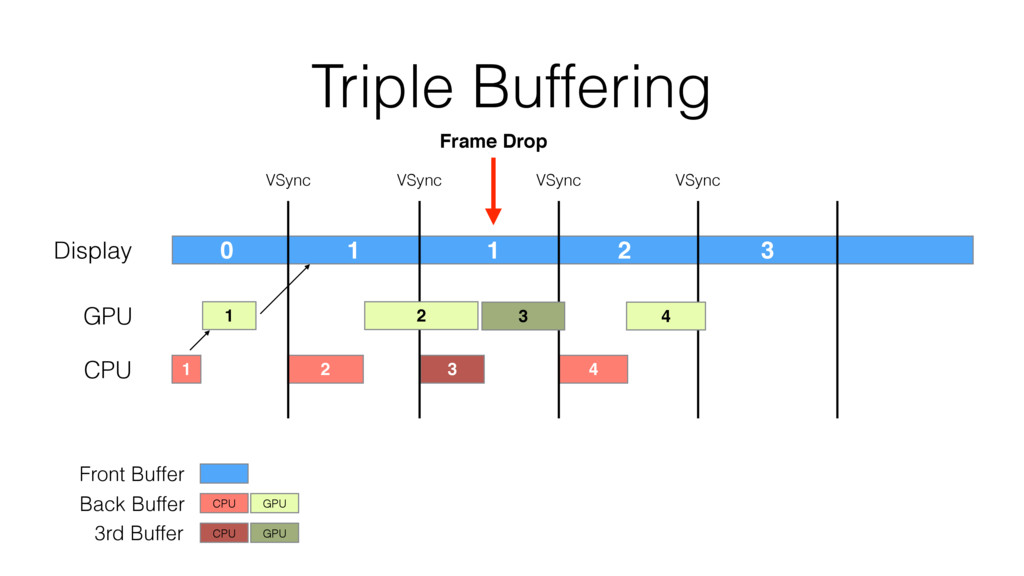
4 3 Triple Buffering 0 1 2 3 1 2
CPU GPU Display 1 1 Front Buffer CPU GPU Back Buffer CPU GPU 3rd Buffer 2 3 4 VSync VSync VSync VSync Frame Drop
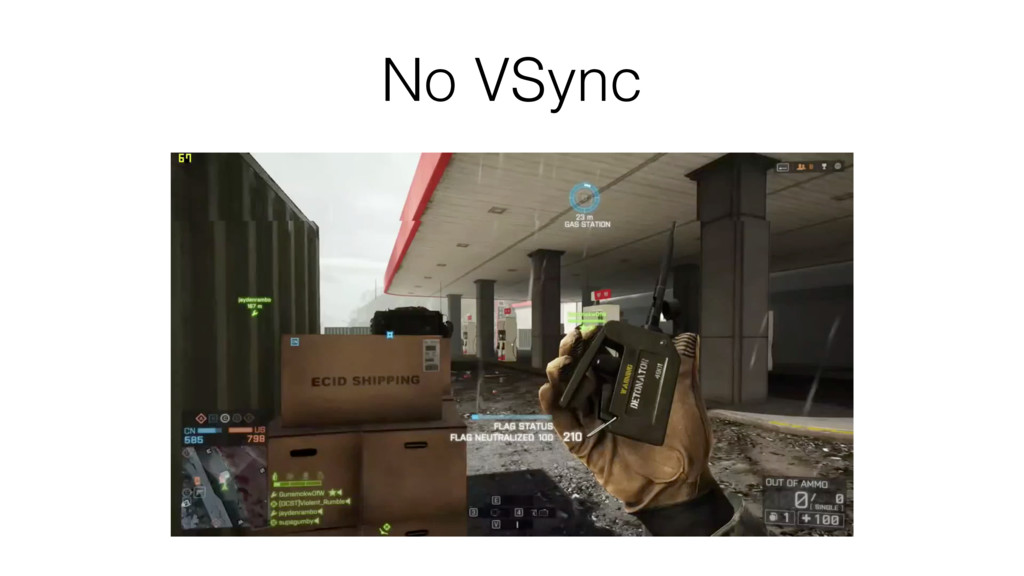
No VSync
Optimize
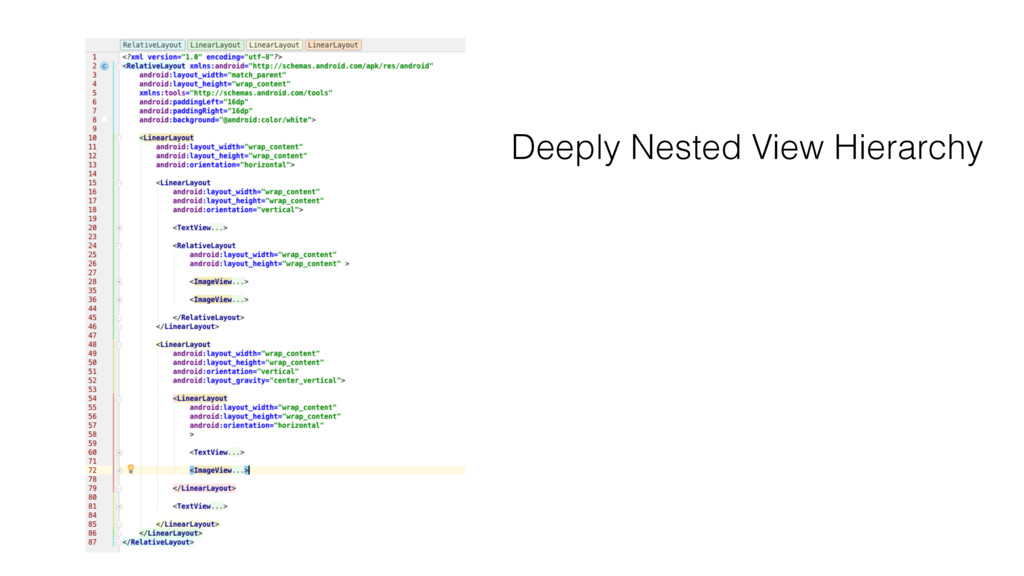
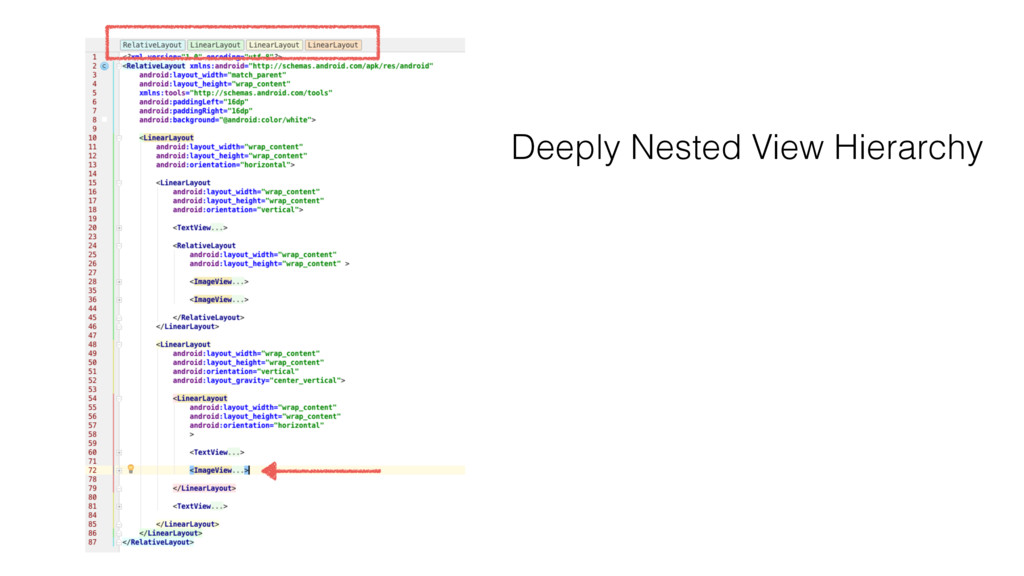
Flatten View Hierarchy
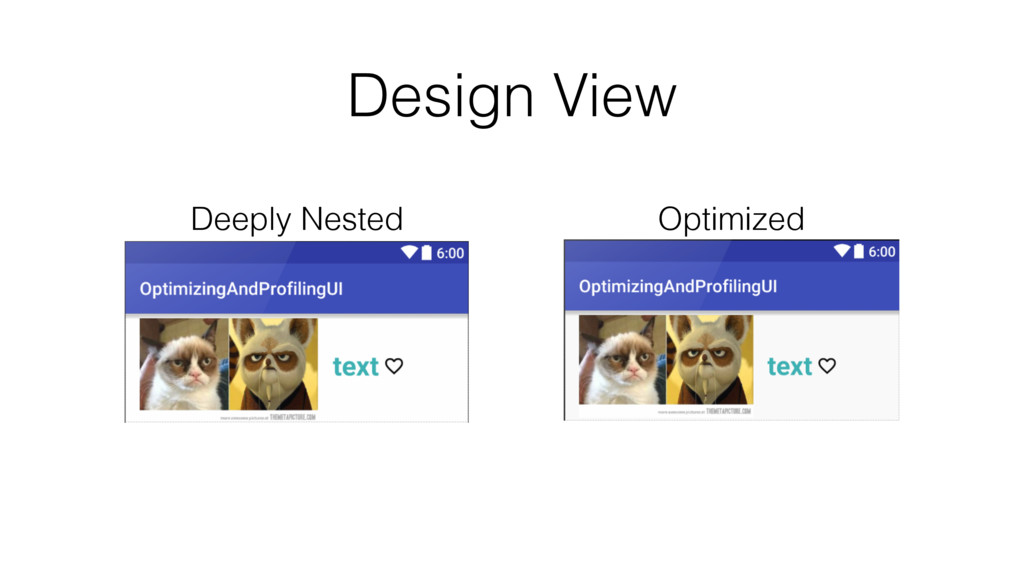
Deeply Nested View Hierarchy
Deeply Nested View Hierarchy
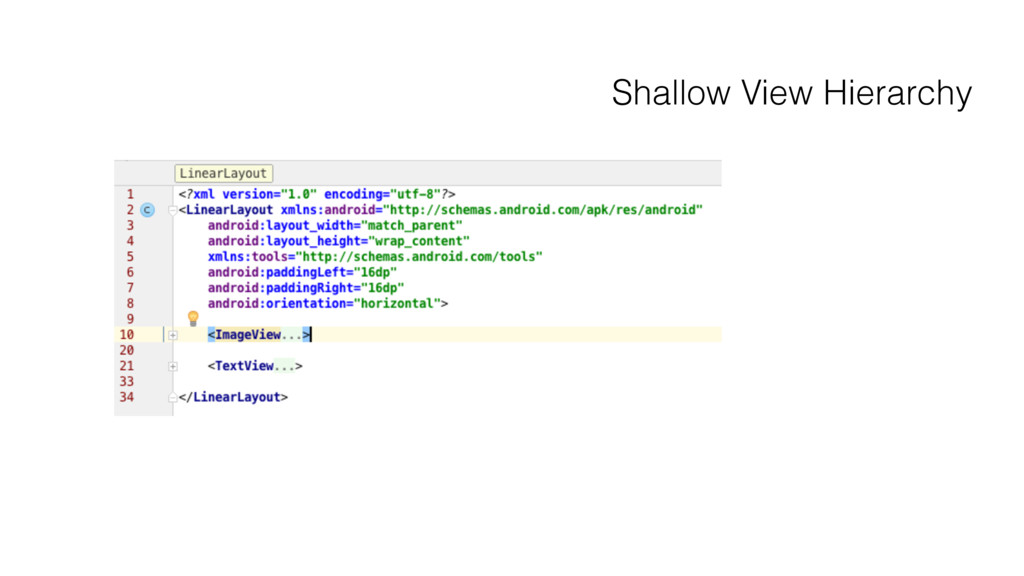
Shallow View Hierarchy
Deeply Nested Design View Optimized
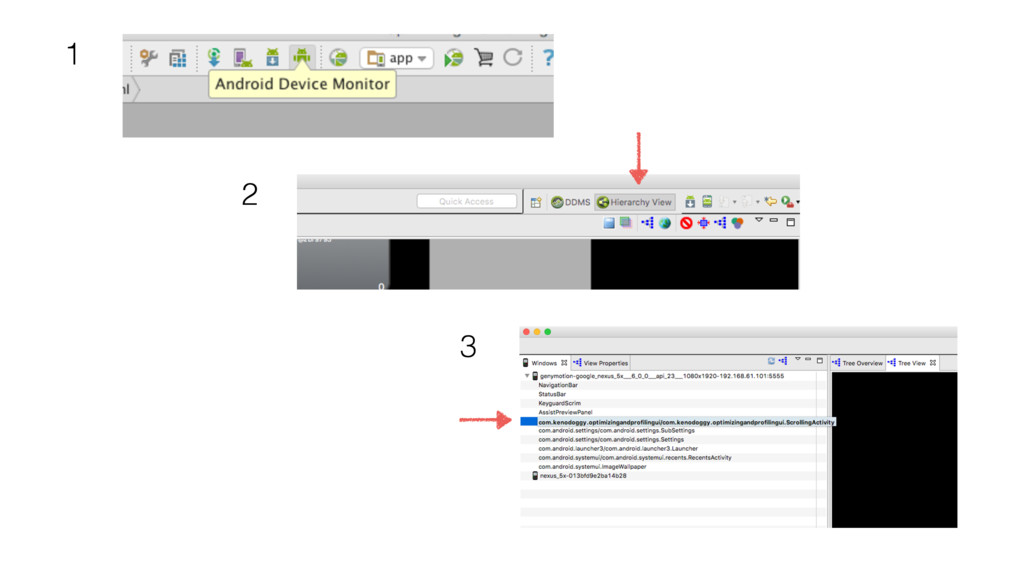
Hierarchy Viewer
3 2 1
[show deeply nested hierarchy]
[show shallow hierarchy]
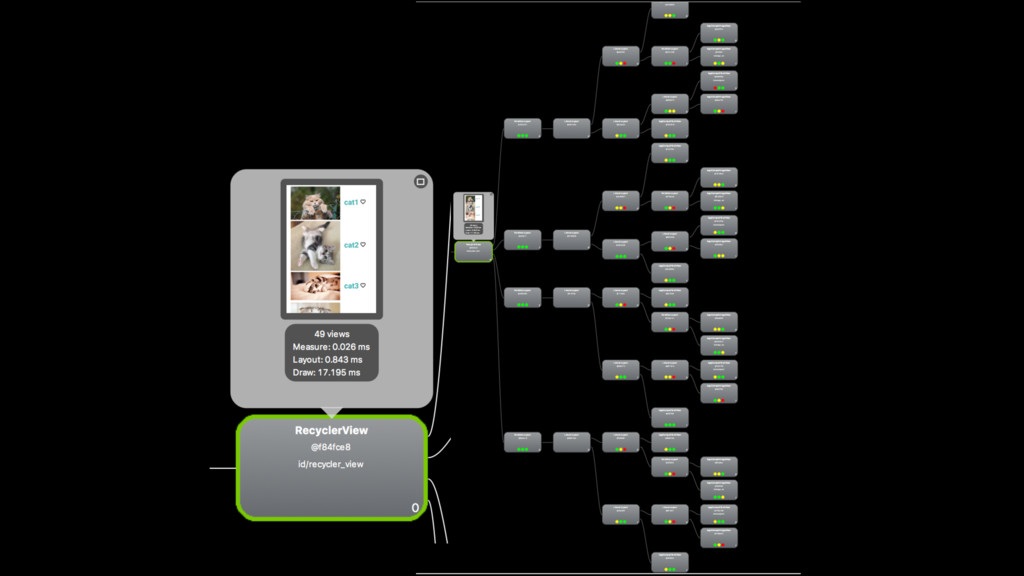
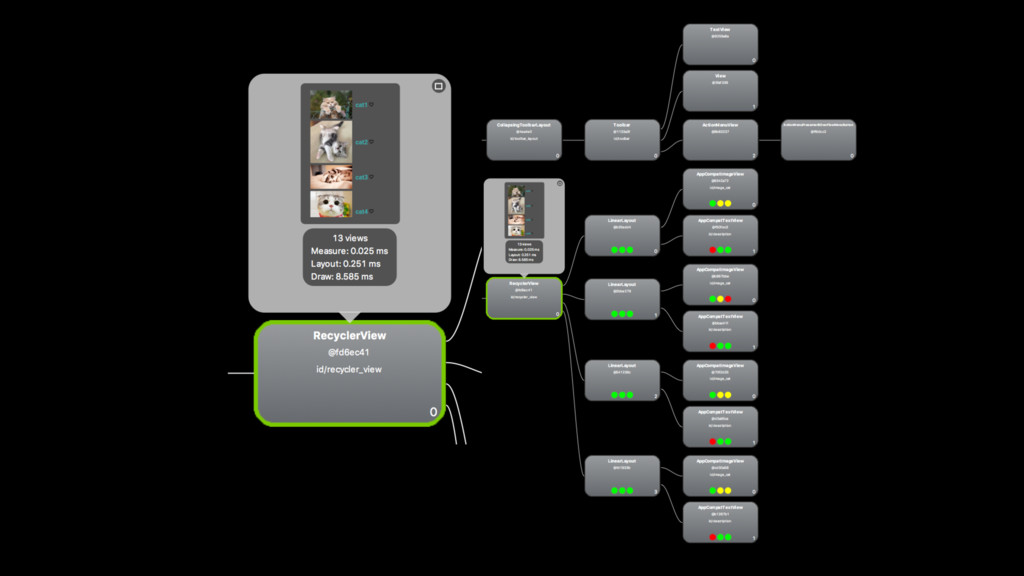
[show image of obtaining measure, layout and draw time]
None
None
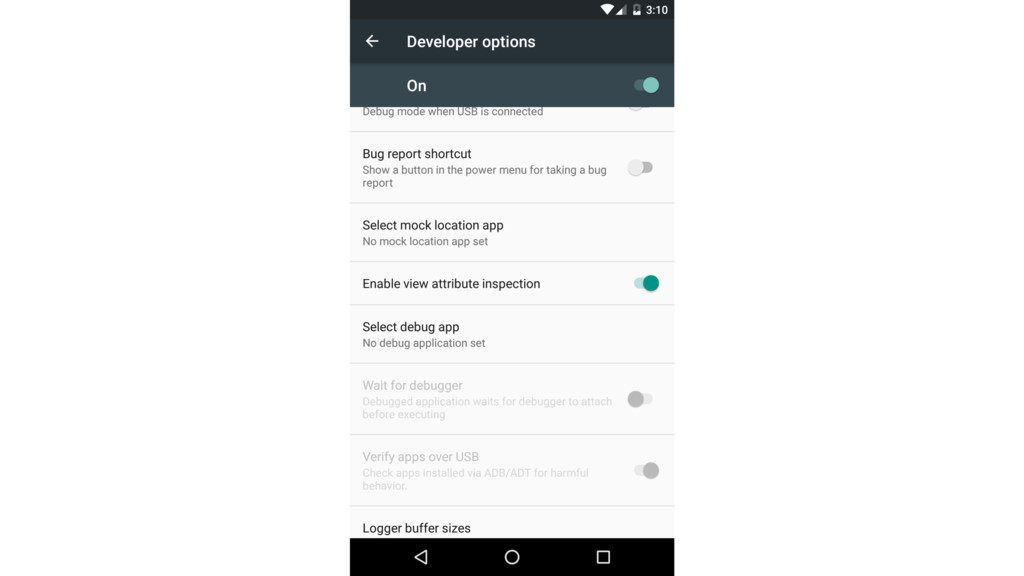
Know your Views
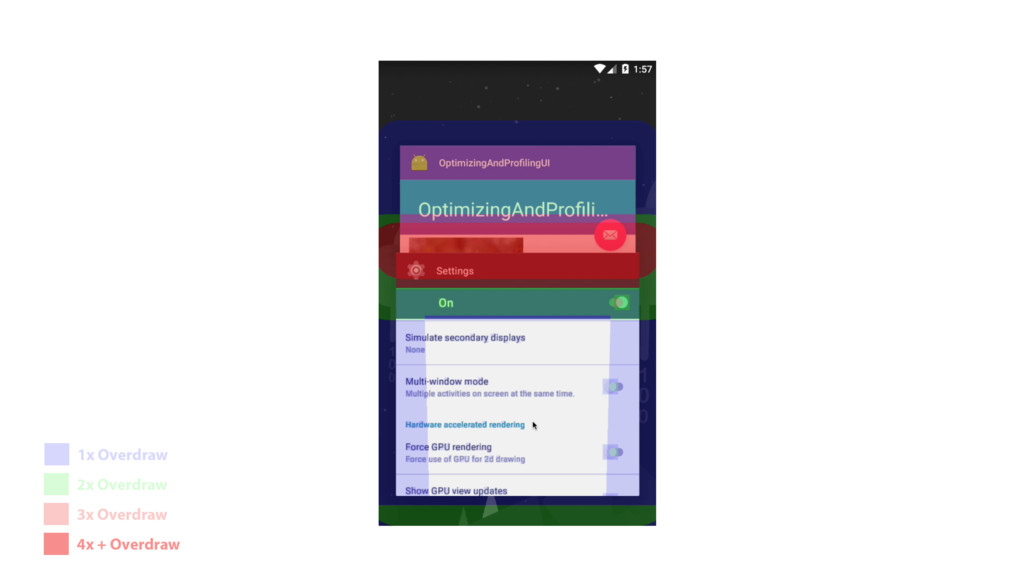
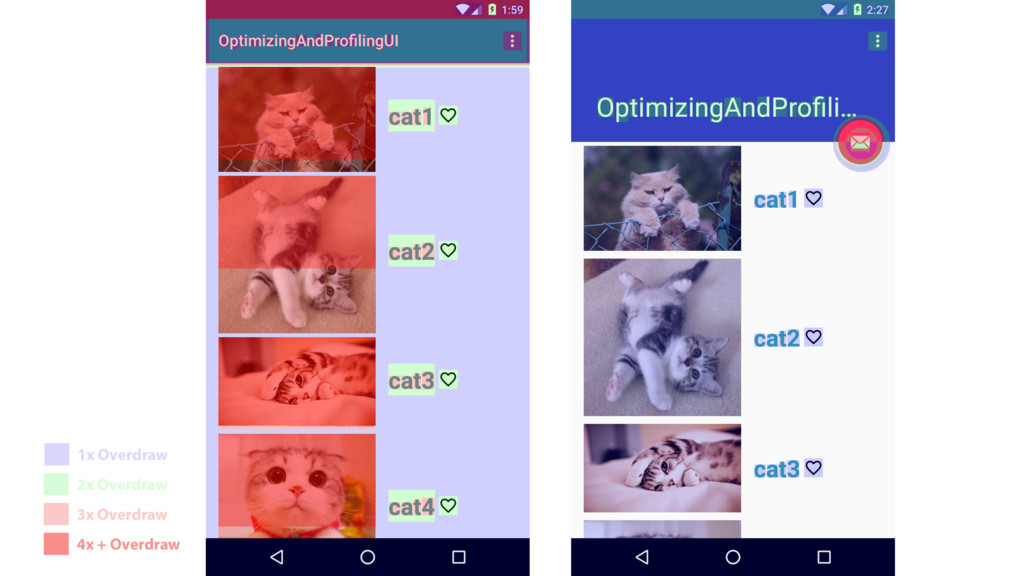
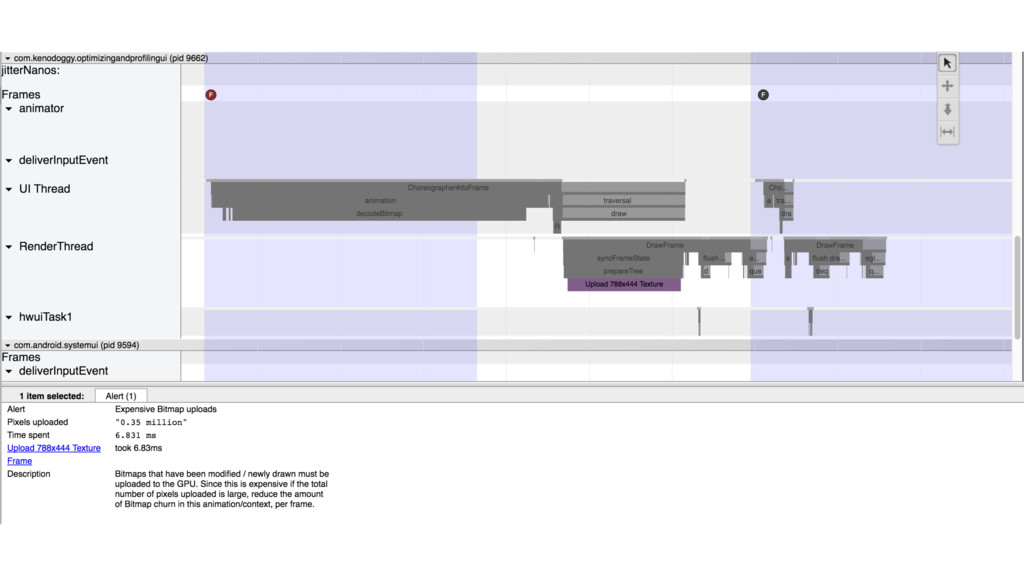
GPU Overdraw
None
None
None
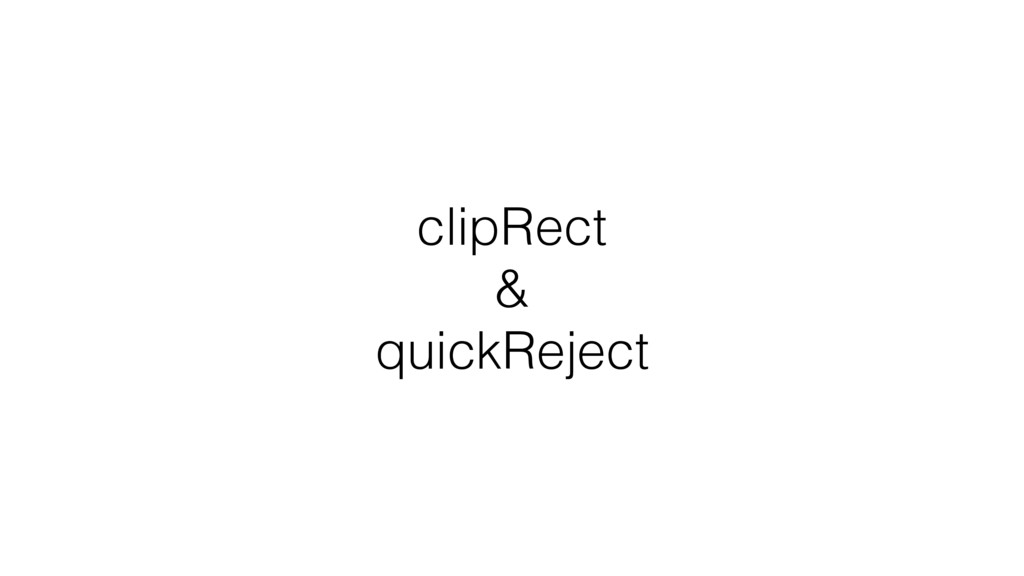
clipRect & quickReject
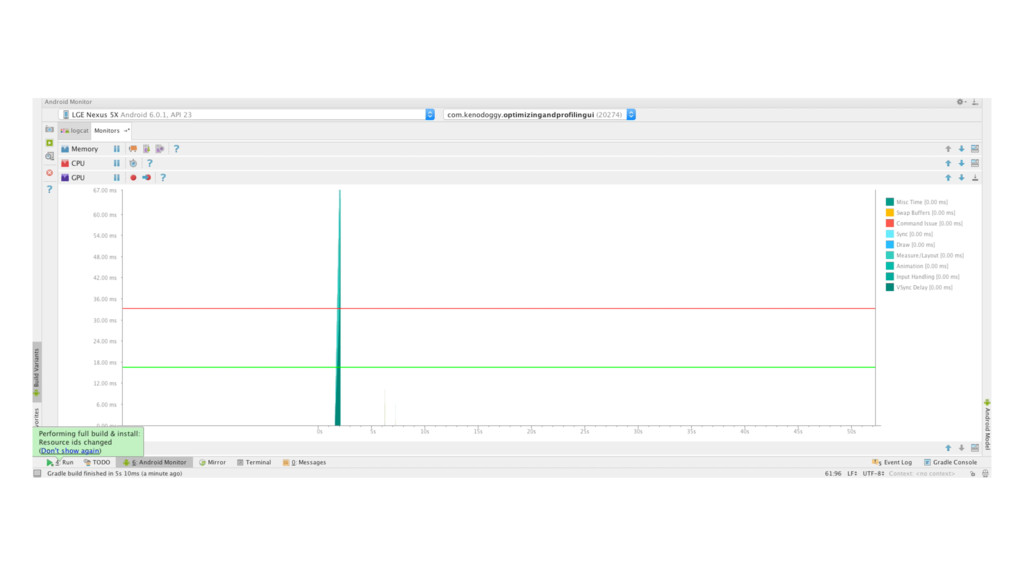
Performance Profiling
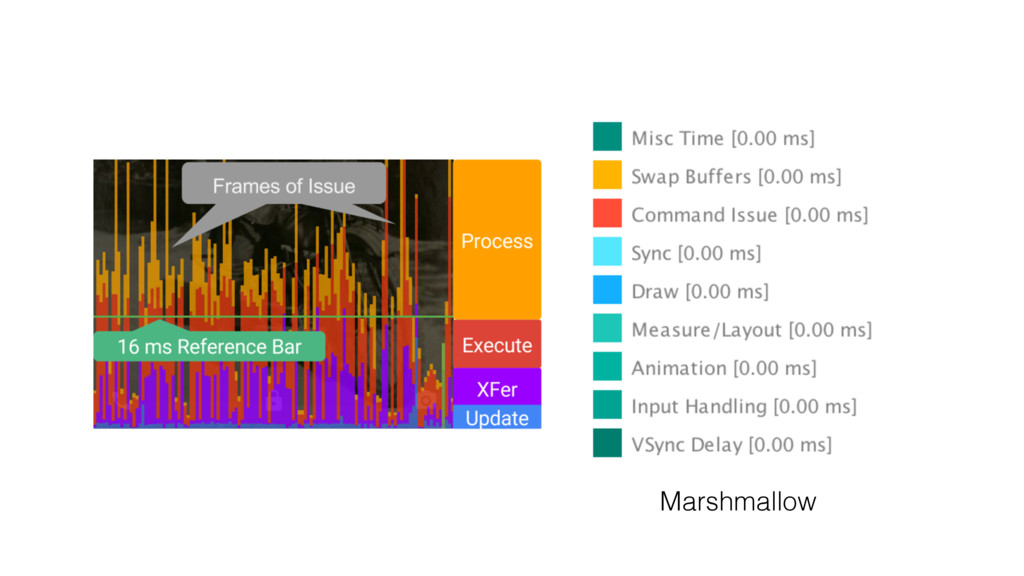
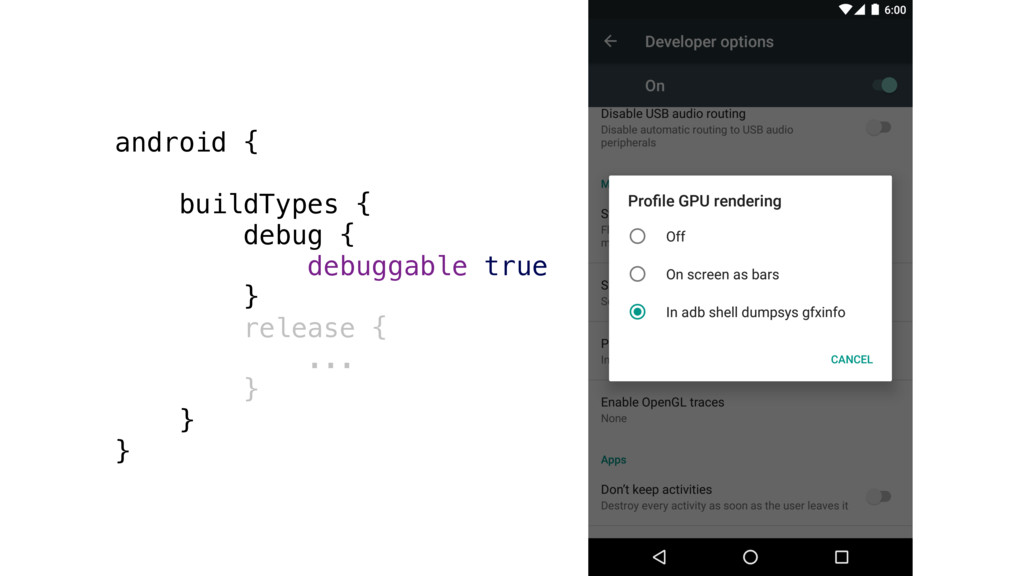
Profile GPU Rendering
None
Marshmallow
None
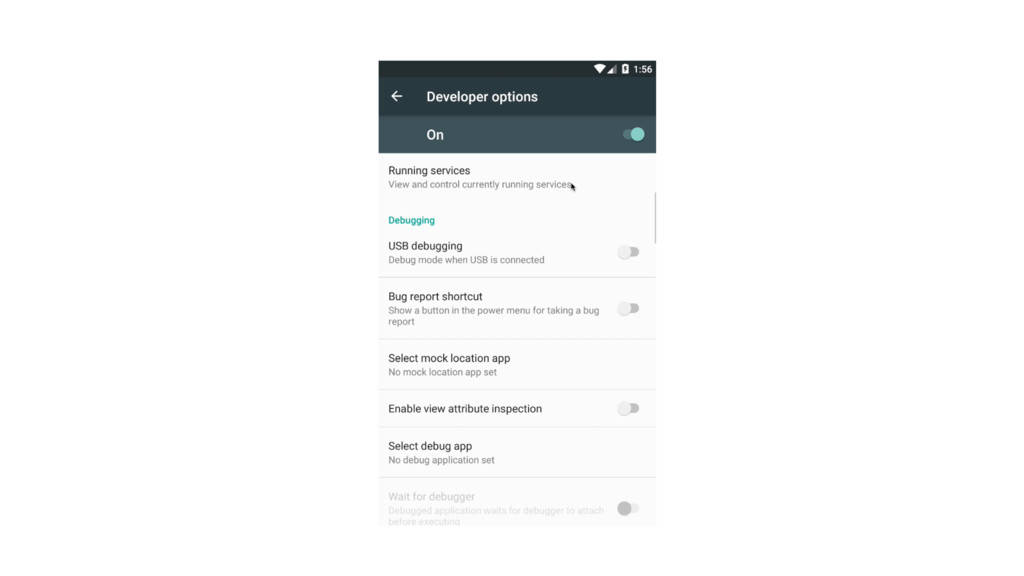
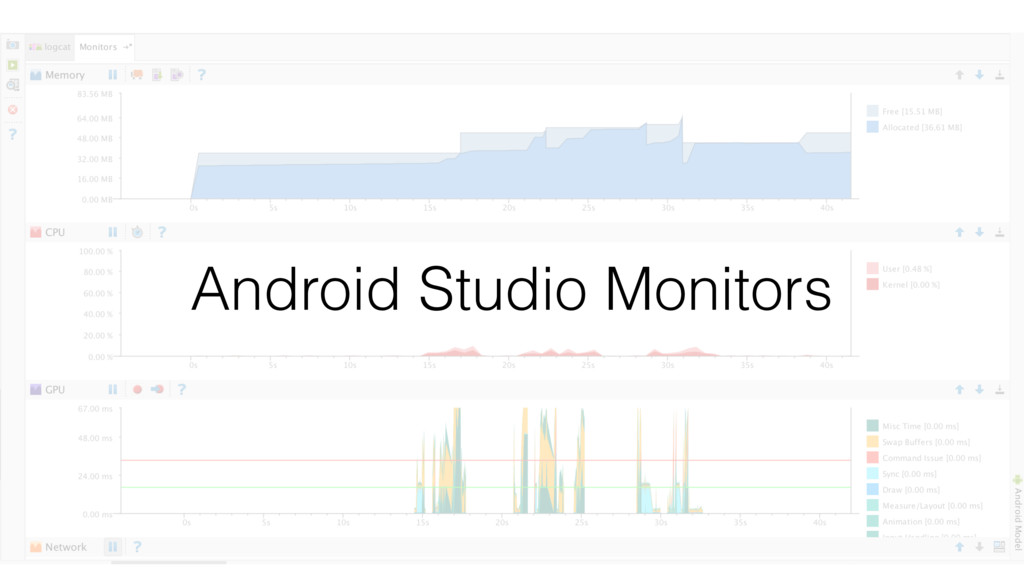
Android Studio Monitors
None
android { buildTypes { debug { debuggable true }
release { ... } } }
None
None
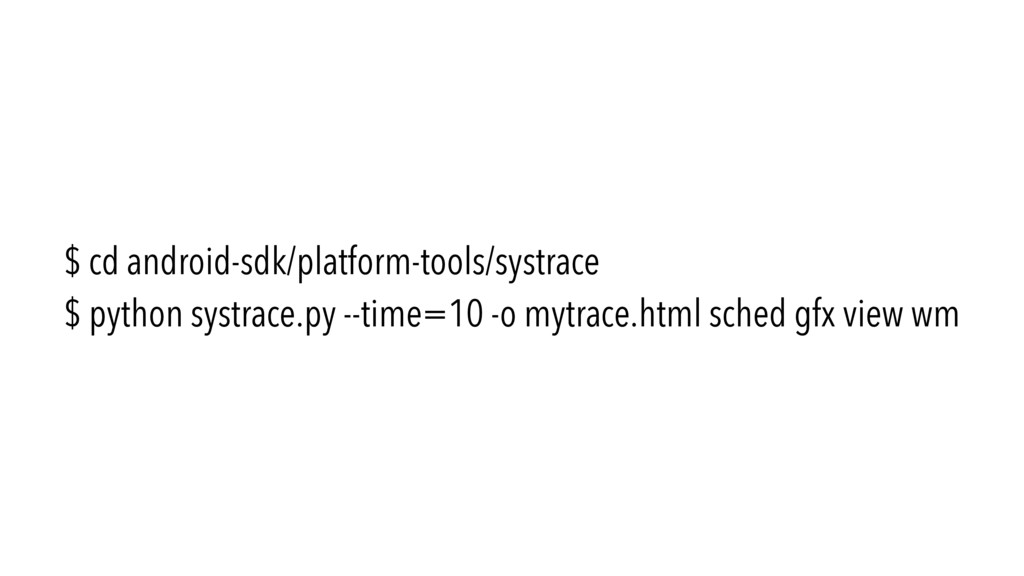
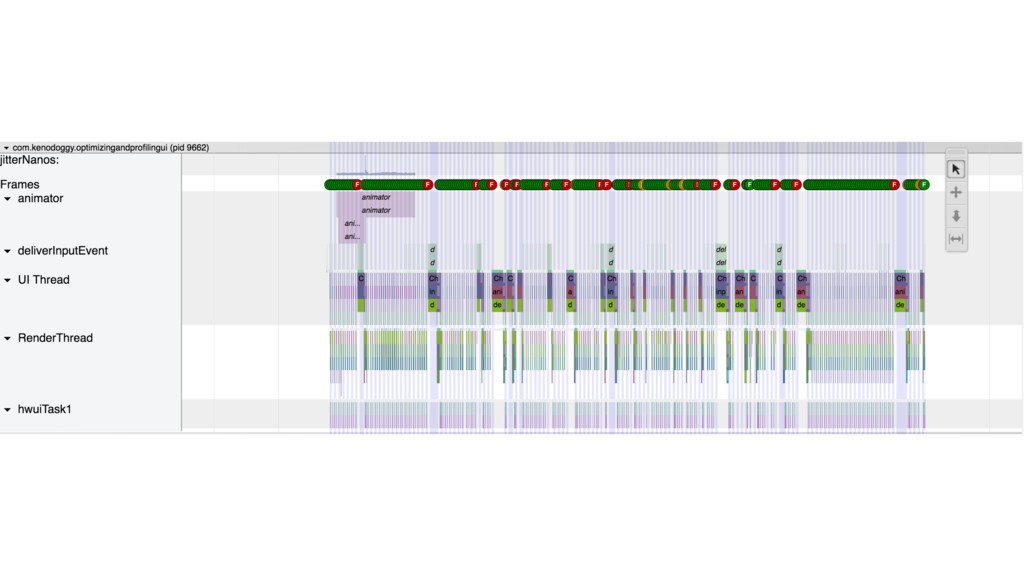
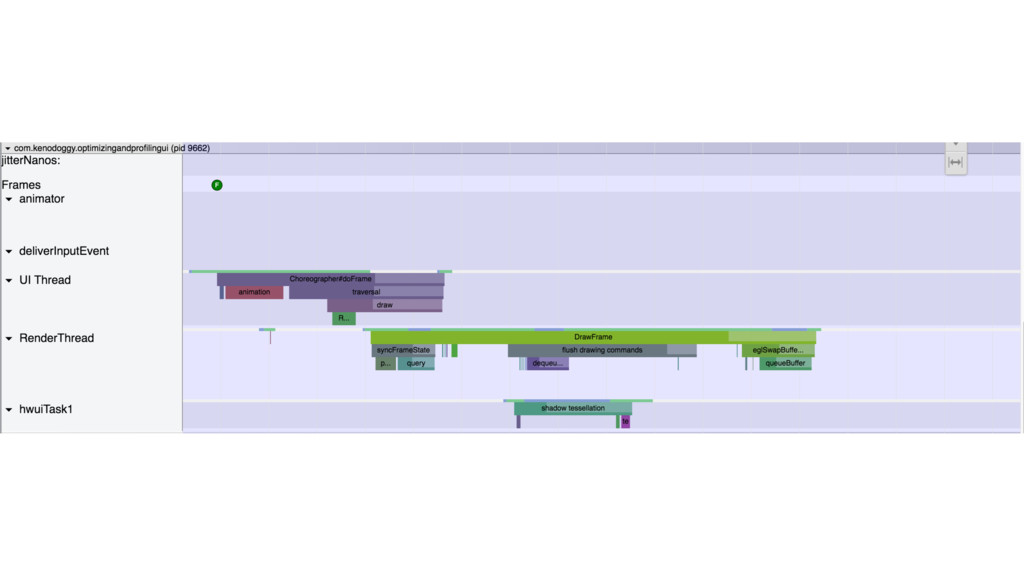
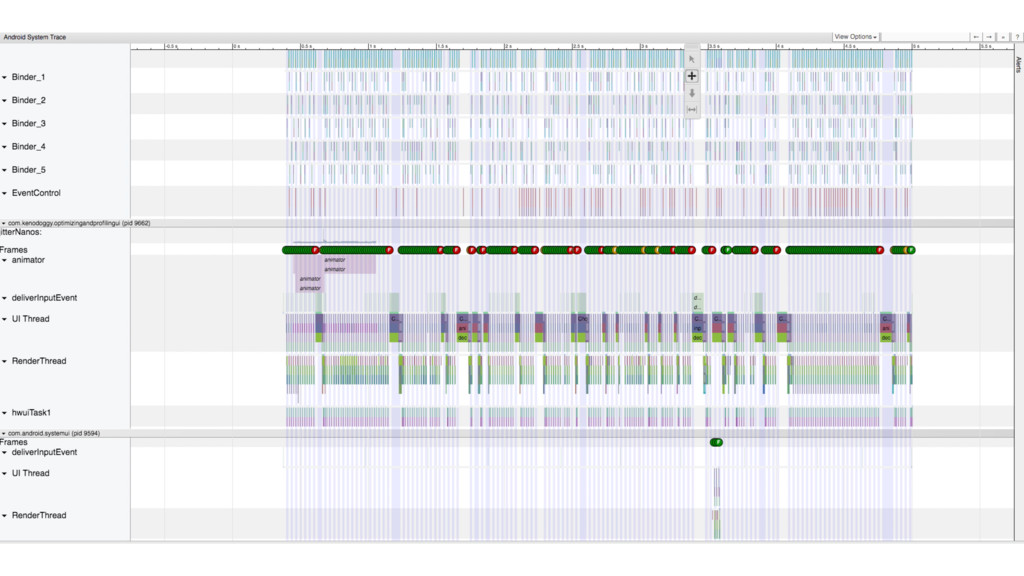
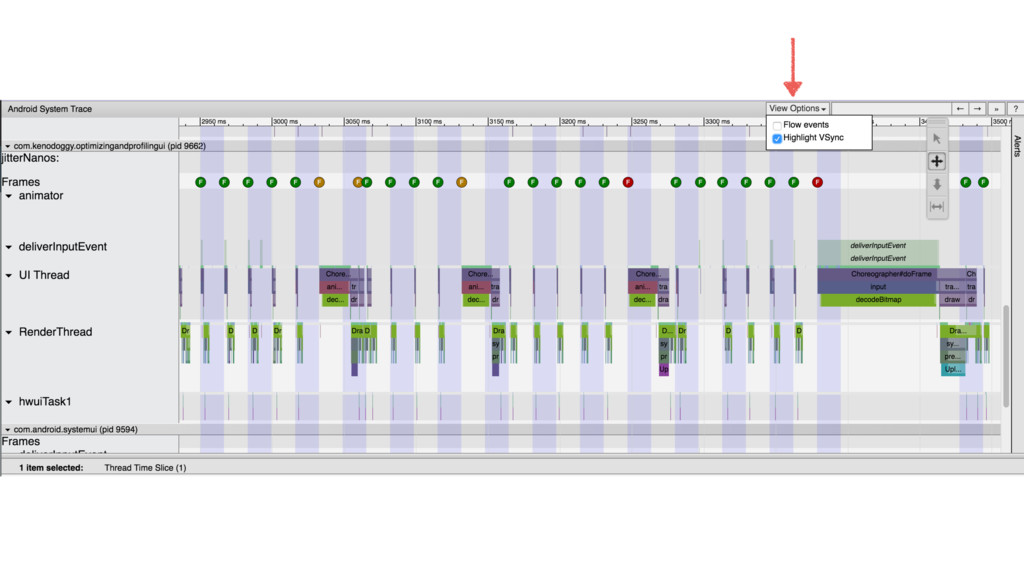
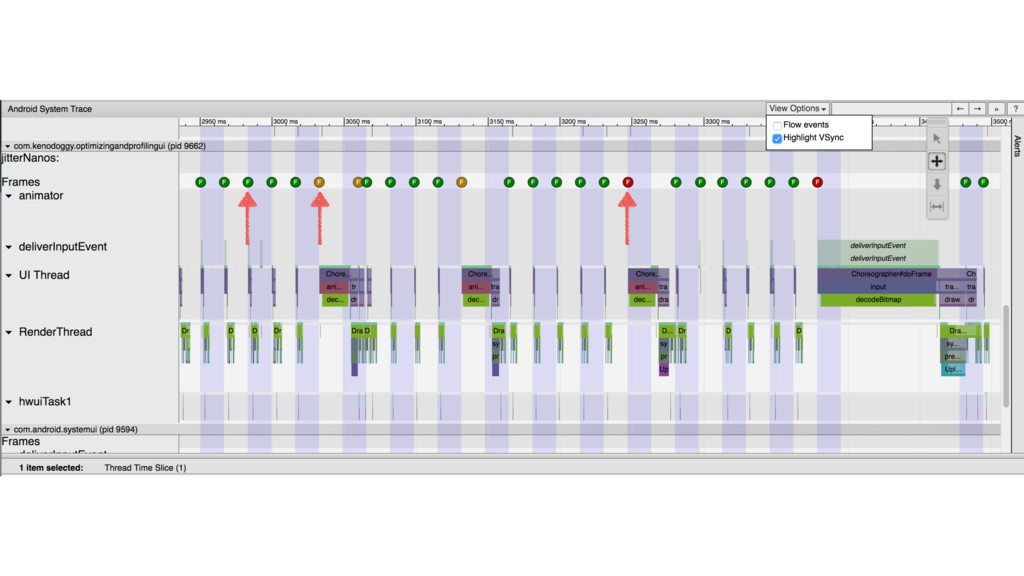
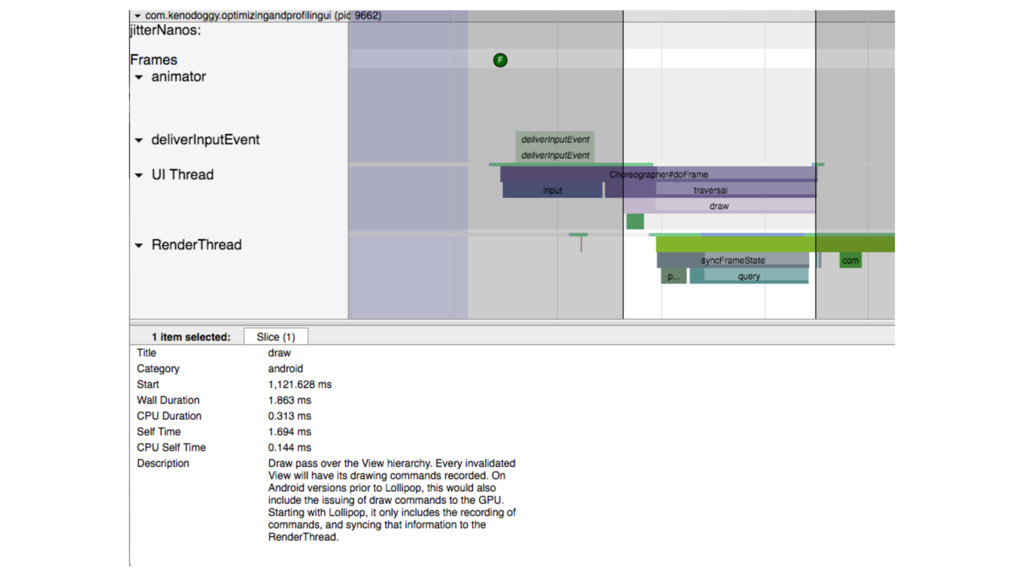
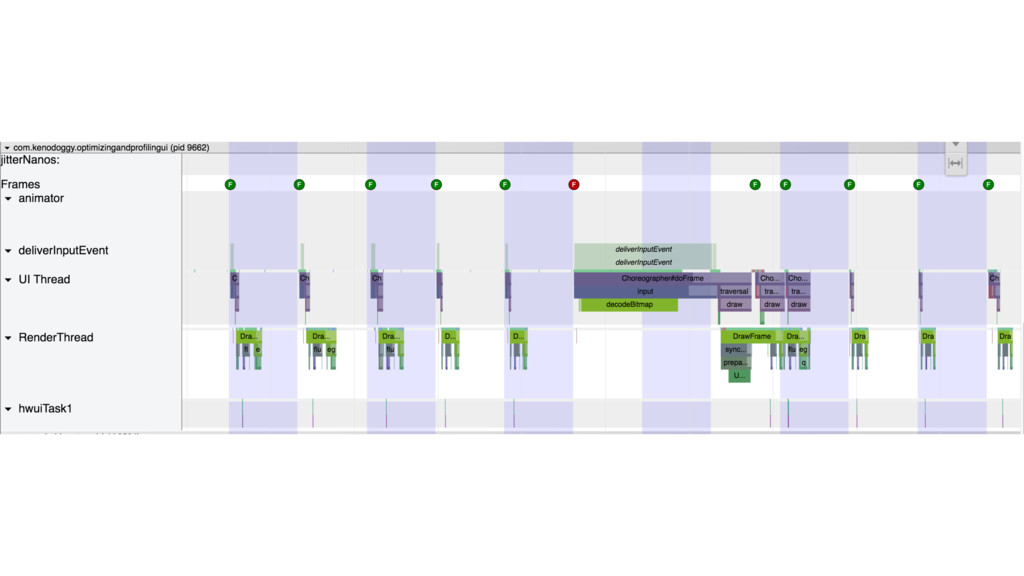
Systrace
$ cd android-sdk/platform-tools/systrace $ python systrace.py --time=10 -o mytrace.html sched
gfx view wm
None
None
None
None
None
None
None
None
Image Libraries to the Rescue! Picasso
Thank you Twitter @kenodoggy g+ +BrendaCook_kenodoggy
![[show deeply nested hierarchy]](https://files.speakerdeck.com/presentations/95e0c8de8325469ca723edd0c52db890/slide_18.jpg)
![[show shallow hierarchy]](https://files.speakerdeck.com/presentations/95e0c8de8325469ca723edd0c52db890/slide_19.jpg)
![[show image of obtaining measure, layout and draw time]](https://files.speakerdeck.com/presentations/95e0c8de8325469ca723edd0c52db890/slide_20.jpg)