Upgrade to Pro — share decks privately, control downloads, hide ads and more …

Spatio-Temporal Analysis of Bicycle Commuting Behavior in the Greater Tokyo Area Using a Micro-Scale Persontrip Database

Spatio-Temporal Analysis of Bicycle Commuting Behavior in the Greater Tokyo Area Using a Micro-Scale Persontrip Database

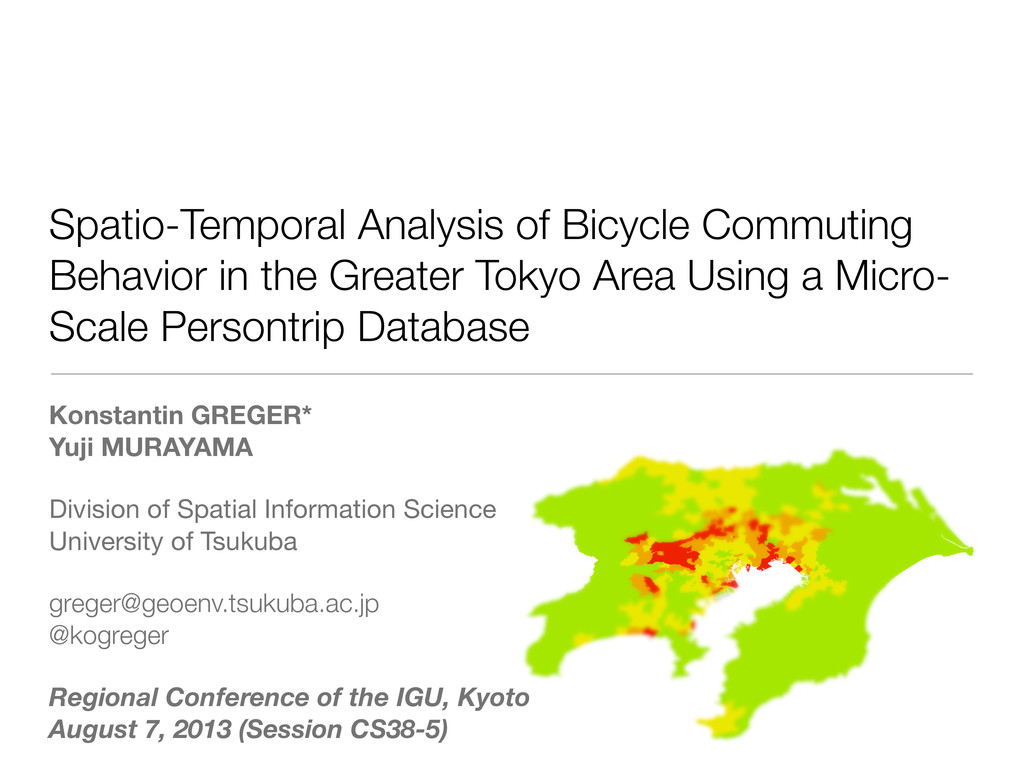
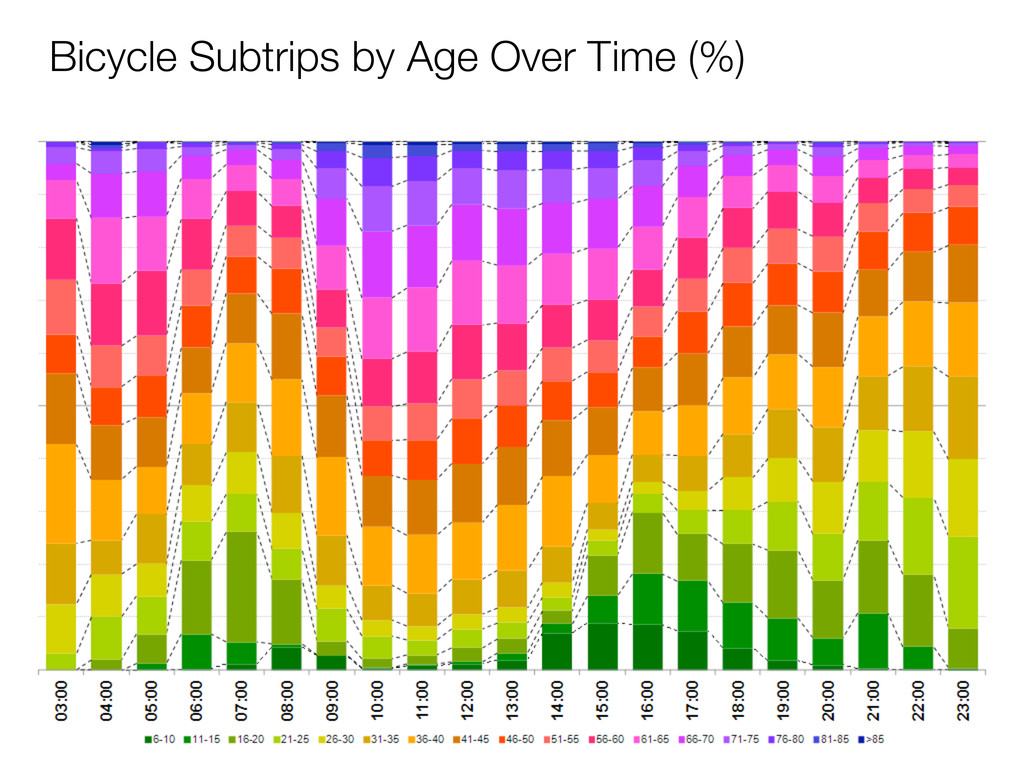
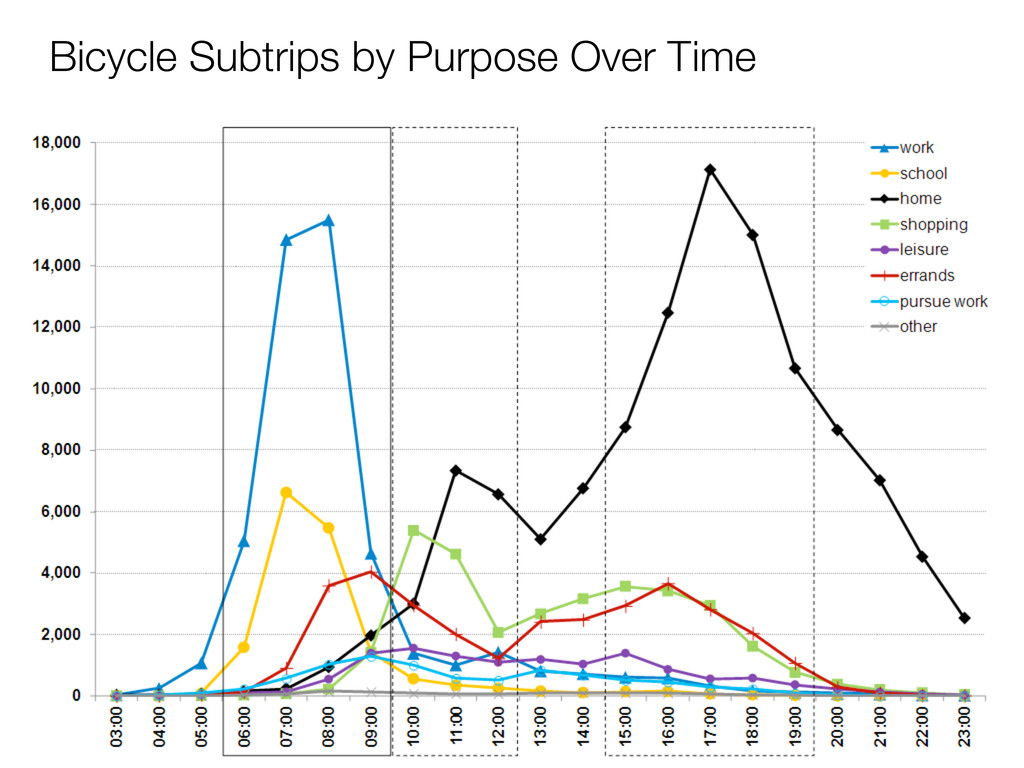
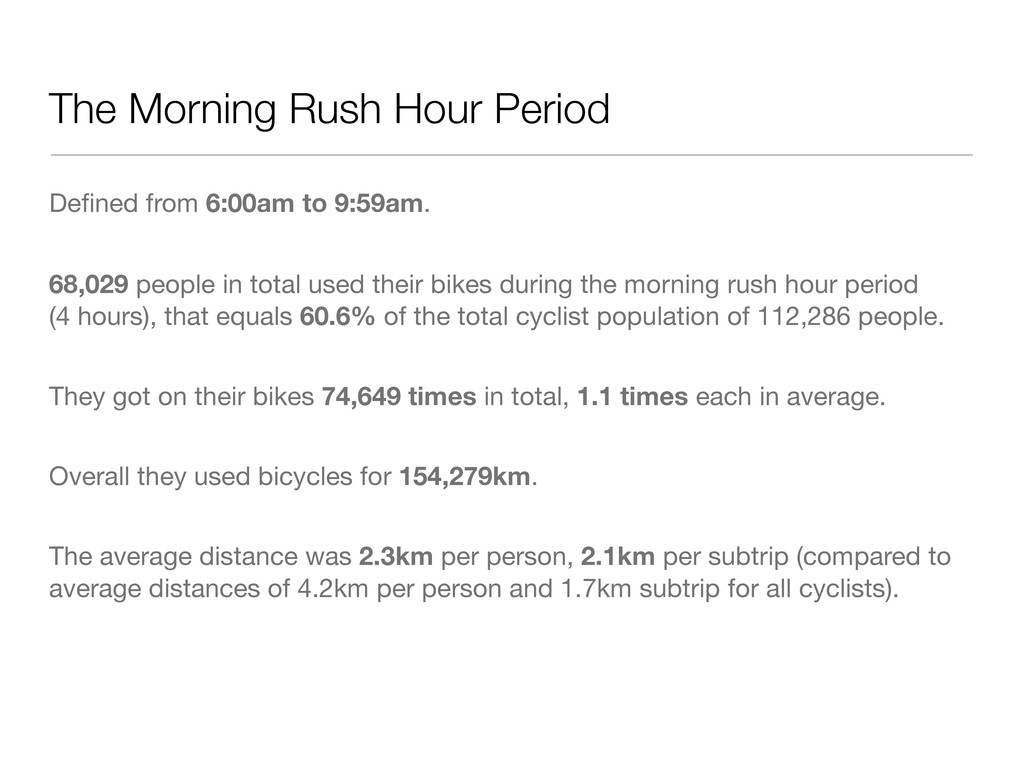
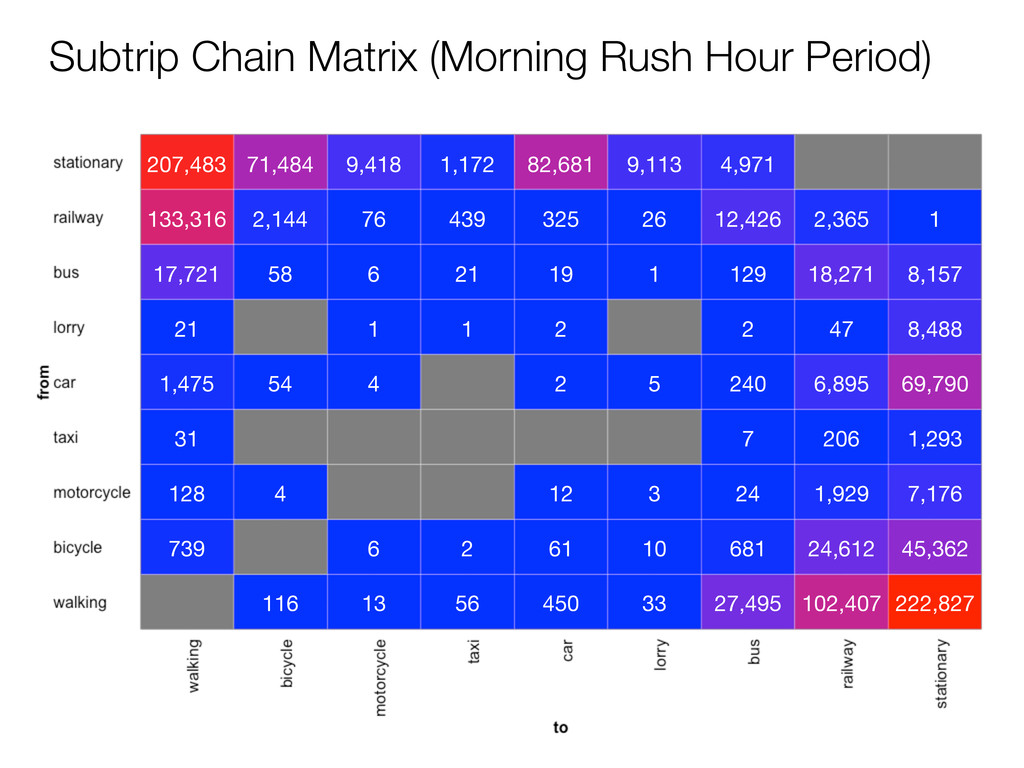
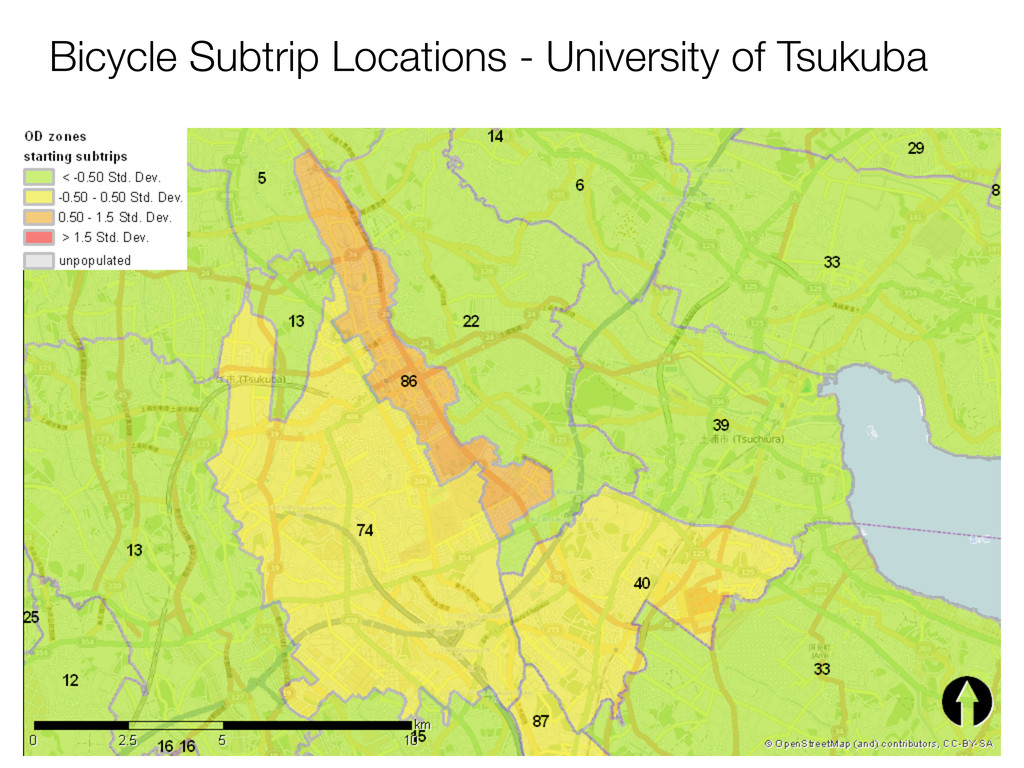
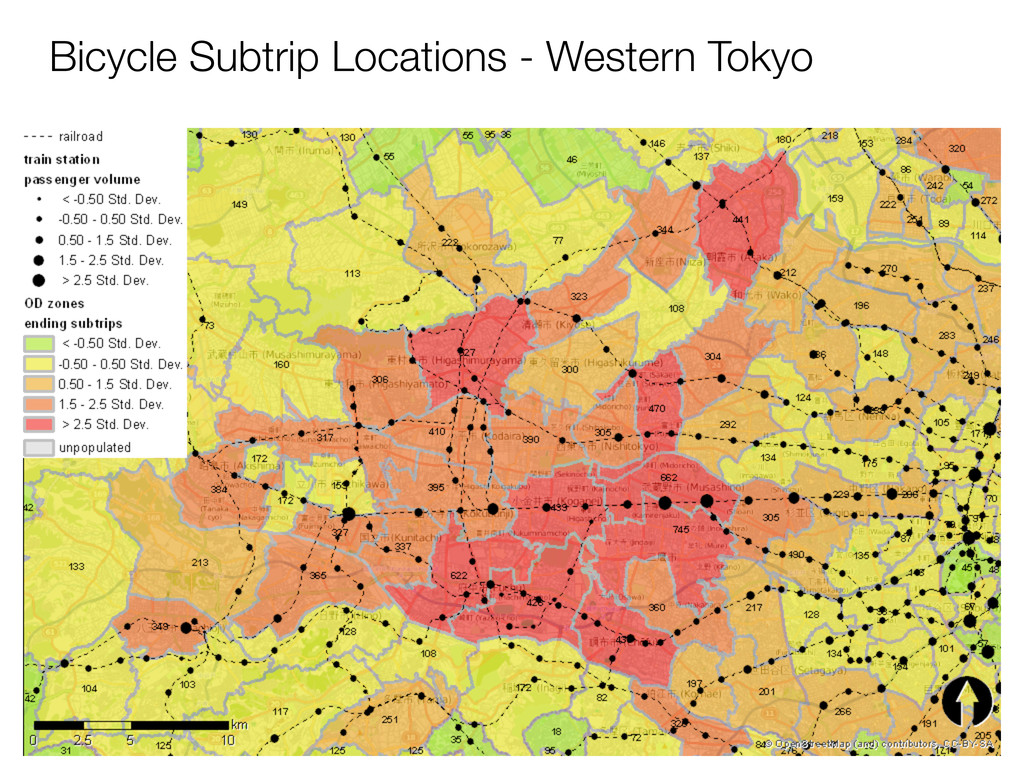
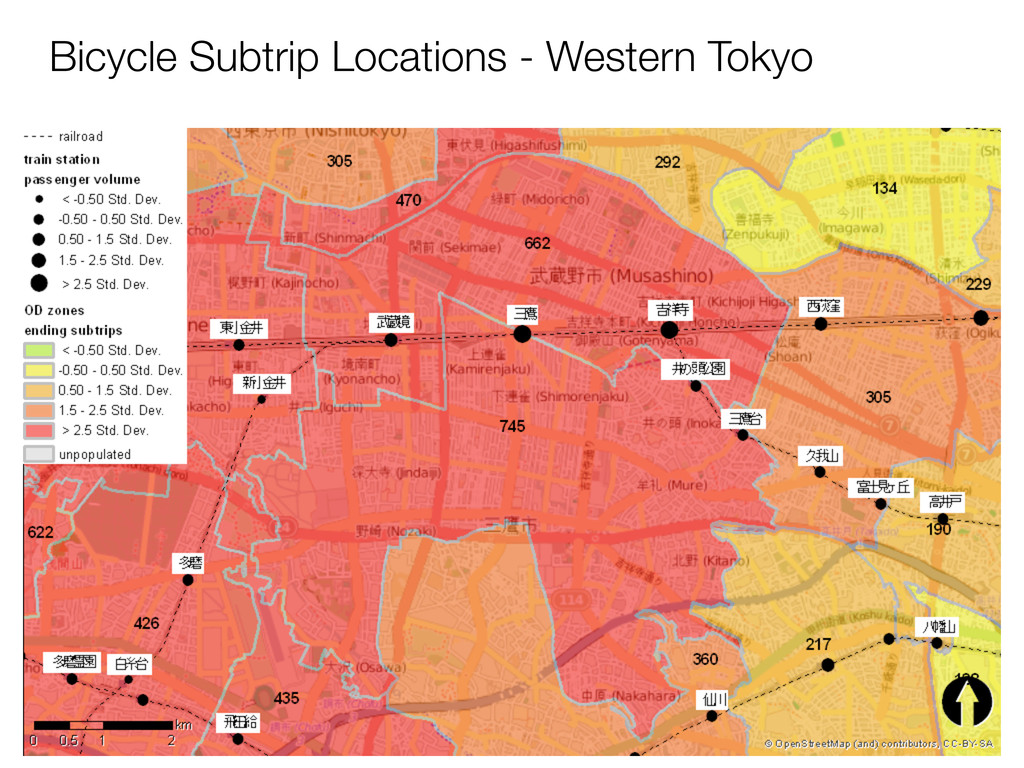
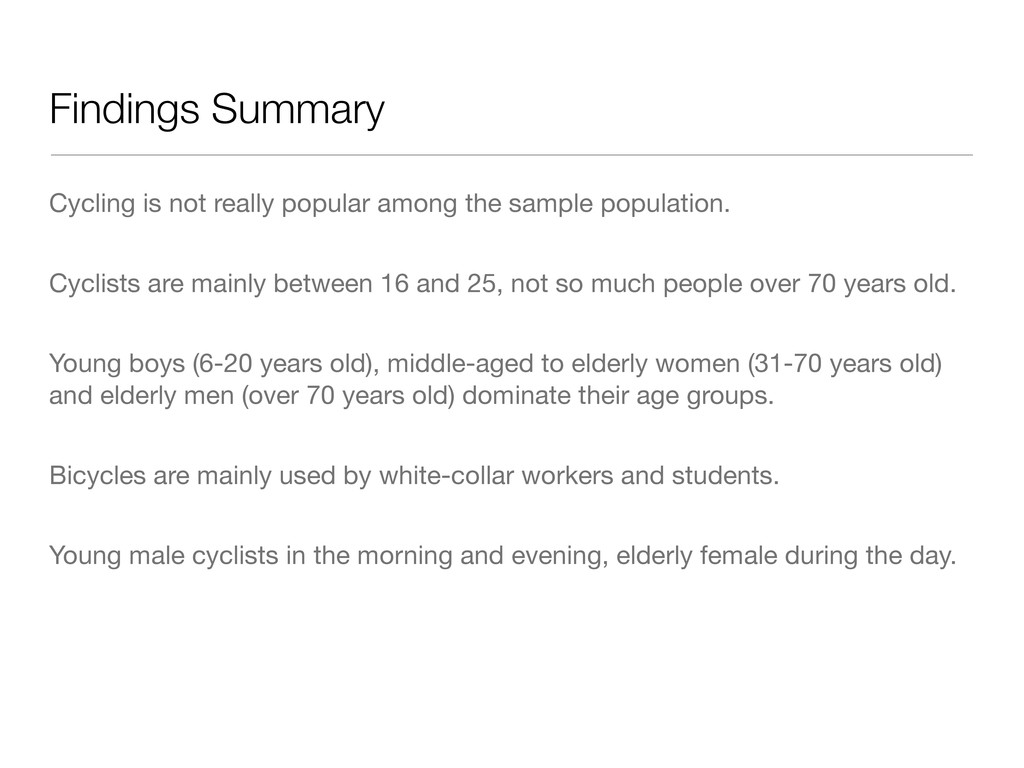
The presentation I gave at the IGU2013 Conference in Kyoto on August 7, 2013. It contains very early findings from a research project analyzing the use of bicycles in the Tokyo Metropolitan Area, especially if and how bicycle use is integrated in the routine commuting activities.

Konstantin Greger

August 07, 2013
Tweet

More Decks by Konstantin Greger

Other Decks in Research

Transcript

  1. Konstantin GREGER* Yuji MURAYAMA Division of Spatial Information Science University

    of Tsukuba [email protected] @kogreger Regional Conference of the IGU, Kyoto August 7, 2013 (Session CS38-5) Spatio-Temporal Analysis of Bicycle Commuting Behavior in the Greater Tokyo Area Using a Micro- Scale Persontrip Database
  2. Key Terms home station X station Y office 1 trip

    purpose: going to work 3 subtrips means of transportation: bicycle, train, walk 07:24-07:35 1.8km 07:40-08:20 20.1km 08:20-08:30 0.4km 07:35-07:40
  3. Persontrip Dataset questionnaires by Tokyo Metropolitan Area Transportation Planning Council

    date of query: October 1st, 2008 contains information about 587,340 individuals synthesized to 1-minute positions by the University of Tokyo Center for Spatial Information Science (CSIS) 845,769,600 point positions in total (24 hours * 60 minutes per individual) PostgreSQL & PostGIS database, total size: 630GB
  4. What does the data tell us? 112,286 people in total

    used their bikes during the sample period (24 hours), that equals 19.1% of the total sample population of 587.334 people. They got on their bikes 272,897 times in total, 2.4 times each in average. Overall they used bicycles for 478,738km - that is further than the distance from the earth to the moon! The average distance was 4.2km per person, 1.7km per subtrip. The longest subtrip was 144km.
  5. Finding #2 Bicycles are mostly used by young boys (6-20

    years old), middle-aged to elderly women (31-70 years old, especially 36-65 years old) and elderly men (over 70 years old).
  6. Finding #3 Bicycles are mainly used by white-collar workers (46.4%)

    and students (22.6%), not so much by blue-collar workers (5%) and unemployed (9.2%).
  7. Finding #4 Bicycles users vary during the day: mostly male

    and young (6-25 years old) in the morning and evening, mostly female and older (over 60 years old) during the day.
  8. Finding #5 In the morning bicycles are mostly used to

    get to work or school, in the afternoon and evening to get back home. During the day they are used for shopping (early noon) and for running errands (morning and afternoon).
  9. The Morning Rush Hour Period Defined from 6:00am to 9:59am.

    68,029 people in total used their bikes during the morning rush hour period (4 hours), that equals 60.6% of the total cyclist population of 112,286 people. They got on their bikes 74,649 times in total, 1.1 times each in average. Overall they used bicycles for 154,279km. The average distance was 2.3km per person, 2.1km per subtrip (compared to average distances of 4.2km per person and 1.7km subtrip for all cyclists).
  10. 207,483 71,484 9,418 1,172 82,681 9,113 4,971 133,316 2,144 76

    439 325 26 12,426 2,365 1 17,721 58 6 21 19 1 129 18,271 8,157 21 1 1 2 2 47 8,488 1,475 54 4 2 5 240 6,895 69,790 31 7 206 1,293 128 4 12 3 24 1,929 7,176 739 6 2 61 10 681 24,612 45,362 116 13 56 450 33 27,495 102,407 222,827 Subtrip Chain Matrix (Morning Rush Hour Period)
  11. Finding #6 Trips by bicycle during the morning rush hour

    go mostly (63%) all the way from home to the final destination. When integrated into a multi-modal trip, bicycles are mostly used on the “home”-end of the trip.
  12. Finding #7 The usage of bicycles during the morning commute

    differs by greatly by location, depending on socio-demographic factors, urban structural function, special infrastructures.
  13. Findings Summary Cycling is not really popular among the sample

    population. Cyclists are mainly between 16 and 25, not so much people over 70 years old. Young boys (6-20 years old), middle-aged to elderly women (31-70 years old) and elderly men (over 70 years old) dominate their age groups. Bicycles are mainly used by white-collar workers and students. Young male cyclists in the morning and evening, elderly female during the day.
  14. Findings Summary (cont’) In the morning bicycles are mostly used

    to get to work or school, in the afternoon and evening to get back home, during the day for shopping and for running errands. Most bicycle trips are under 2km, but some cover longer distances (>10km). Trips by bicycle during the morning rush hour go mostly to the final destination. When integrated into a multi-modal trip, bicycles are mostly used on the “home”-end of the trip and are mostly followed by train rides. The usage of bicycles during the morning commute differs by greatly by location.
  15. Thank you for your kind attention! http://www.konstantingreger.net [email protected] @kogreger This

    research is using data kindly provided by the Center for Spatial Information Science, the University of Tokyo (౦ژେֶۭؒ৘ใՊֶݚڀηϯλʔ), in line with joint research No. 405 (project lead: Prof. Yuji Murayama)