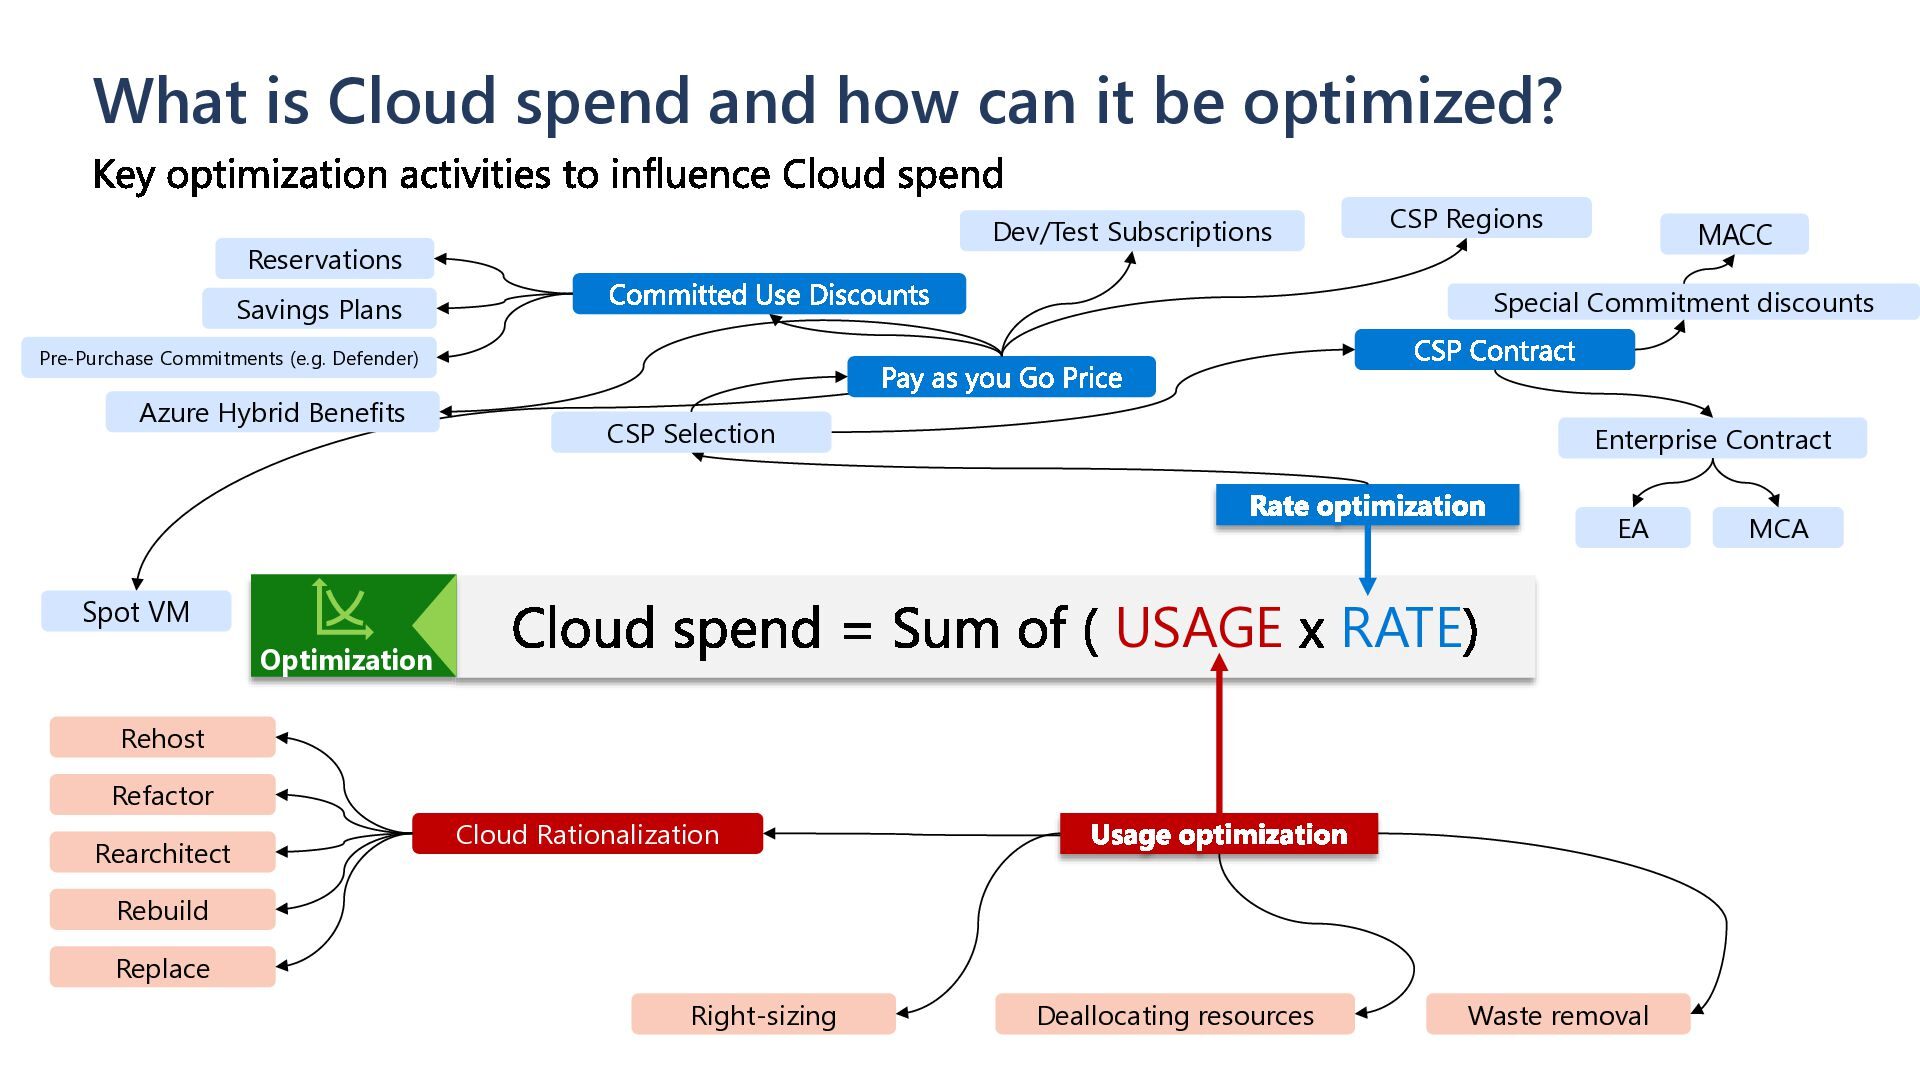
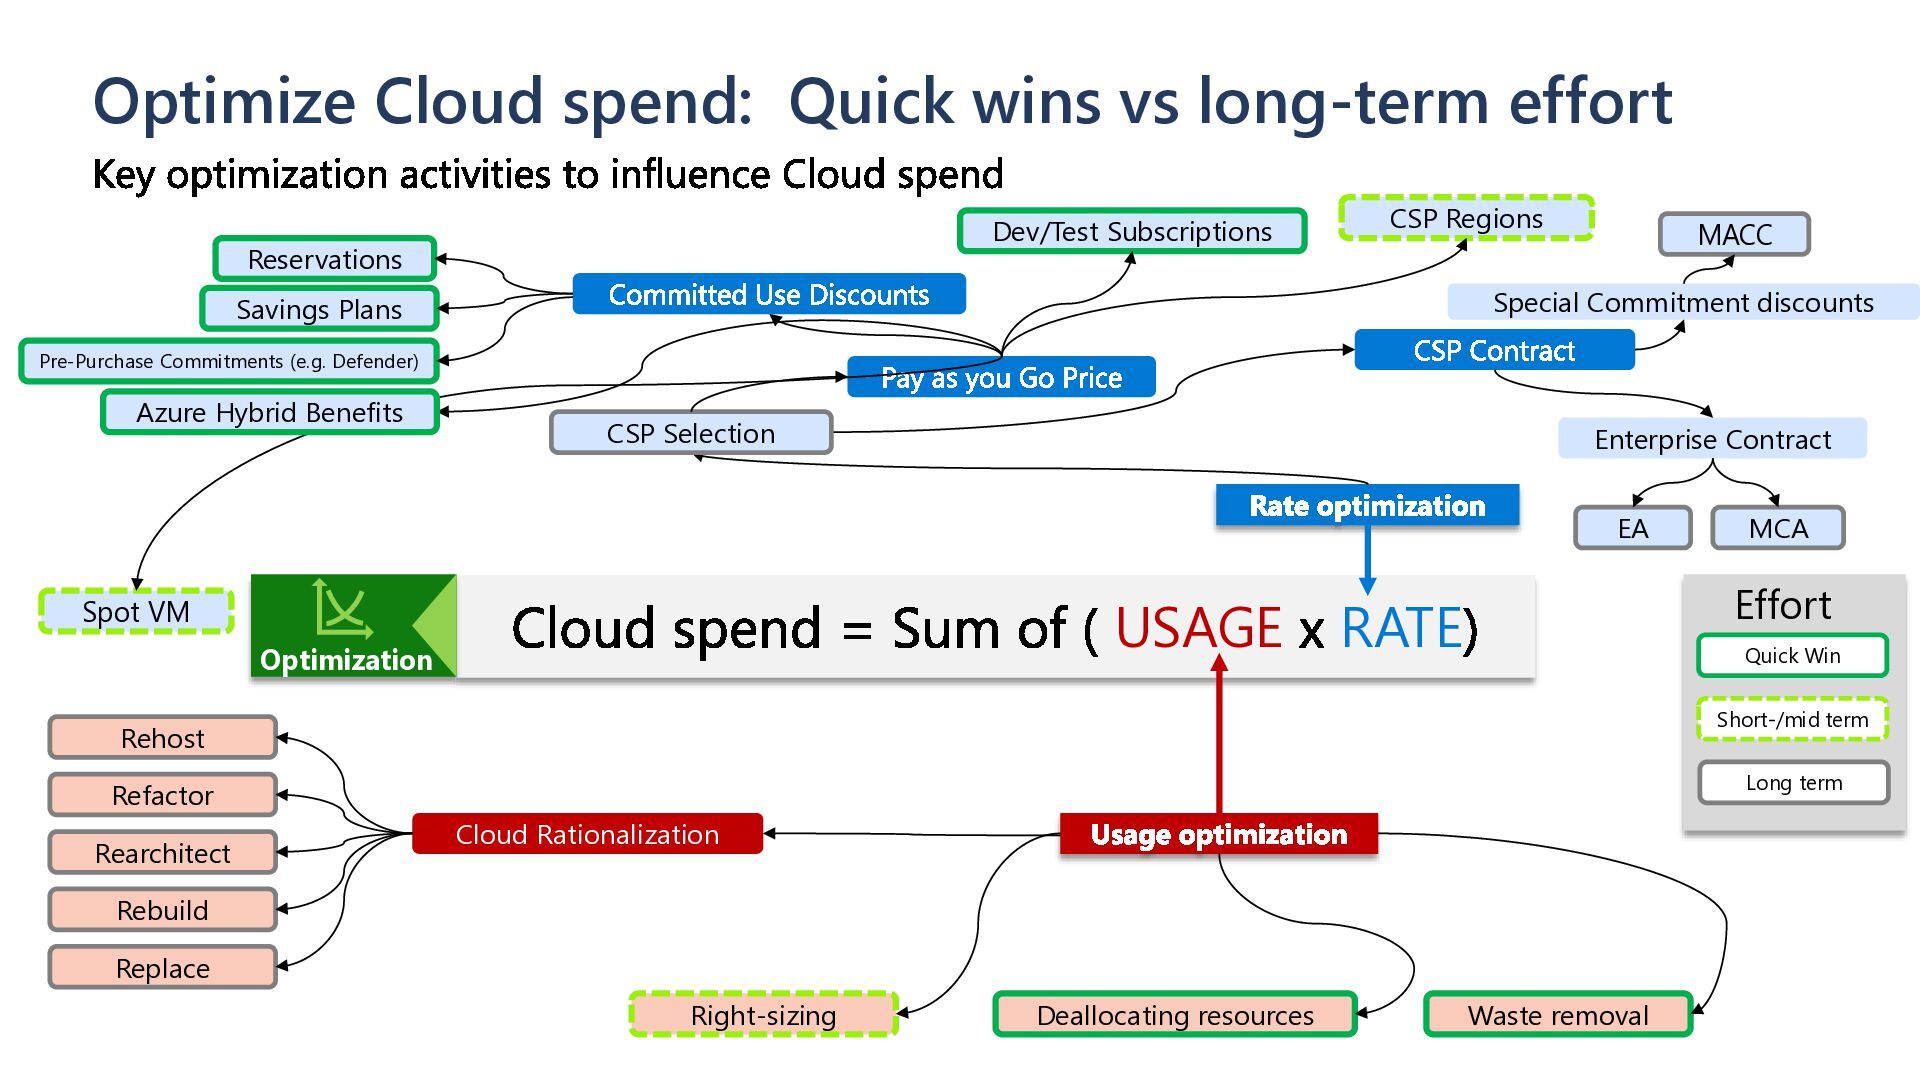
= Sum of ( USAGE x RATE) Rate optimization CSP Contract Pay as you Go Price Committed Use Discounts Reservations Savings Plans CSP Selection CSP Regions Enterprise Contract Special Commitment discounts Usage optimization Waste removal Deallocating resources Right-sizing Cloud Rationalization Rehost Refactor Rearchitect Rebuild Replace Key optimization activities to influence Cloud spend EA MCA MACC Optimization Dev/Test Subscriptions Spot VM Quick Win Short-/mid term Long term Effort Pre-Purchase Commitments (e.g. Defender) Azure Hybrid Benefits
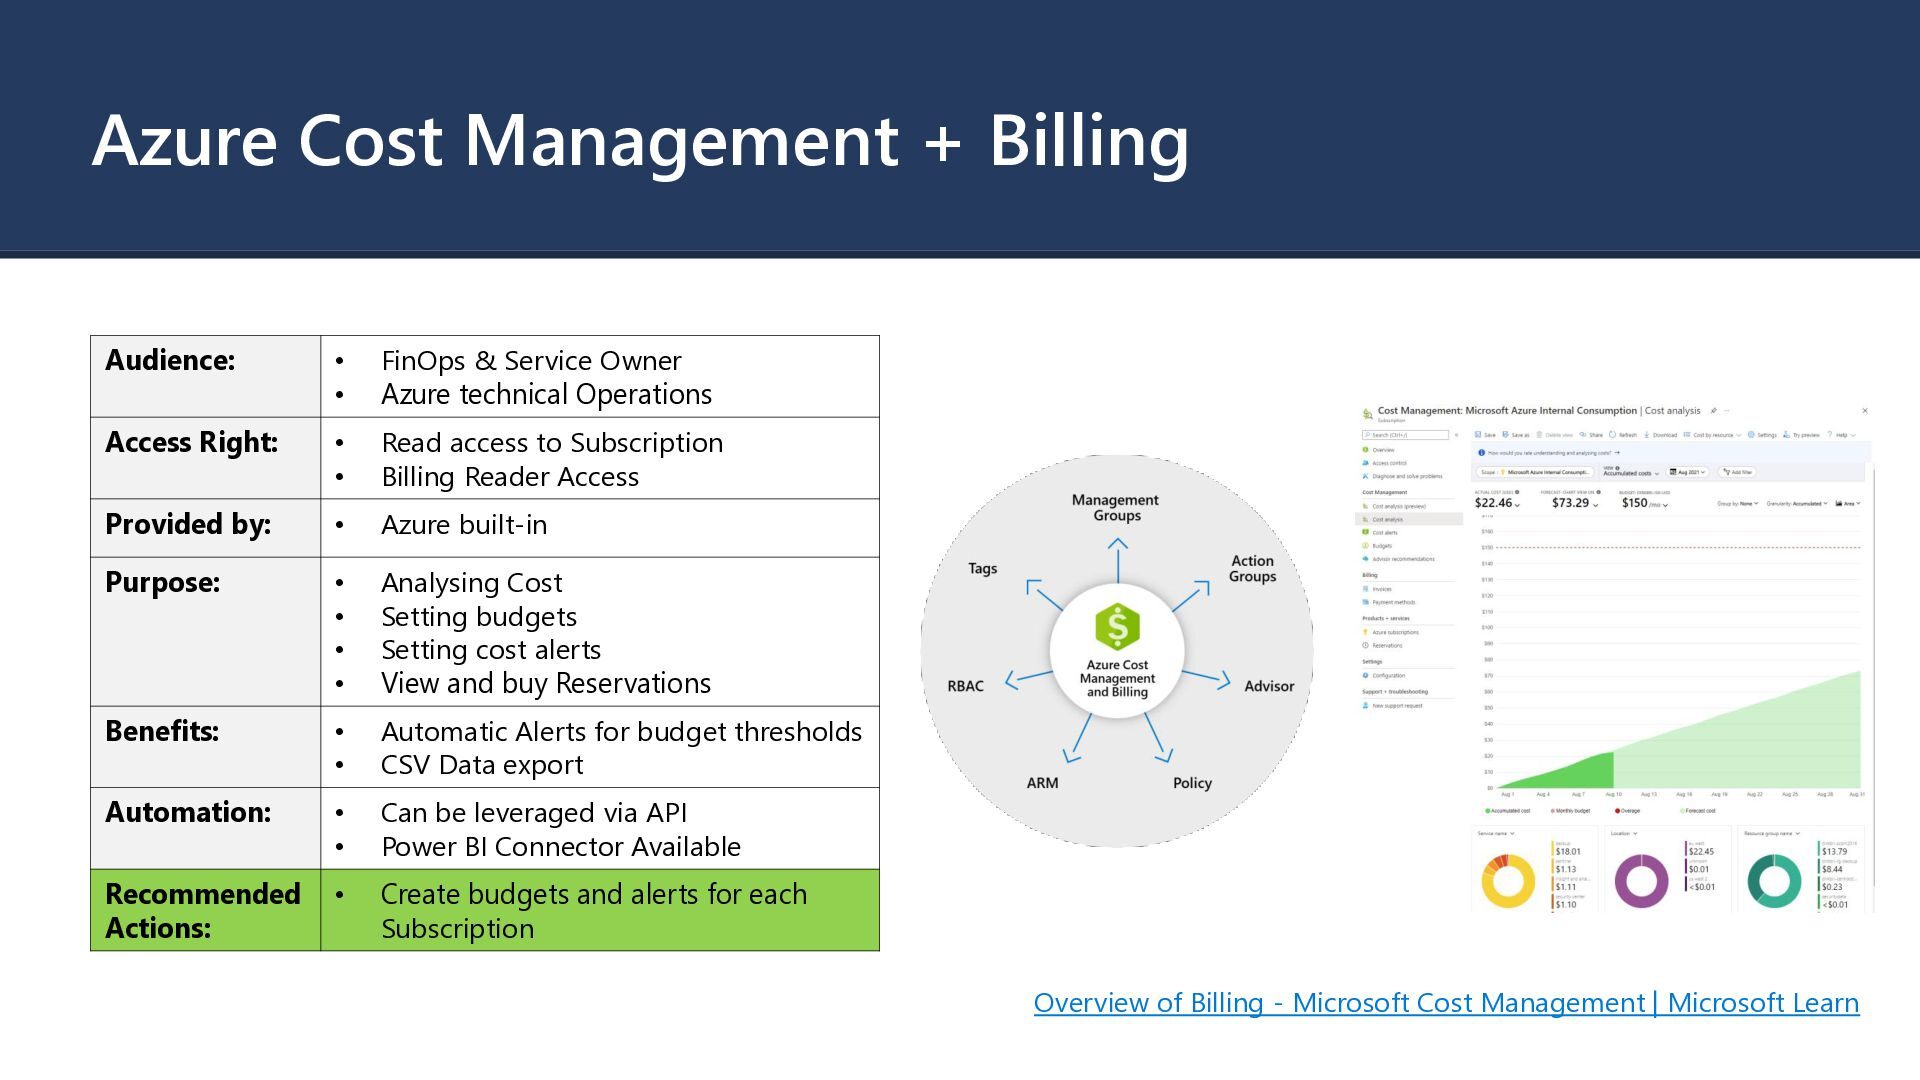
Owner • Azure technical Operations Access Right: • Read access to Subscription • Billing Reader Access Provided by: • Azure built-in Purpose: • Analysing Cost • Setting budgets • Setting cost alerts • View and buy Reservations Benefits: • Automatic Alerts for budget thresholds • CSV Data export Automation: • Can be leveraged via API • Power BI Connector Available Recommended Actions: • Create budgets and alerts for each Subscription Overview of Billing - Microsoft Cost Management | Microsoft Learn
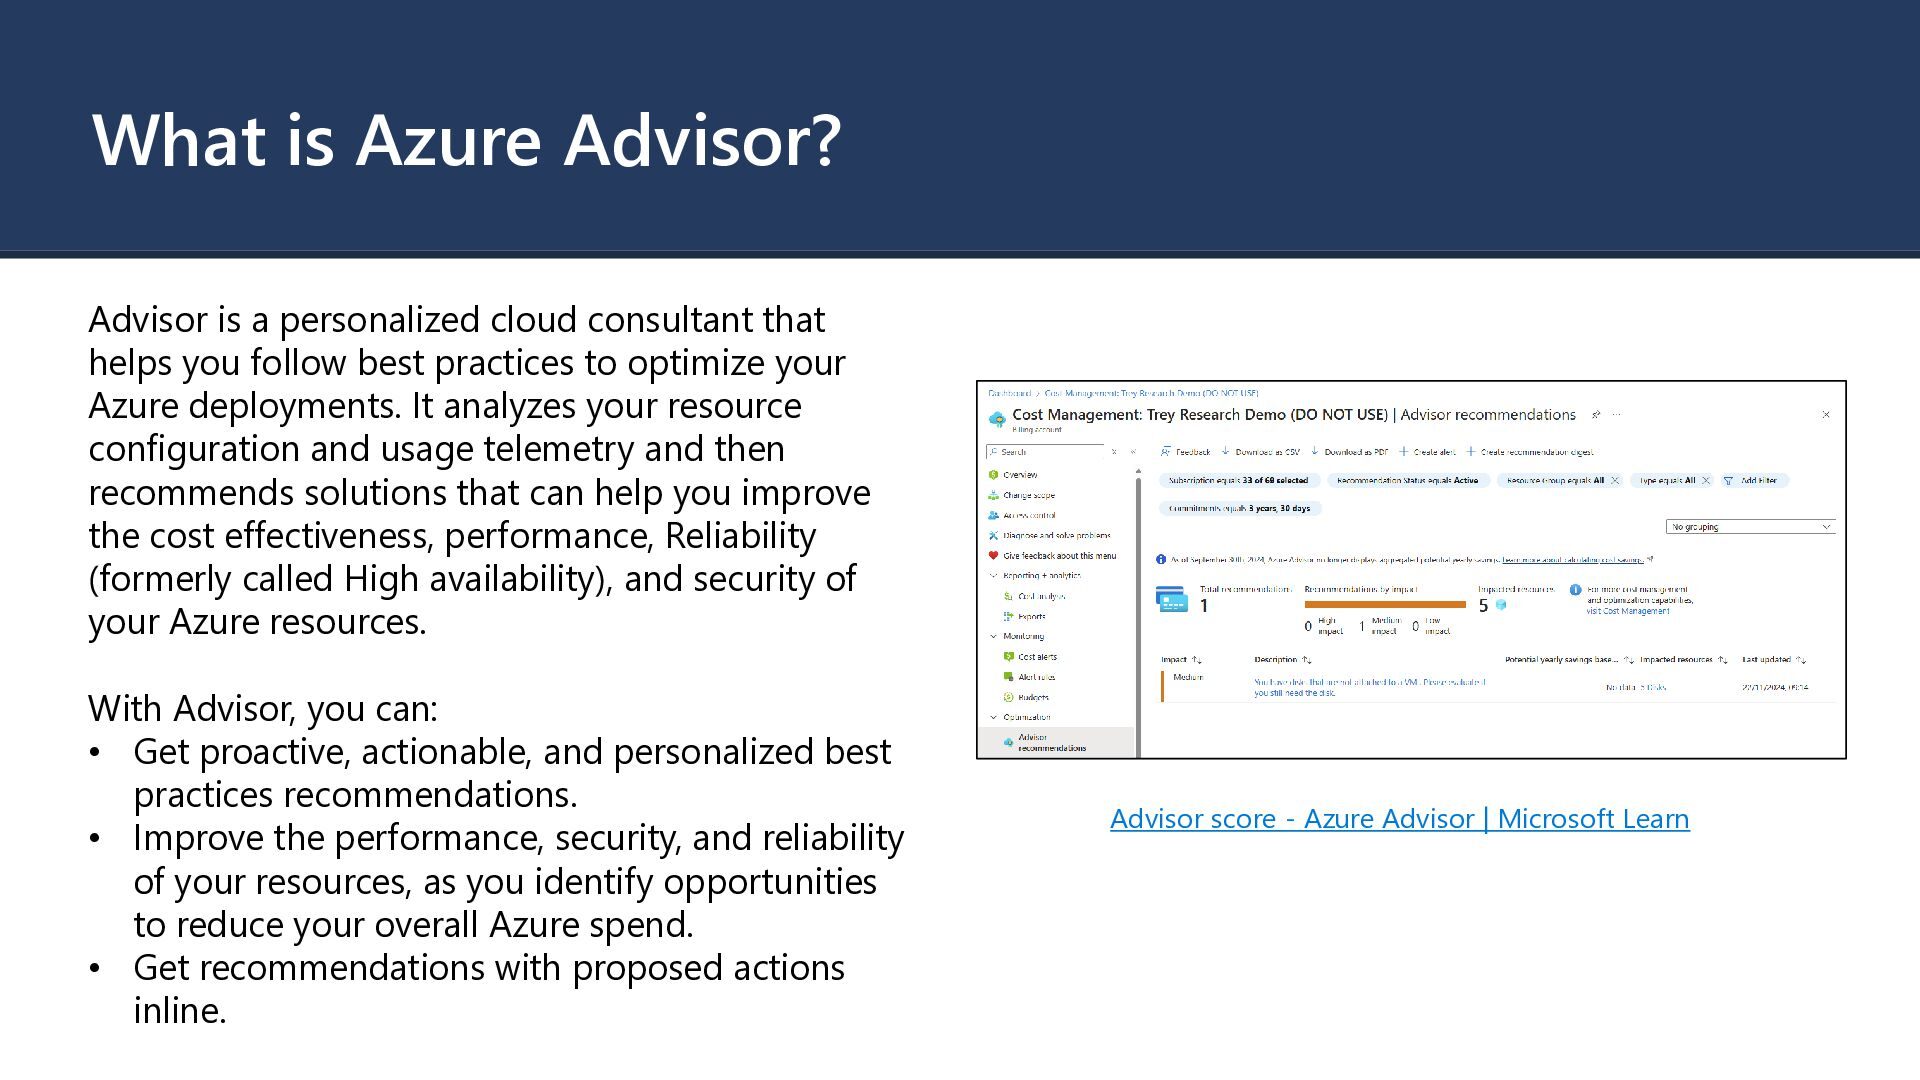
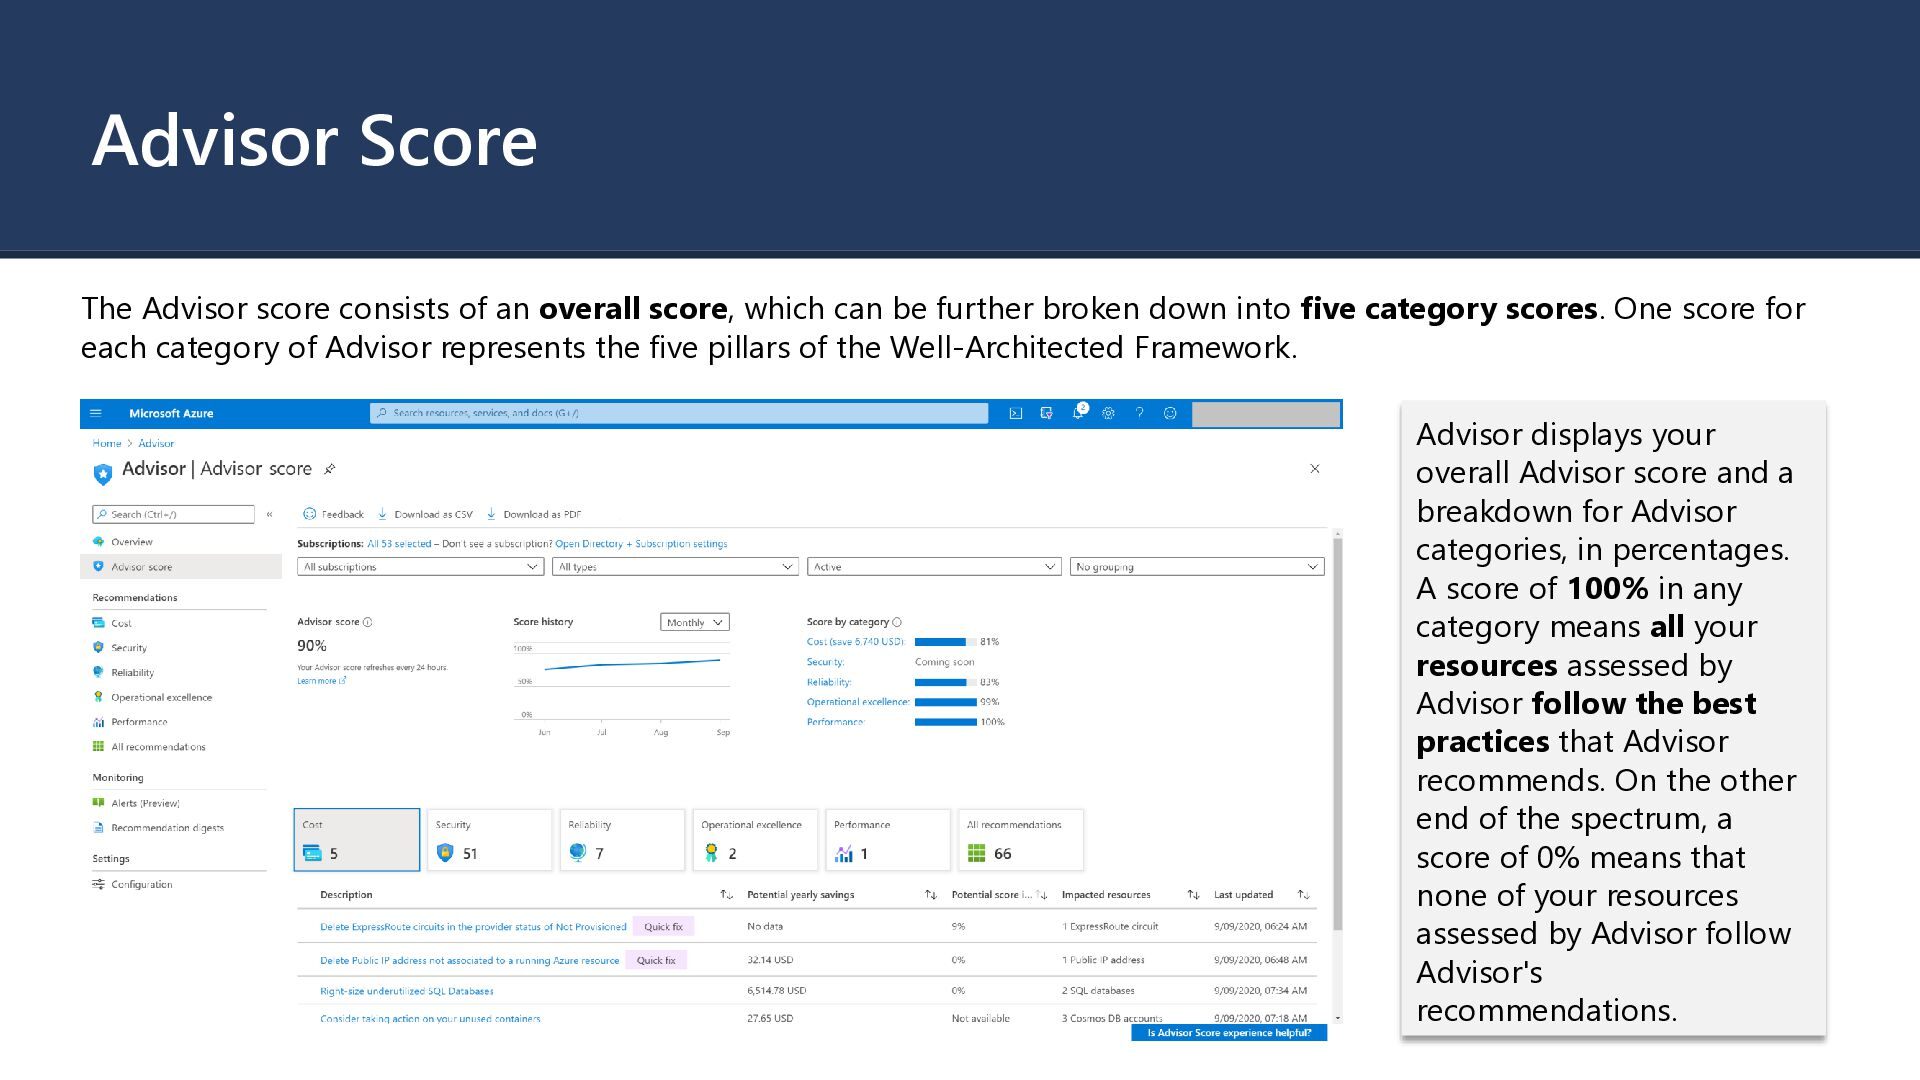
that helps you follow best practices to optimize your Azure deployments. It analyzes your resource configuration and usage telemetry and then recommends solutions that can help you improve the cost effectiveness, performance, Reliability (formerly called High availability), and security of your Azure resources. With Advisor, you can: • Get proactive, actionable, and personalized best practices recommendations. • Improve the performance, security, and reliability of your resources, as you identify opportunities to reduce your overall Azure spend. • Get recommendations with proposed actions inline. Advisor score - Azure Advisor | Microsoft Learn
which can be further broken down into five category scores. One score for each category of Advisor represents the five pillars of the Well-Architected Framework. Advisor displays your overall Advisor score and a breakdown for Advisor categories, in percentages. A score of 100% in any category means all your resources assessed by Advisor follow the best practices that Advisor recommends. On the other end of the spectrum, a score of 0% means that none of your resources assessed by Advisor follow Advisor's recommendations.
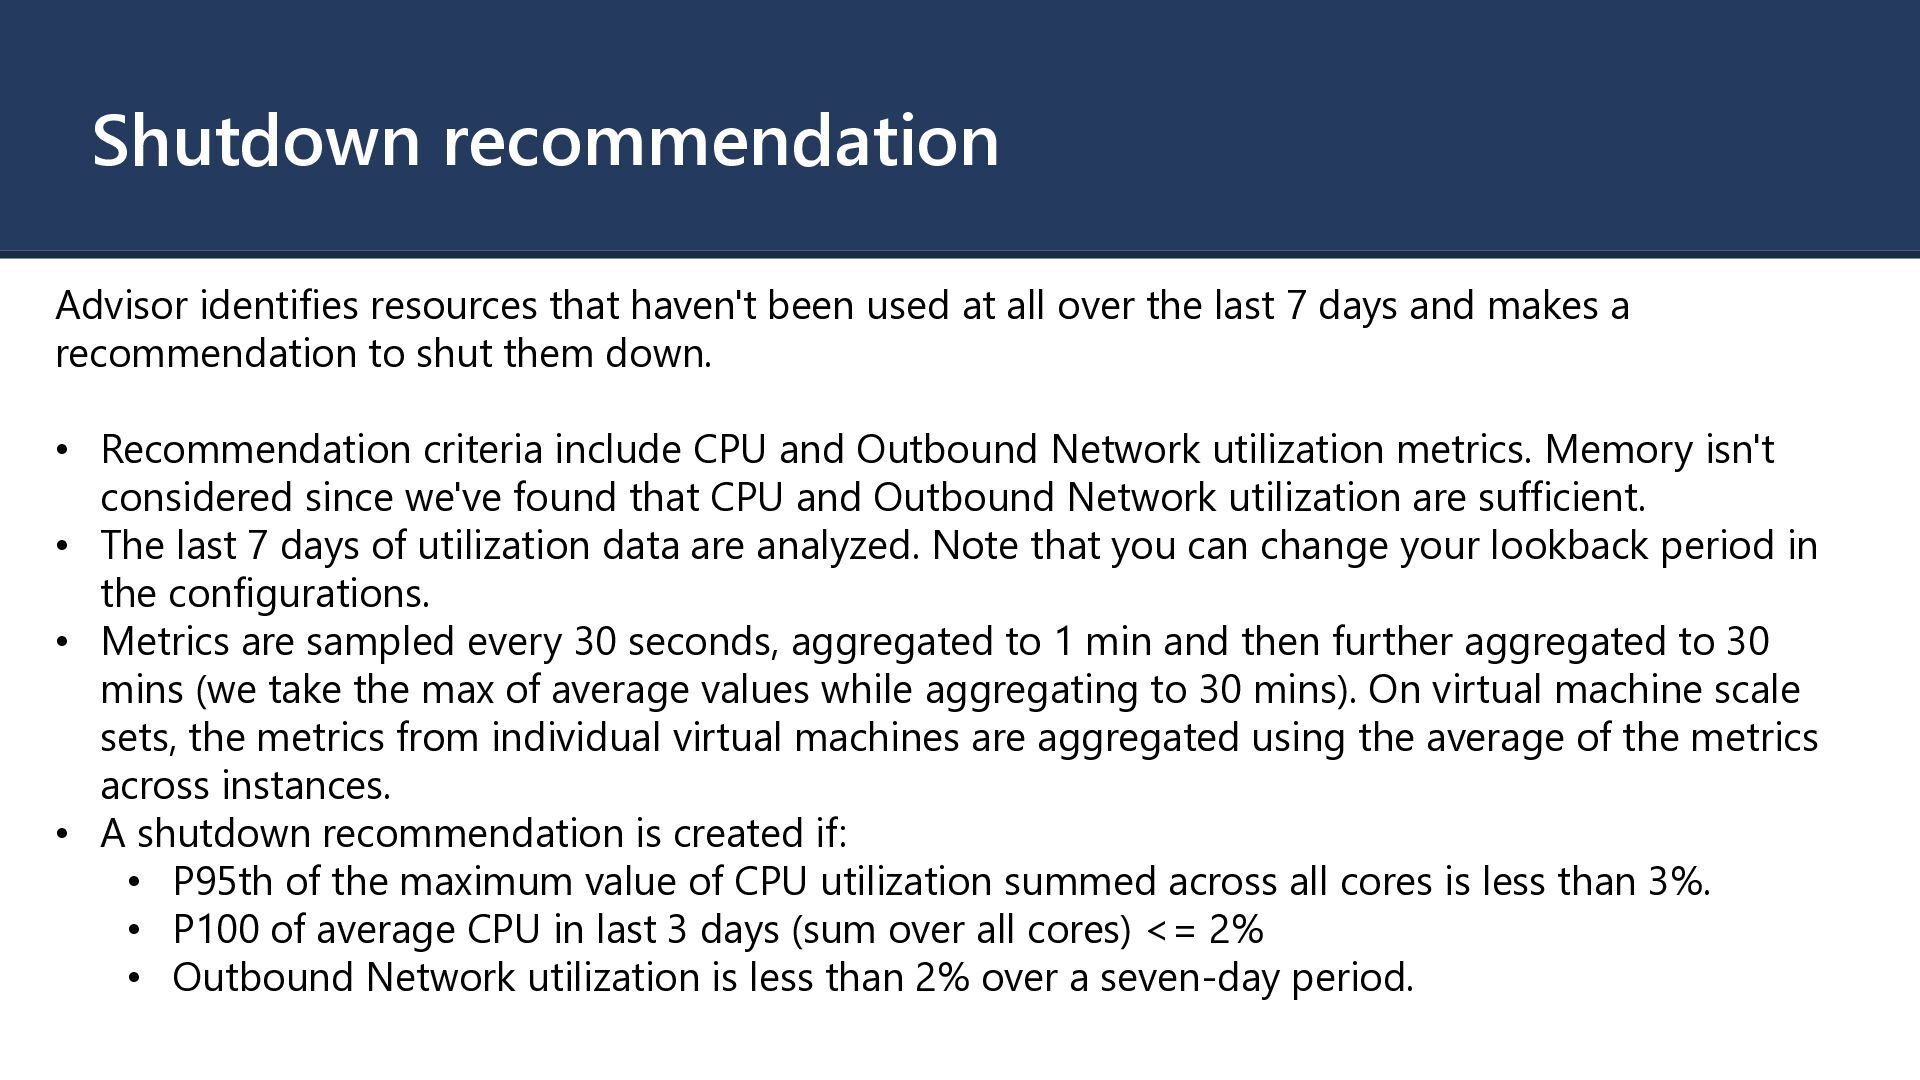
all over the last 7 days and makes a recommendation to shut them down. • Recommendation criteria include CPU and Outbound Network utilization metrics. Memory isn't considered since we've found that CPU and Outbound Network utilization are sufficient. • The last 7 days of utilization data are analyzed. Note that you can change your lookback period in the configurations. • Metrics are sampled every 30 seconds, aggregated to 1 min and then further aggregated to 30 mins (we take the max of average values while aggregating to 30 mins). On virtual machine scale sets, the metrics from individual virtual machines are aggregated using the average of the metrics across instances. • A shutdown recommendation is created if: • P95th of the maximum value of CPU utilization summed across all cores is less than 3%. • P100 of average CPU in last 3 days (sum over all cores) <= 2% • Outbound Network utilization is less than 2% over a seven-day period.
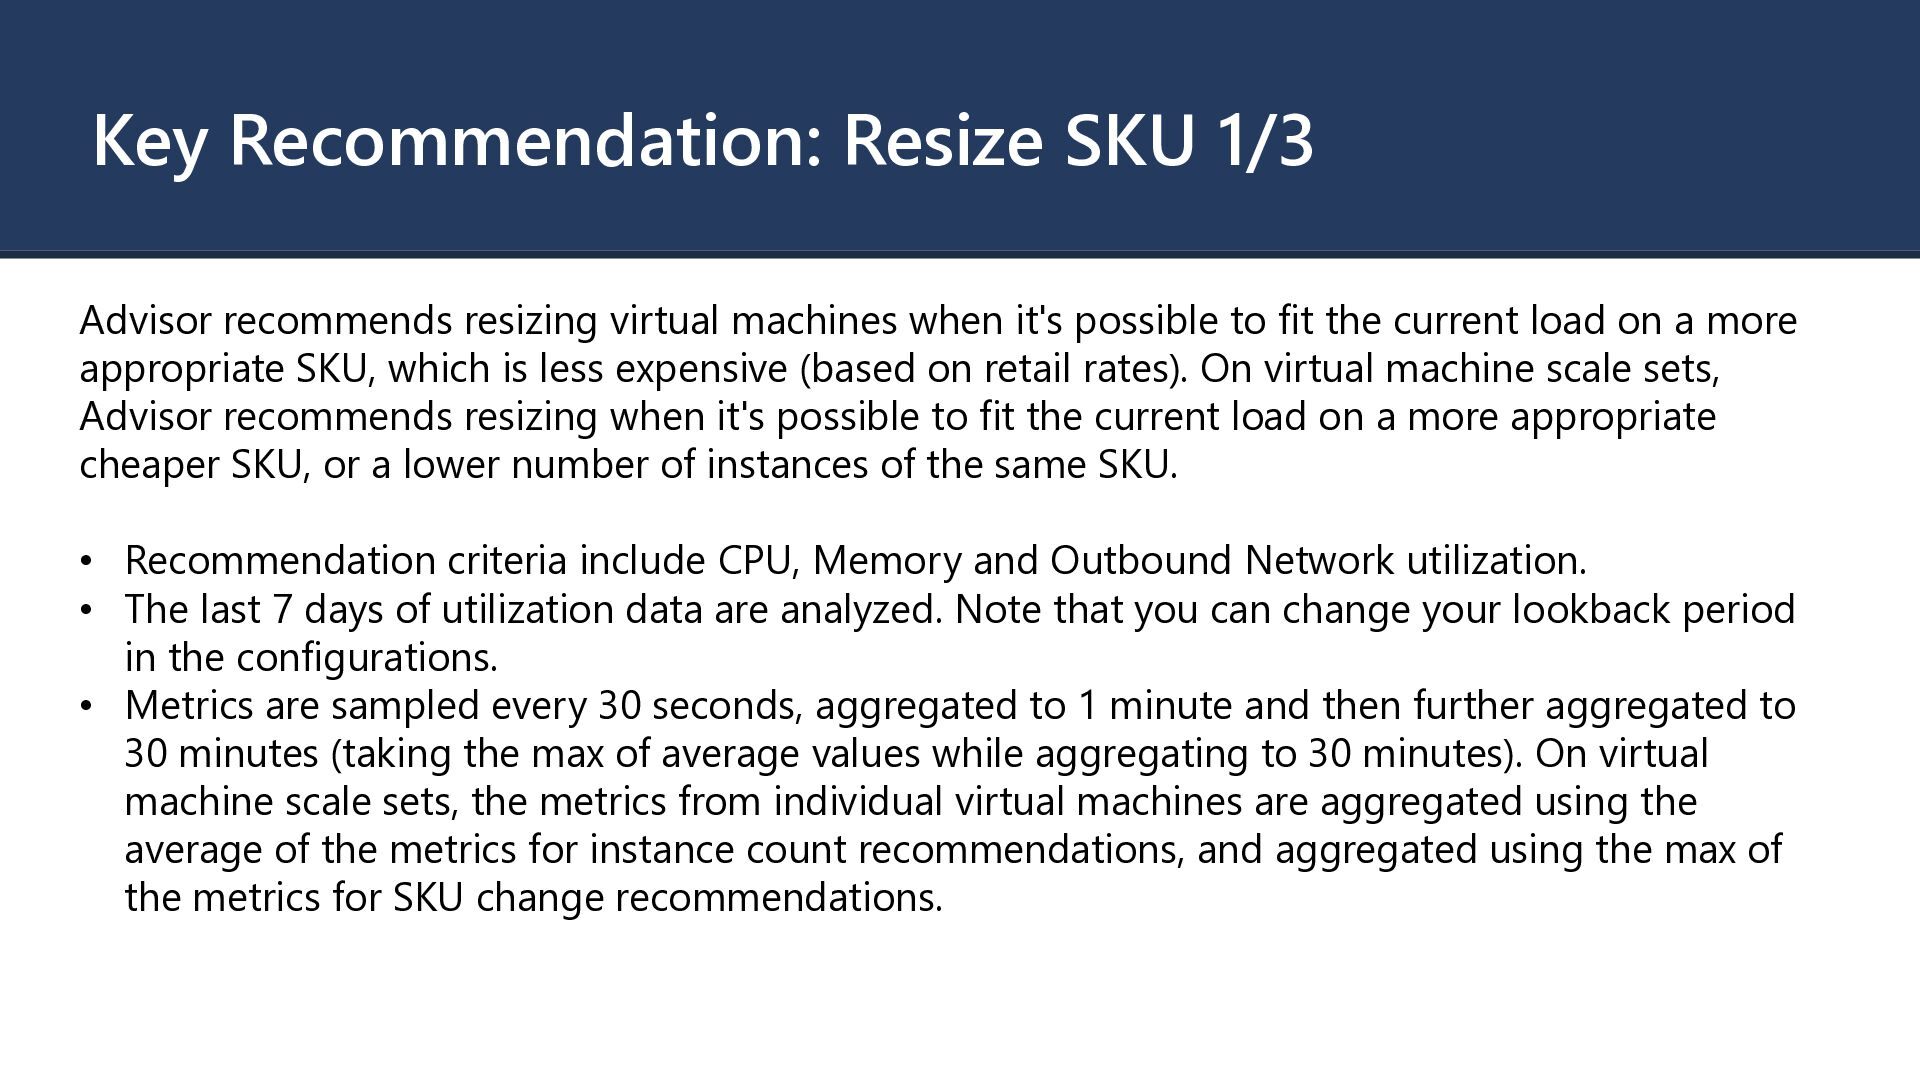
when it's possible to fit the current load on a more appropriate SKU, which is less expensive (based on retail rates). On virtual machine scale sets, Advisor recommends resizing when it's possible to fit the current load on a more appropriate cheaper SKU, or a lower number of instances of the same SKU. • Recommendation criteria include CPU, Memory and Outbound Network utilization. • The last 7 days of utilization data are analyzed. Note that you can change your lookback period in the configurations. • Metrics are sampled every 30 seconds, aggregated to 1 minute and then further aggregated to 30 minutes (taking the max of average values while aggregating to 30 minutes). On virtual machine scale sets, the metrics from individual virtual machines are aggregated using the average of the metrics for instance count recommendations, and aggregated using the max of the metrics for SKU change recommendations.
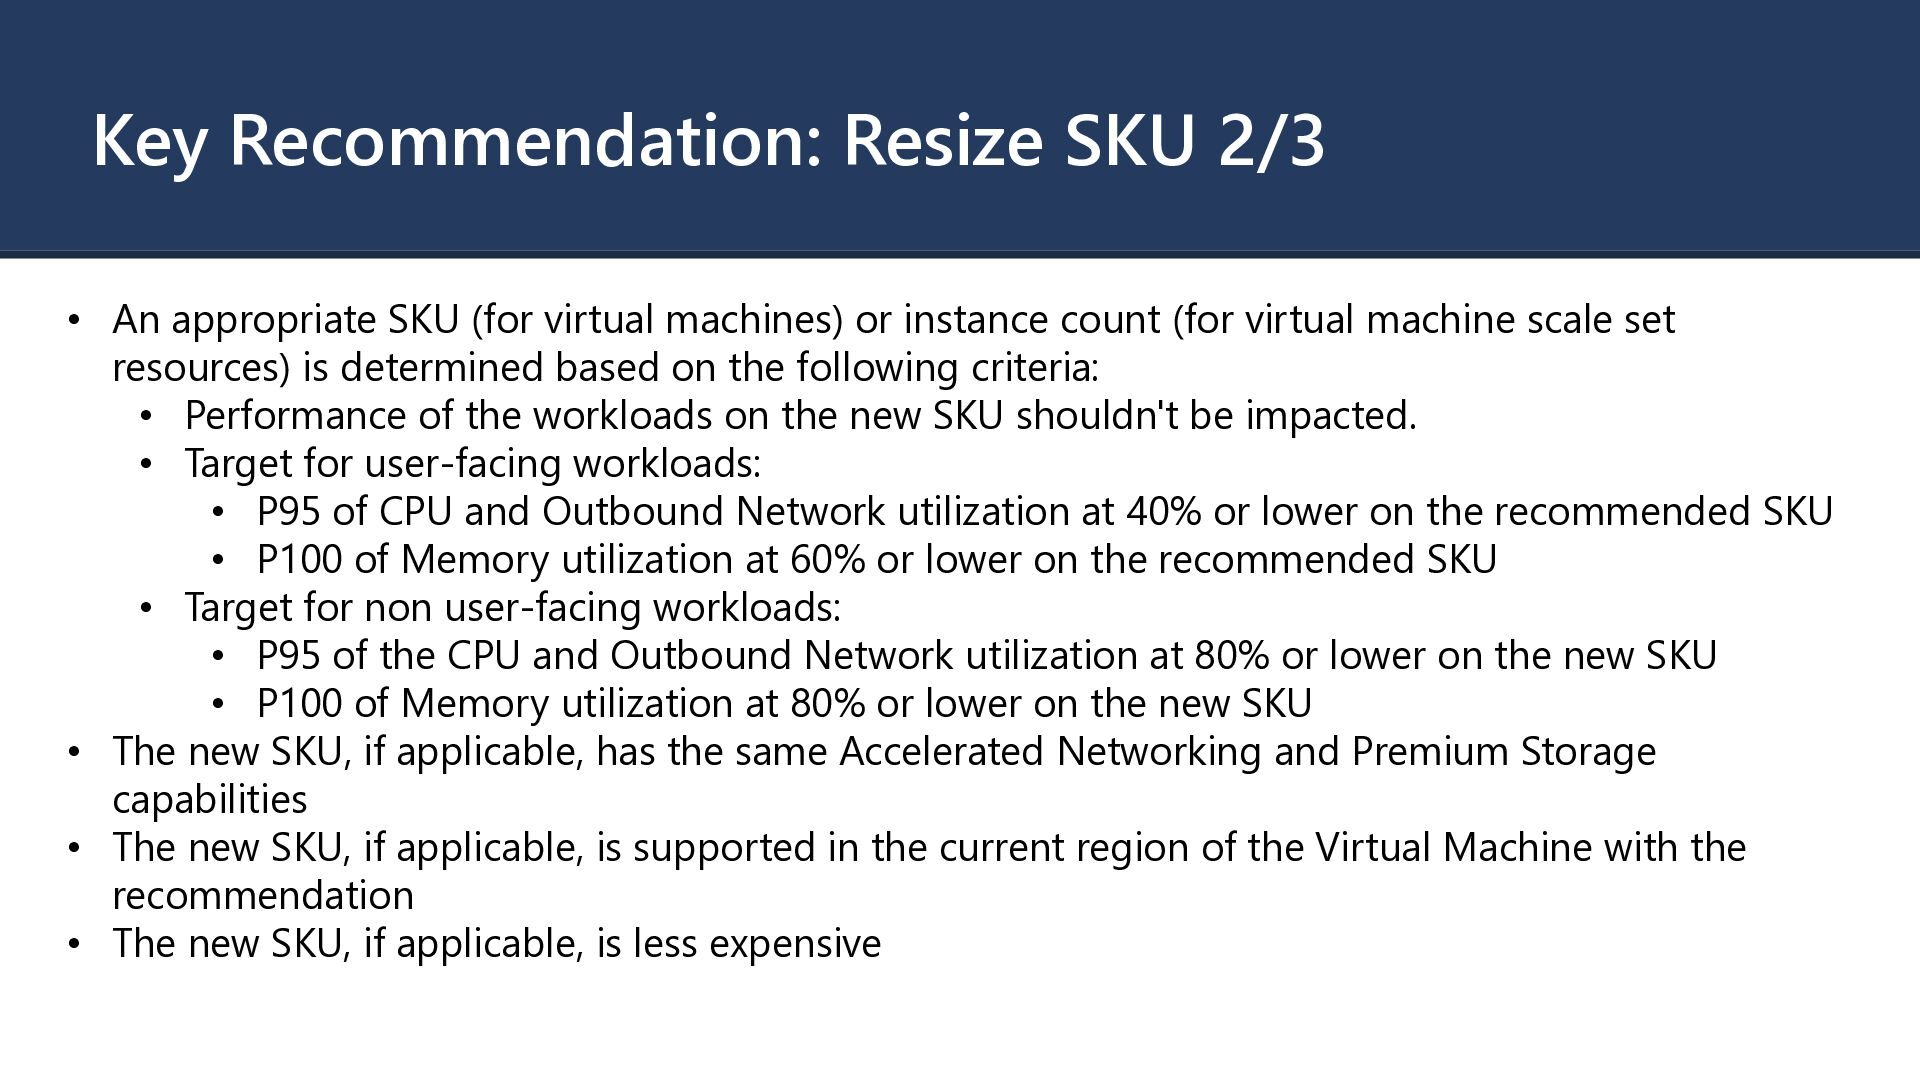
virtual machines) or instance count (for virtual machine scale set resources) is determined based on the following criteria: • Performance of the workloads on the new SKU shouldn't be impacted. • Target for user-facing workloads: • P95 of CPU and Outbound Network utilization at 40% or lower on the recommended SKU • P100 of Memory utilization at 60% or lower on the recommended SKU • Target for non user-facing workloads: • P95 of the CPU and Outbound Network utilization at 80% or lower on the new SKU • P100 of Memory utilization at 80% or lower on the new SKU • The new SKU, if applicable, has the same Accelerated Networking and Premium Storage capabilities • The new SKU, if applicable, is supported in the current region of the Virtual Machine with the recommendation • The new SKU, if applicable, is less expensive
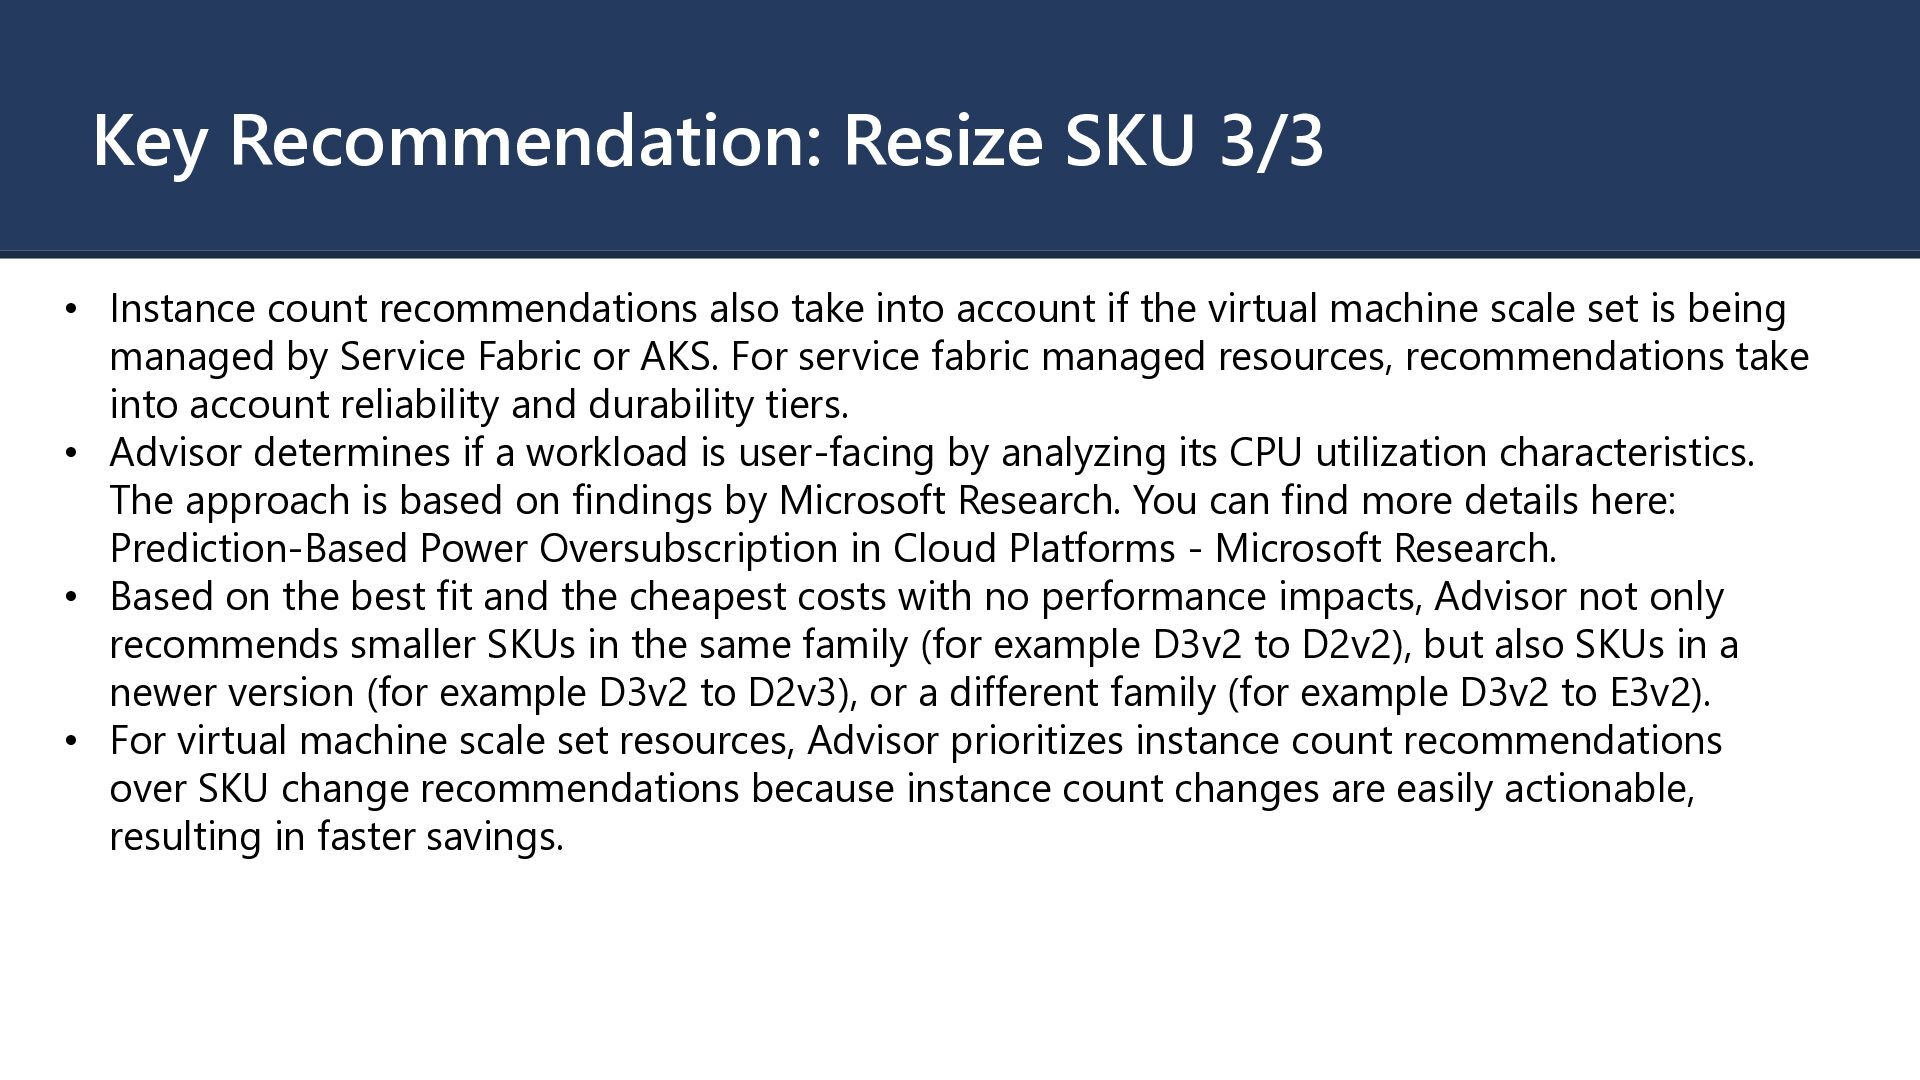
take into account if the virtual machine scale set is being managed by Service Fabric or AKS. For service fabric managed resources, recommendations take into account reliability and durability tiers. • Advisor determines if a workload is user-facing by analyzing its CPU utilization characteristics. The approach is based on findings by Microsoft Research. You can find more details here: Prediction-Based Power Oversubscription in Cloud Platforms - Microsoft Research. • Based on the best fit and the cheapest costs with no performance impacts, Advisor not only recommends smaller SKUs in the same family (for example D3v2 to D2v2), but also SKUs in a newer version (for example D3v2 to D2v3), or a different family (for example D3v2 to E3v2). • For virtual machine scale set resources, Advisor prioritizes instance count recommendations over SKU change recommendations because instance count changes are easily actionable, resulting in faster savings.
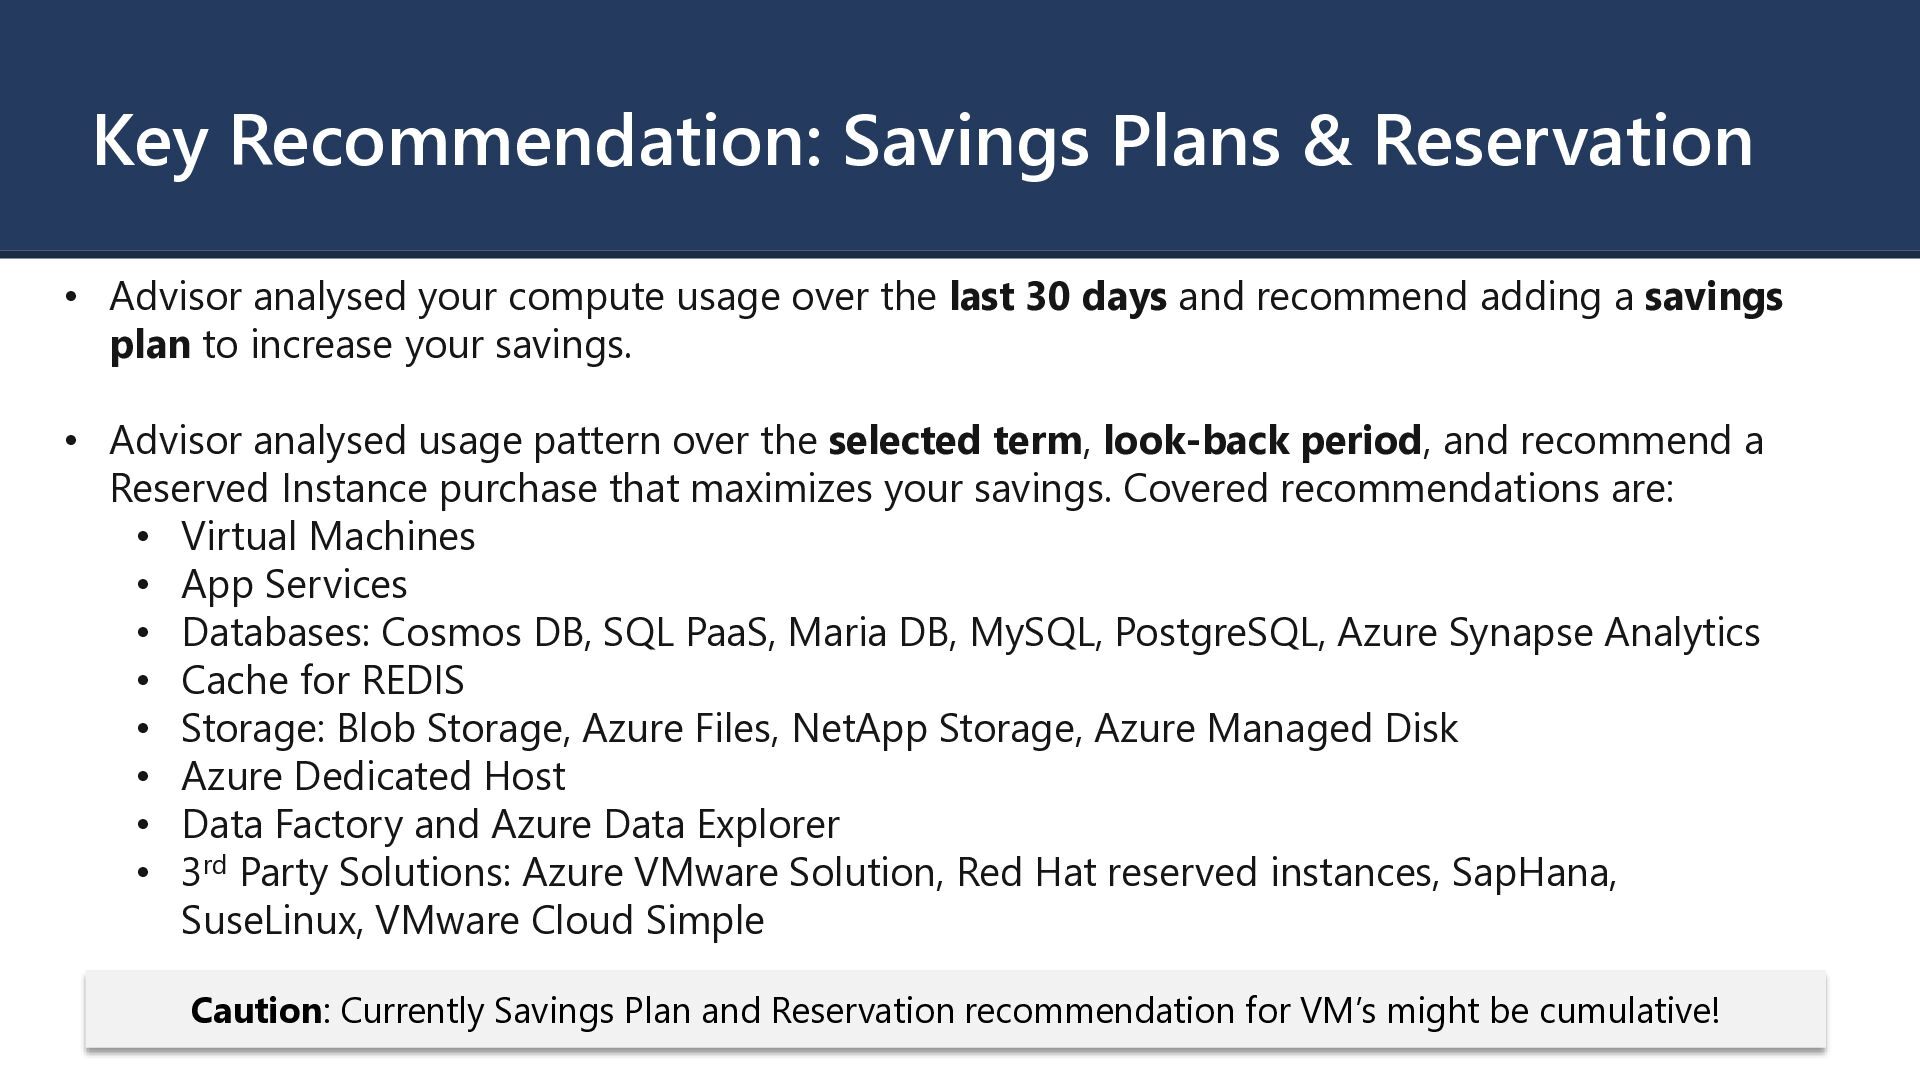
compute usage over the last 30 days and recommend adding a savings plan to increase your savings. • Advisor analysed usage pattern over the selected term, look-back period, and recommend a Reserved Instance purchase that maximizes your savings. Covered recommendations are: • Virtual Machines • App Services • Databases: Cosmos DB, SQL PaaS, Maria DB, MySQL, PostgreSQL, Azure Synapse Analytics • Cache for REDIS • Storage: Blob Storage, Azure Files, NetApp Storage, Azure Managed Disk • Azure Dedicated Host • Data Factory and Azure Data Explorer • 3rd Party Solutions: Azure VMware Solution, Red Hat reserved instances, SapHana, SuseLinux, VMware Cloud Simple Caution: Currently Savings Plan and Reservation recommendation for VM’s might be cumulative!
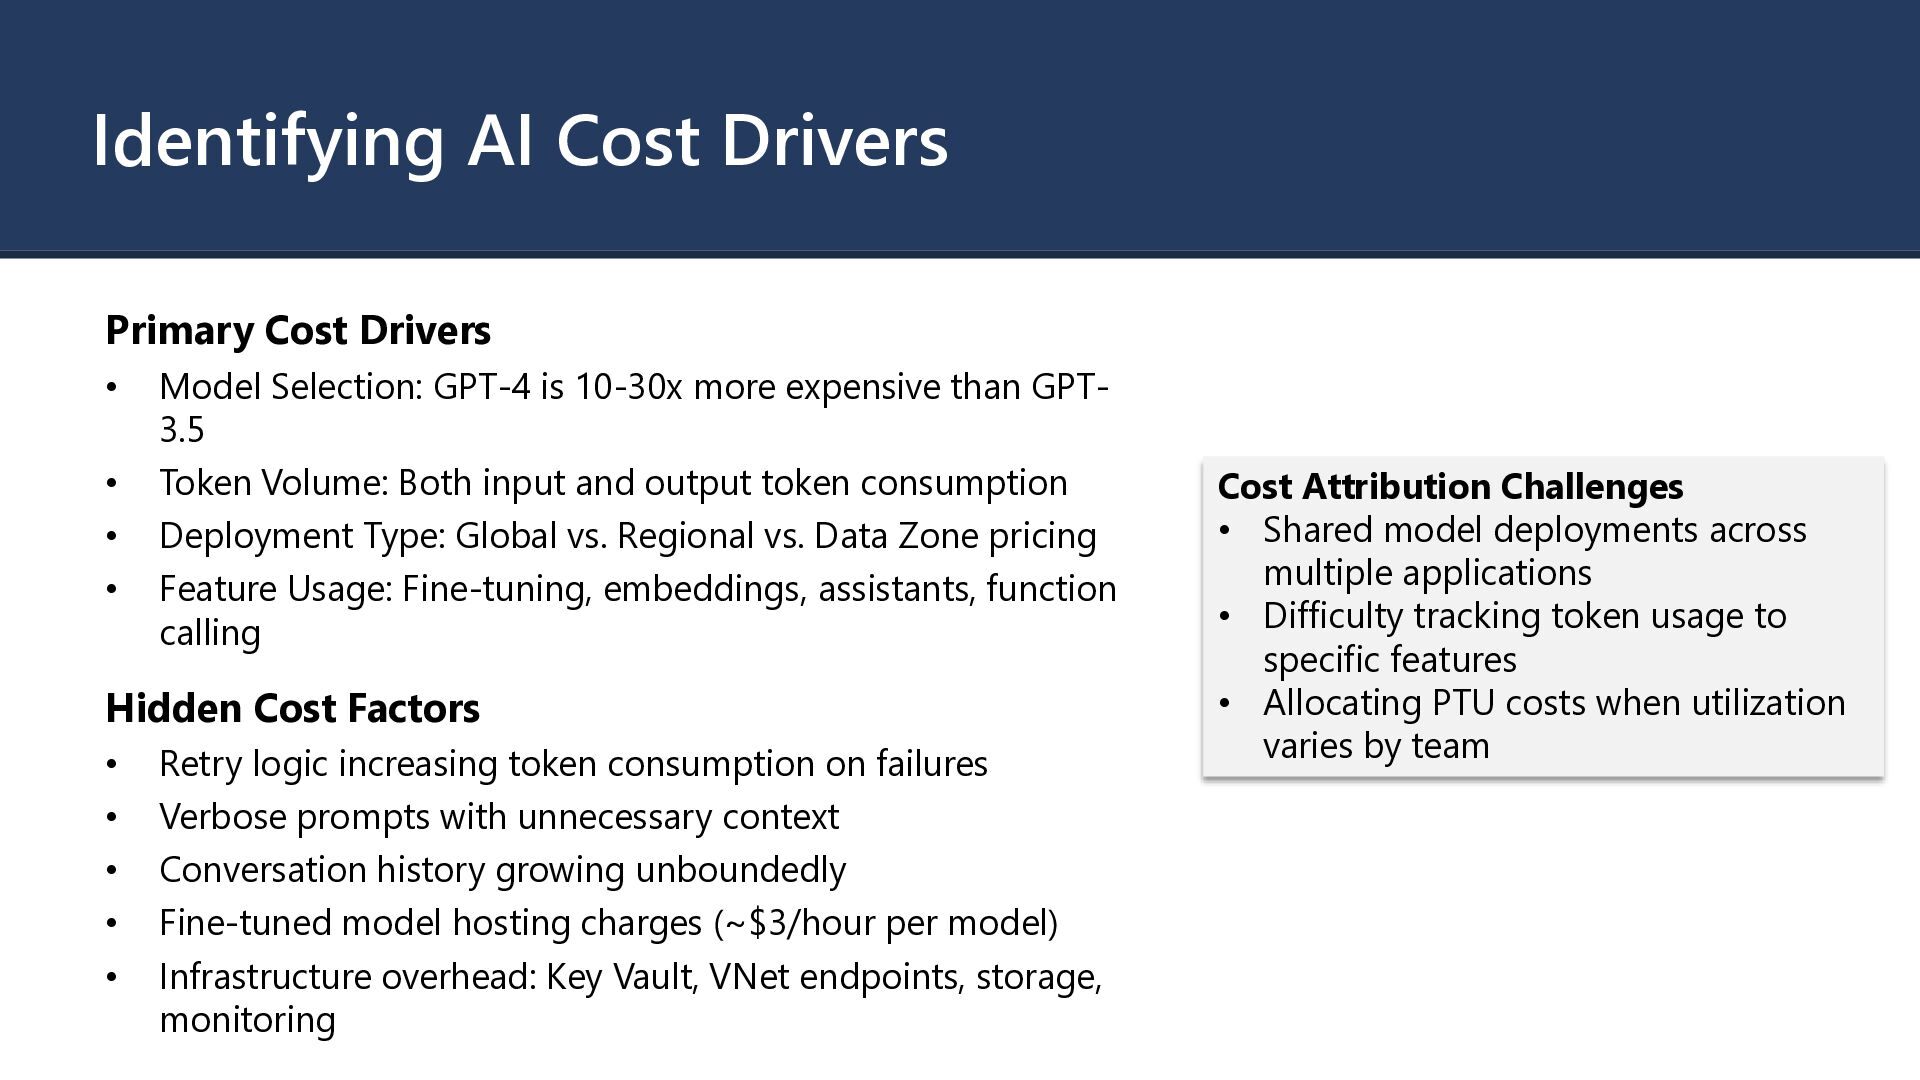
GPT-4 is 10-30x more expensive than GPT- 3.5 • Token Volume: Both input and output token consumption • Deployment Type: Global vs. Regional vs. Data Zone pricing • Feature Usage: Fine-tuning, embeddings, assistants, function calling Hidden Cost Factors • Retry logic increasing token consumption on failures • Verbose prompts with unnecessary context • Conversation history growing unboundedly • Fine-tuned model hosting charges (~$3/hour per model) • Infrastructure overhead: Key Vault, VNet endpoints, storage, monitoring Cost Attribution Challenges • Shared model deployments across multiple applications • Difficulty tracking token usage to specific features • Allocating PTU costs when utilization varies by team
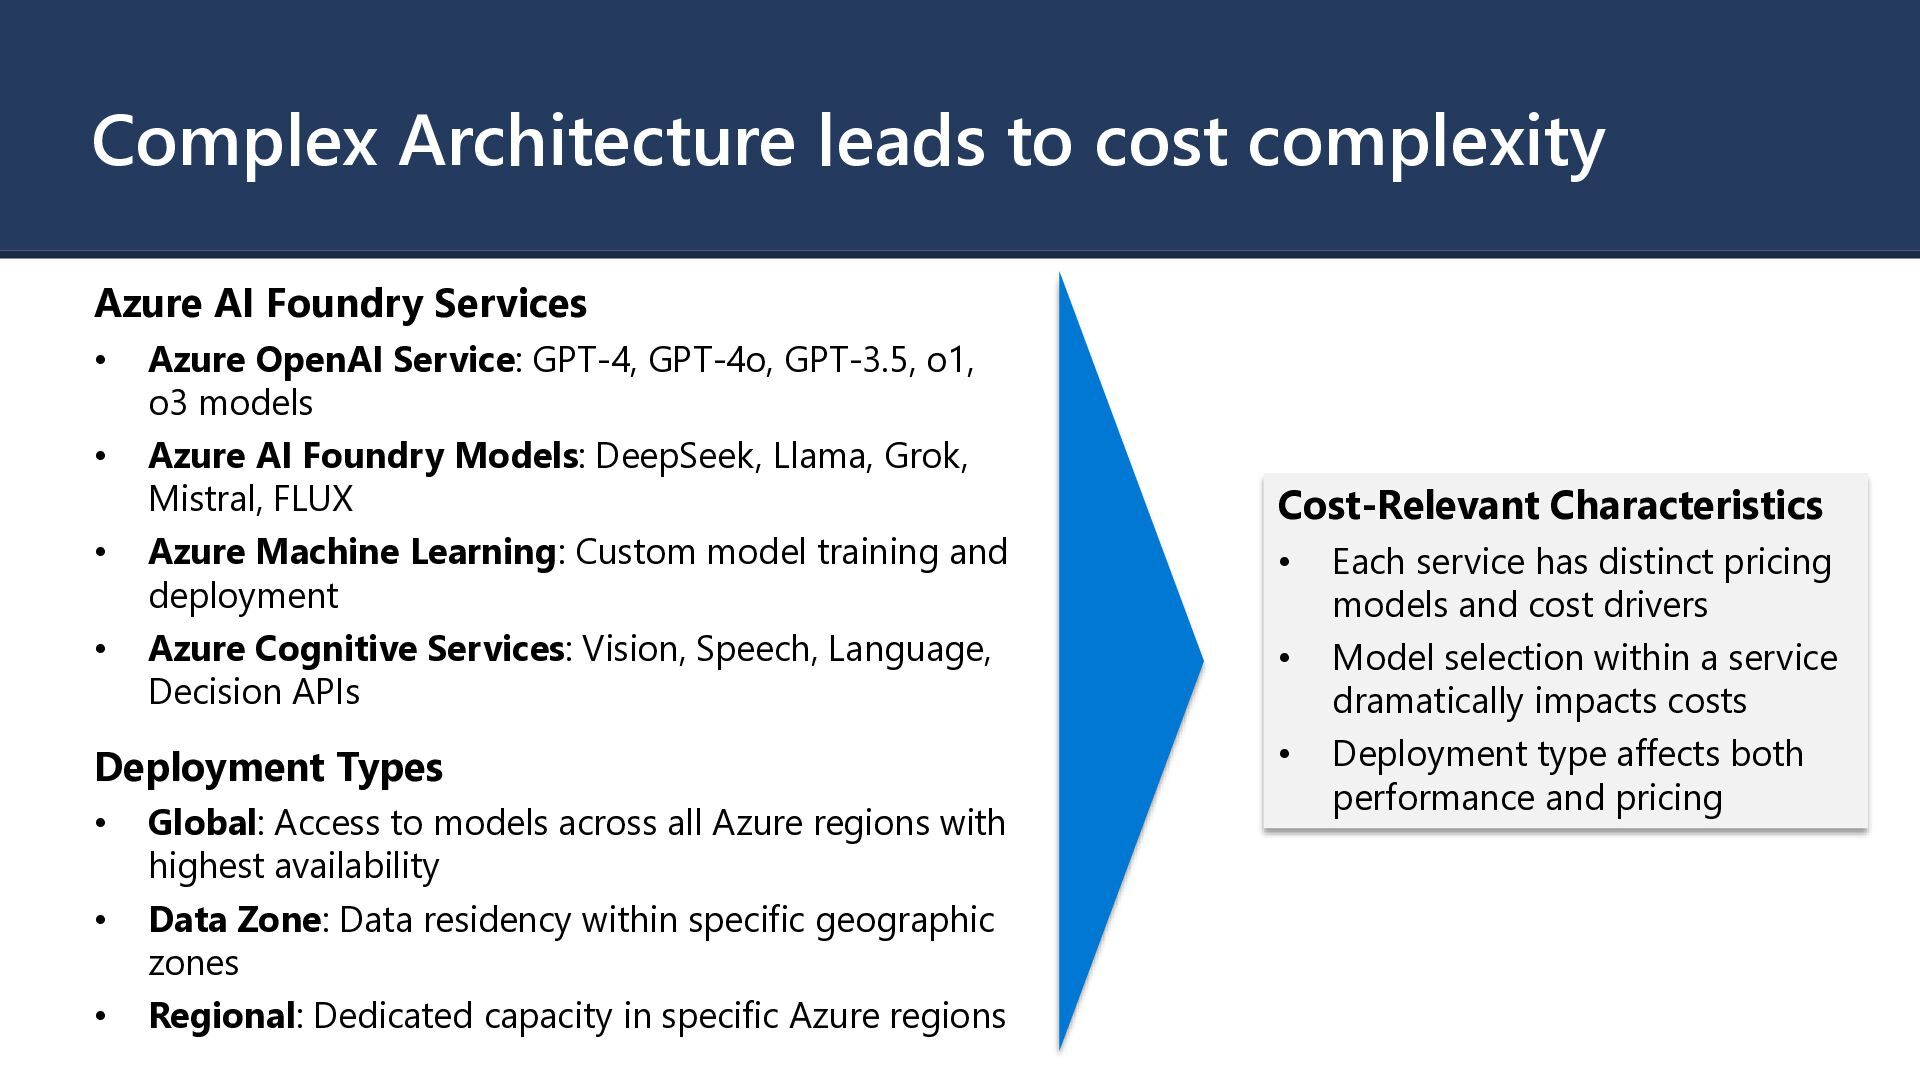
• Azure OpenAI Service: GPT-4, GPT-4o, GPT-3.5, o1, o3 models • Azure AI Foundry Models: DeepSeek, Llama, Grok, Mistral, FLUX • Azure Machine Learning: Custom model training and deployment • Azure Cognitive Services: Vision, Speech, Language, Decision APIs Deployment Types • Global: Access to models across all Azure regions with highest availability • Data Zone: Data residency within specific geographic zones • Regional: Dedicated capacity in specific Azure regions Cost-Relevant Characteristics • Each service has distinct pricing models and cost drivers • Model selection within a service dramatically impacts costs • Deployment type affects both performance and pricing
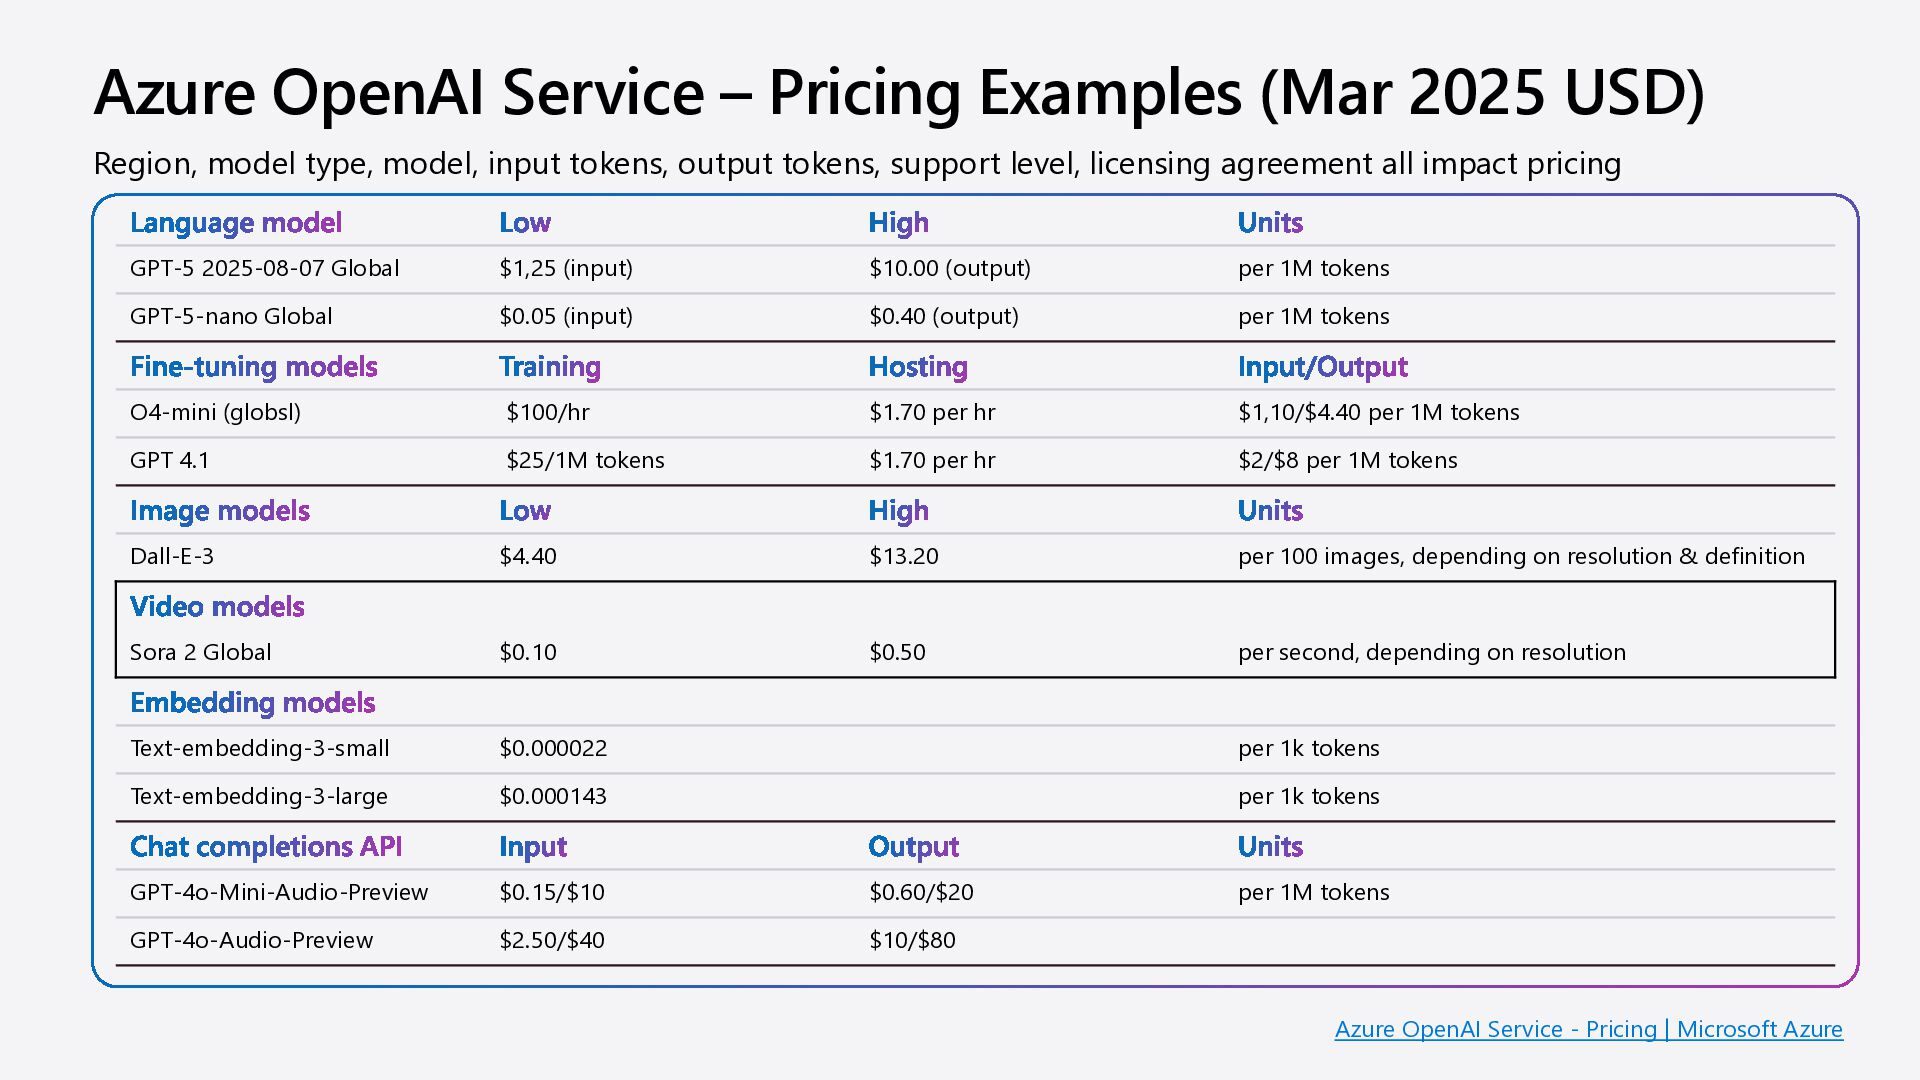
model Low High Units GPT-5 2025-08-07 Global $1,25 (input) $10.00 (output) per 1M tokens GPT-5-nano Global $0.05 (input) $0.40 (output) per 1M tokens Fine-tuning models Training Hosting Input/Output O4-mini (globsl) $100/hr $1.70 per hr $1,10/$4.40 per 1M tokens GPT 4.1 $25/1M tokens $1.70 per hr $2/$8 per 1M tokens Image models Low High Units Dall-E-3 $4.40 $13.20 per 100 images, depending on resolution & definition Video models Sora 2 Global $0.10 $0.50 per second, depending on resolution Embedding models Text-embedding-3-small $0.000022 per 1k tokens Text-embedding-3-large $0.000143 per 1k tokens Chat completions API Input Output Units GPT-4o-Mini-Audio-Preview $0.15/$10 $0.60/$20 per 1M tokens GPT-4o-Audio-Preview $2.50/$40 $10/$80 Region, model type, model, input tokens, output tokens, support level, licensing agreement all impact pricing Azure OpenAI Service - Pricing | Microsoft Azure
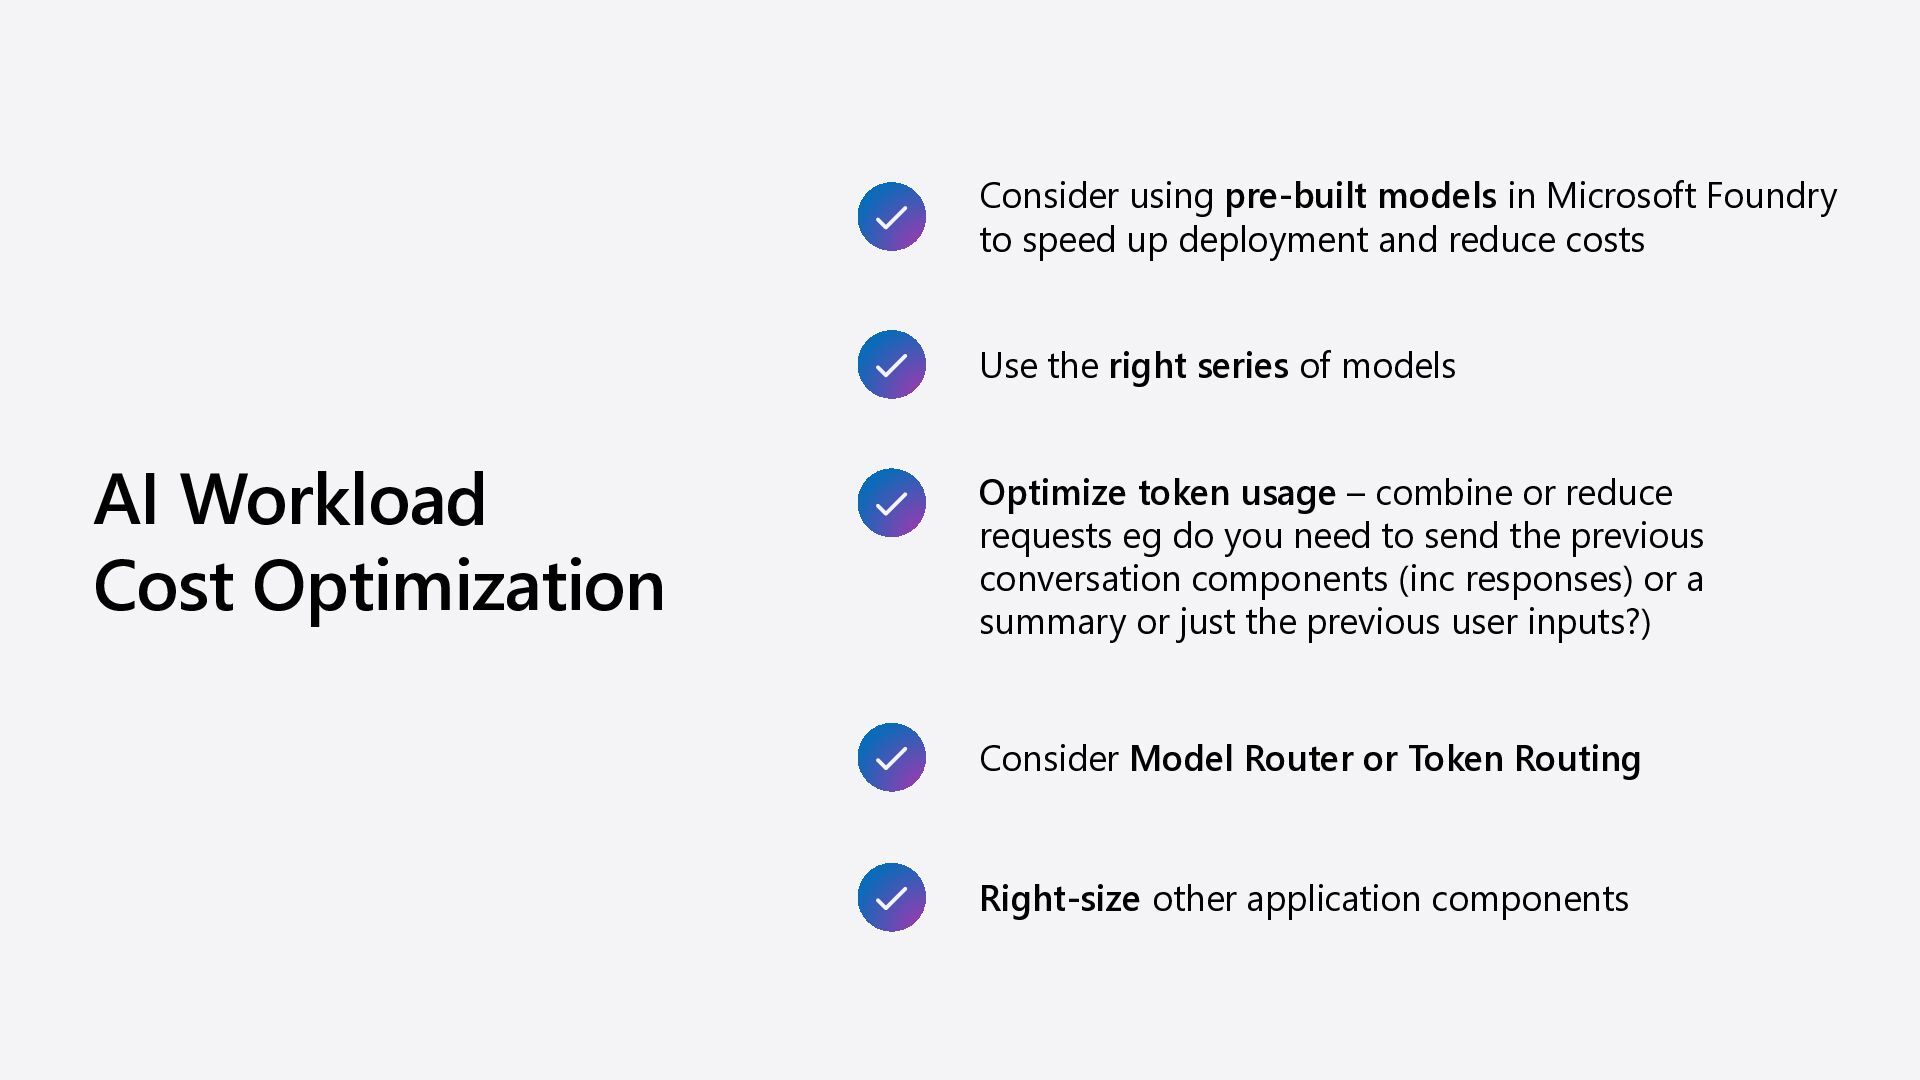
Foundry to speed up deployment and reduce costs Use the right series of models Optimize token usage – combine or reduce requests eg do you need to send the previous conversation components (inc responses) or a summary or just the previous user inputs?) Right-size other application components Consider Model Router or Token Routing
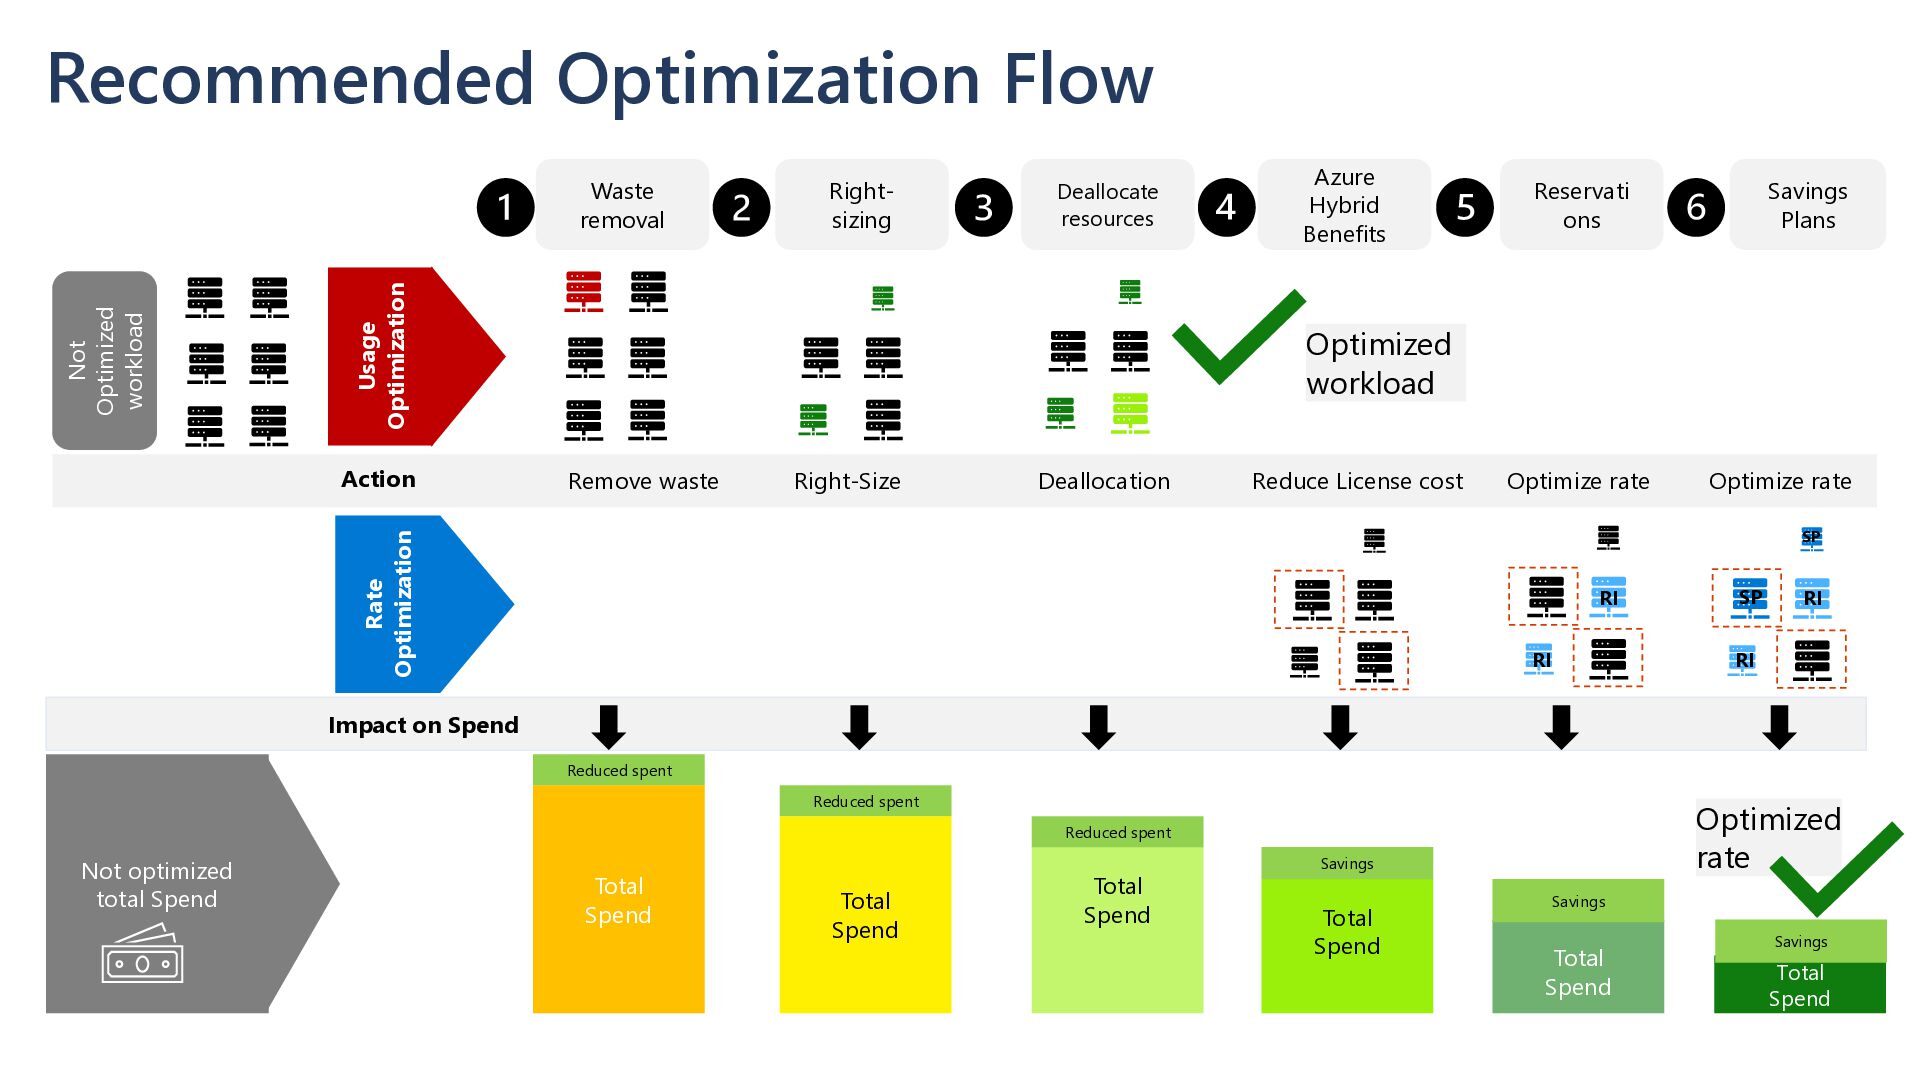
resources Right- sizing Azure Hybrid Benefits Usage Optimization Rate Optimization Remove waste Action Not optimized total Spend Total Spend Reduce License cost Optimize rate Total Spend Reduced spent Not Optimized workload Total Spend Right-Size Reduced spent Total Spend Reduced spent Savings Total Spend Savings Total Spend Savings Deallocation Impact on Spend Optimize rate Optimized workload Optimized rate RI RI SP SP RI RI
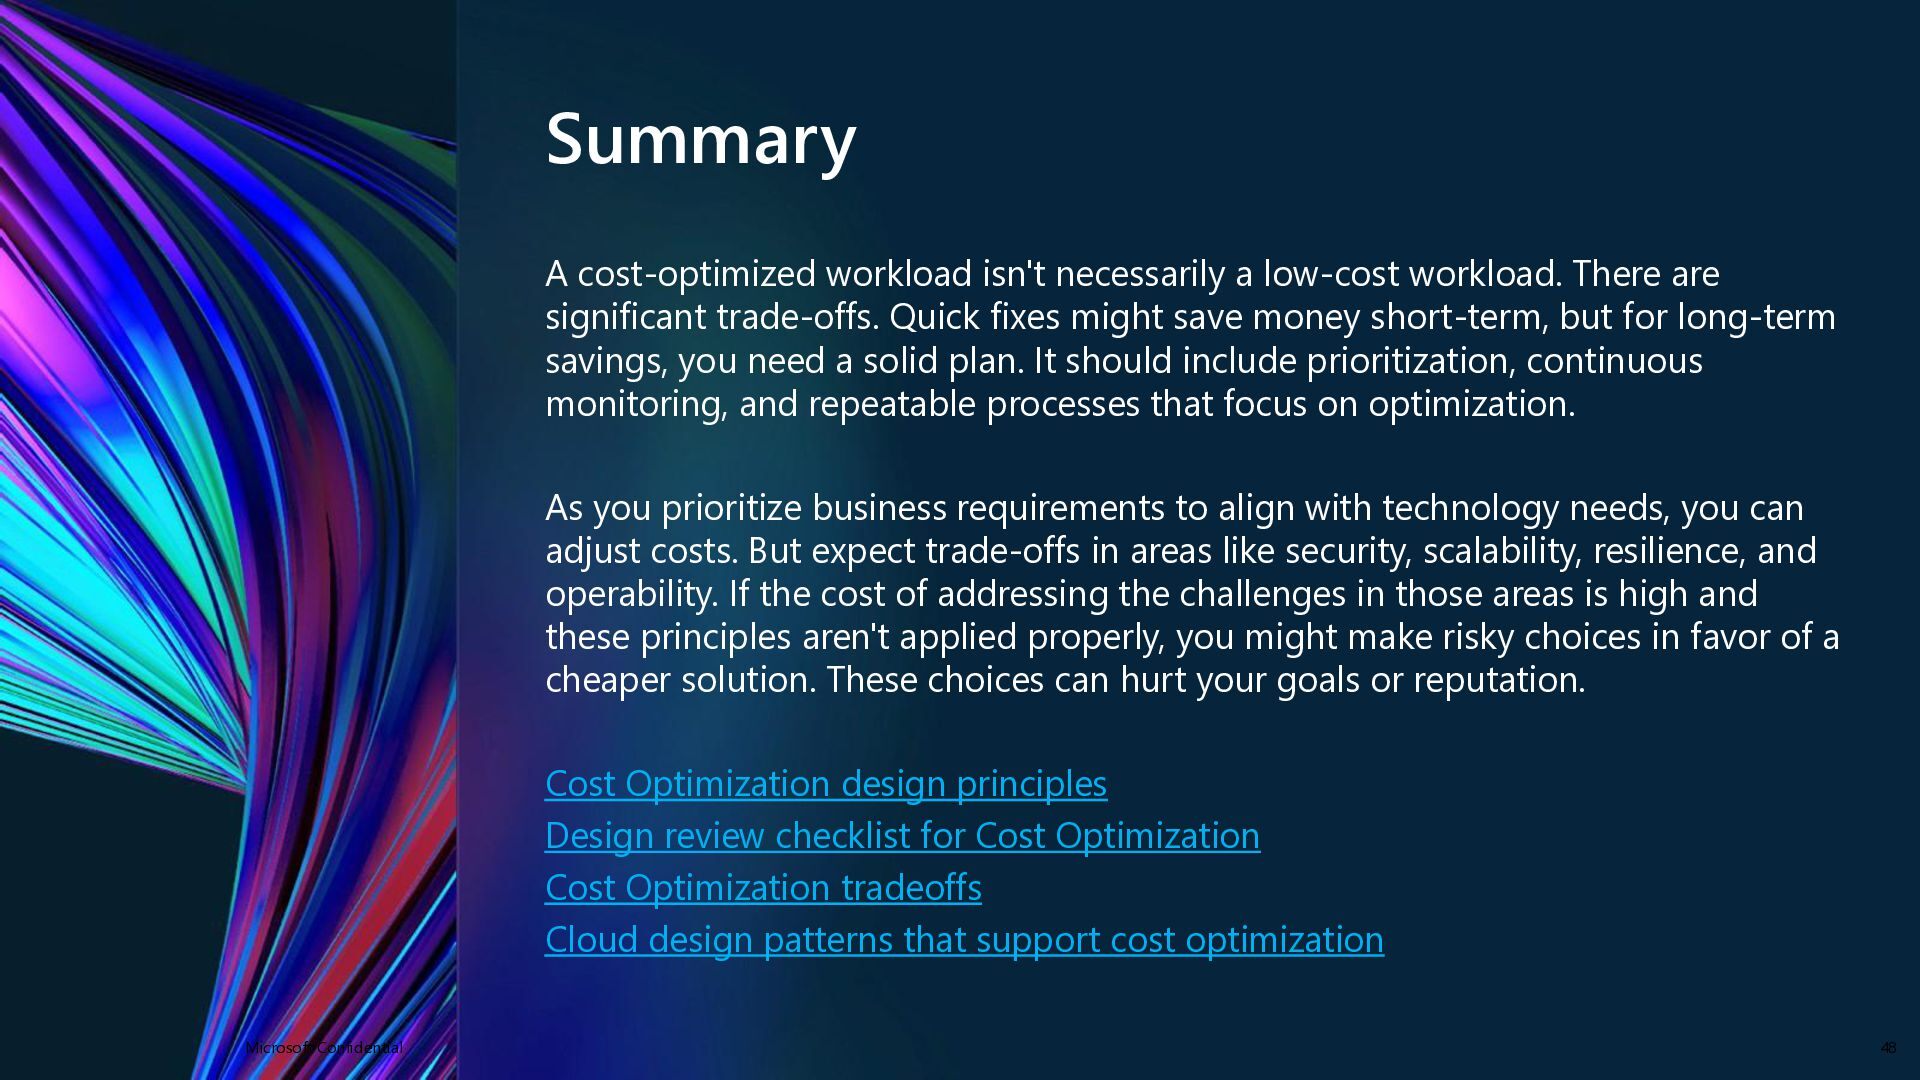
are significant trade-offs. Quick fixes might save money short-term, but for long-term savings, you need a solid plan. It should include prioritization, continuous monitoring, and repeatable processes that focus on optimization. As you prioritize business requirements to align with technology needs, you can adjust costs. But expect trade-offs in areas like security, scalability, resilience, and operability. If the cost of addressing the challenges in those areas is high and these principles aren't applied properly, you might make risky choices in favor of a cheaper solution. These choices can hurt your goals or reputation. Cost Optimization design principles Design review checklist for Cost Optimization Cost Optimization tradeoffs Cloud design patterns that support cost optimization Microsoft Confidential 48
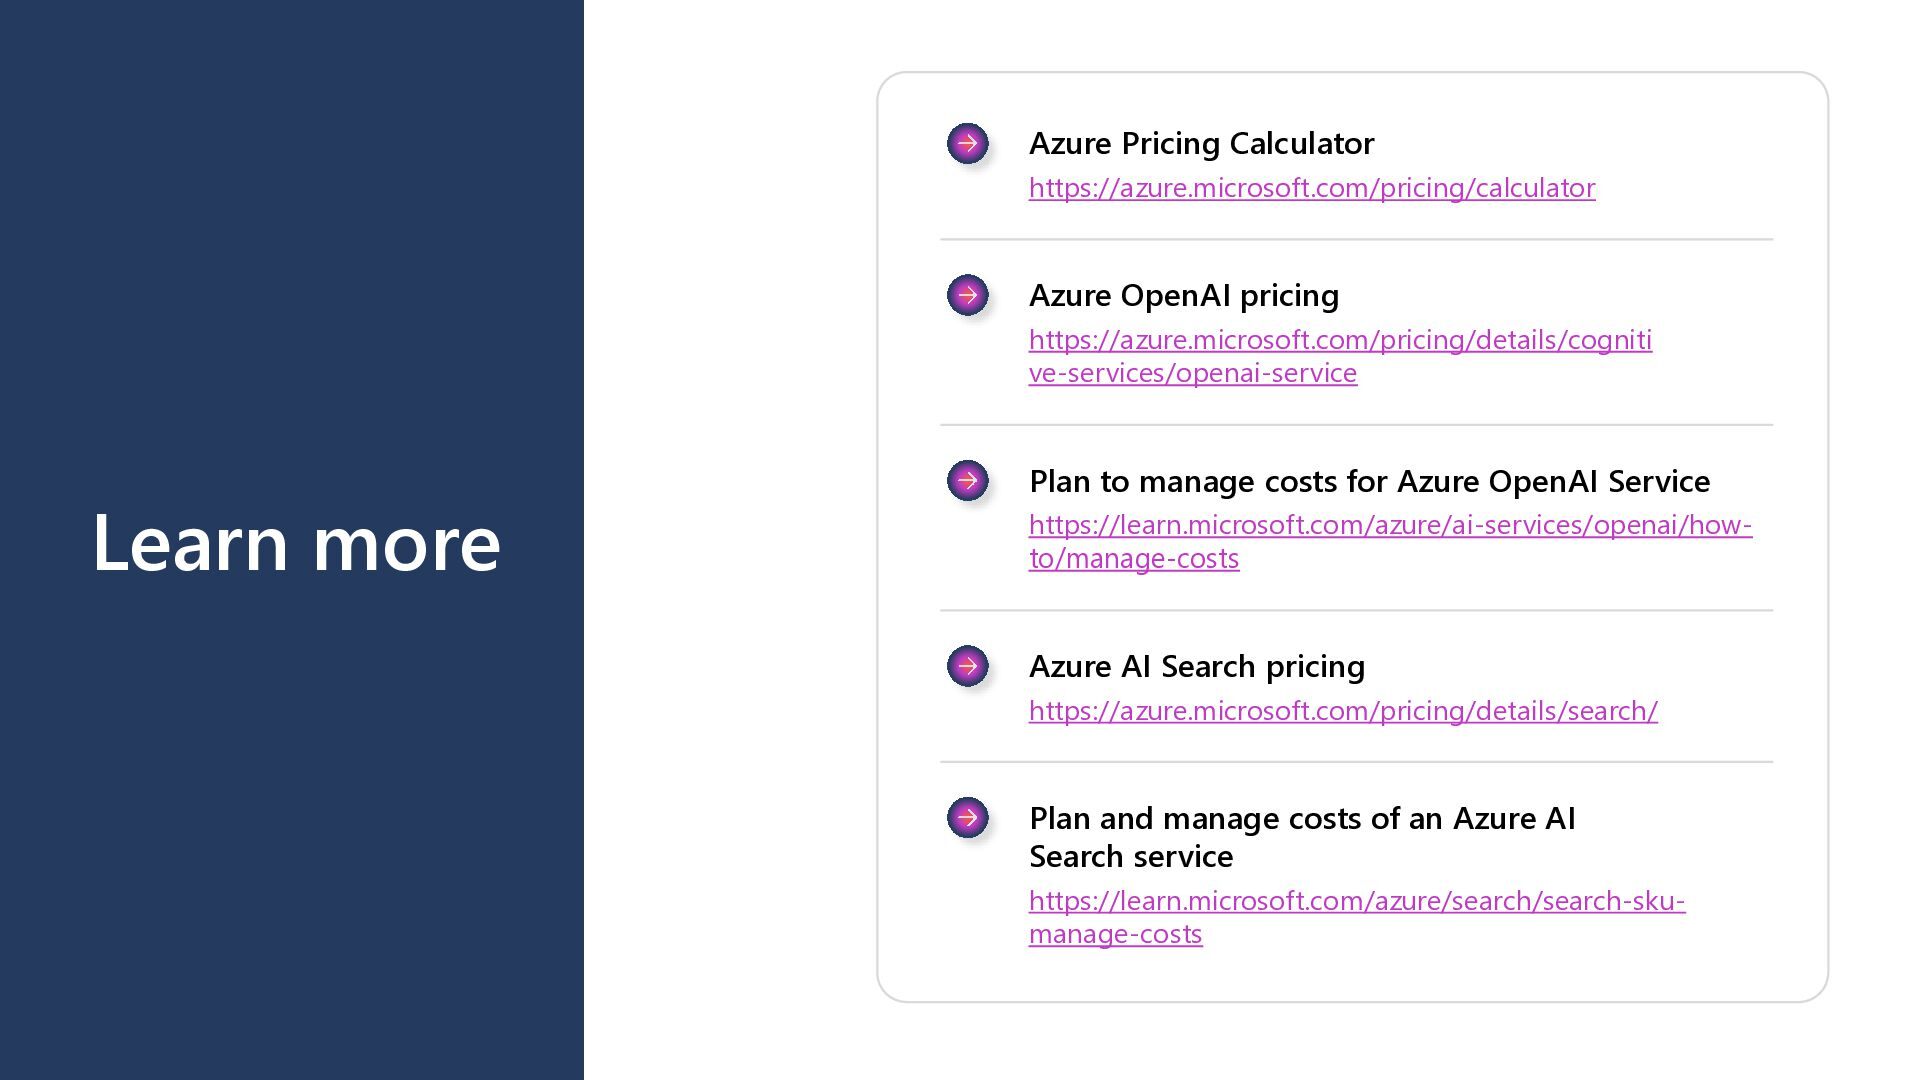
https://azure.microsoft.com/pricing/details/cogniti ve-services/openai-service Plan to manage costs for Azure OpenAI Service https://learn.microsoft.com/azure/ai-services/openai/how- to/manage-costs Azure AI Search pricing https://azure.microsoft.com/pricing/details/search/ Plan and manage costs of an Azure AI Search service https://learn.microsoft.com/azure/search/search-sku- manage-costs
understand-cost-management-ai/ Establishing cost management practices for AI https://learn.microsoft.com/training/modules/e stablish-ai-cost-management-practices/ Manage cost efficiency of Azure and AI investments https://aka.ms/AzureEssentialsCostEfficiency Maximize the cost efficiency of AI Agents on Azure https://aka.ms/Learn-CostEfficientAIAgents