Share
Embed
2025 LIBD lcolladotor data science team TL;DR
A recap of recent work from our R Bioconductor-powered Team Data Science group at the Lieber Institute for Data Science.
Team website: https://lcolladotor.github.io/
Topics Presented & Presenters:
1. Spatially Resolved Transcriptomics with Visium - Manisha Barse
2. Visium HD data analysis - Nick Eagles
3. sc/snRNA-seq data analysis - Melissa Mayén Quiroz
4. Multi-ome data analysis - Cynthia Soto Cardinault
5. Bulk RNA-seq deconvolution - Louise Huuki-Myers
6. Bulk RNA-seq data analysis - Louise Huuki-Myers & Nick Eagles
7. qsvaR - Nick Eagles
8. CHESS-Brain - Geo Pertea
9. Open Source Software Development - Nick Eagles
10. JHPCE - Nick Eagles
11. LIBD rstats & journal clubs - Nick Eages
Louise Huuki-Myers
January 29, 2025
Transcript
71 slides
-
@lcolladotor.bsky.social lcolladotor.github.io lcolladotor.github.io/bioc_team_ds R Bioconductor-powered Team Data Science Data Science
Team 1, Translational Neuroscience Division Leonardo Collado Torres, LIBD Investigator + Asst. Prof. Johns Hopkins Biostatistics January 29th, 2025 Slides available at speakerdeck.com/lcolladotor Orchestrated By Louise Huuki-Myers -
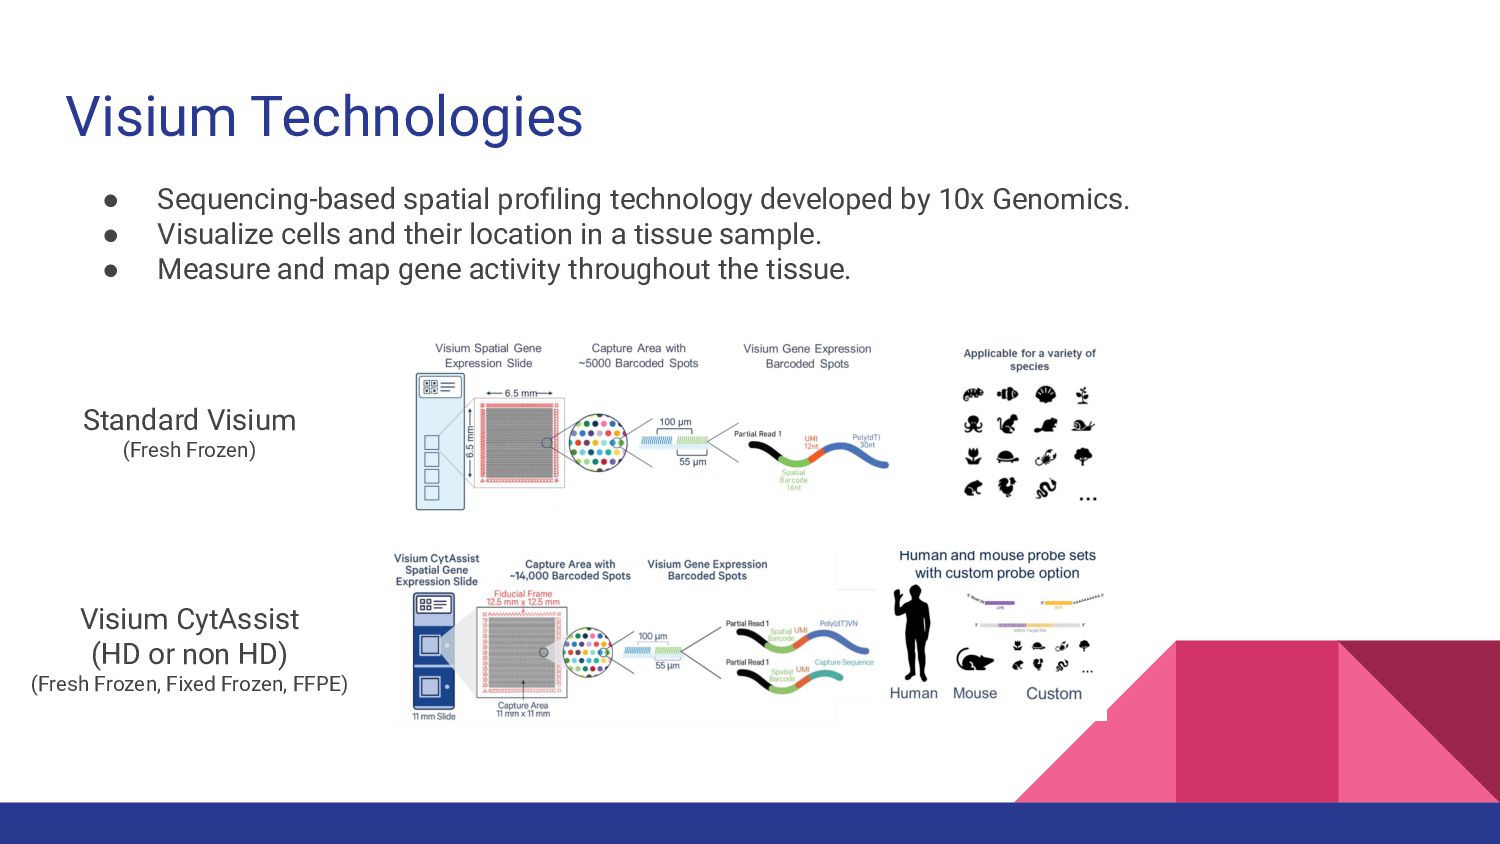
Visium Technologies Standard Visium (Fresh Frozen) Visium CytAssist (HD or
non HD) (Fresh Frozen, Fixed Frozen, FFPE) • Sequencing-based spatial profiling technology developed by 10x Genomics. • Visualize cells and their location in a tissue sample. • Measure and map gene activity throughout the tissue. -
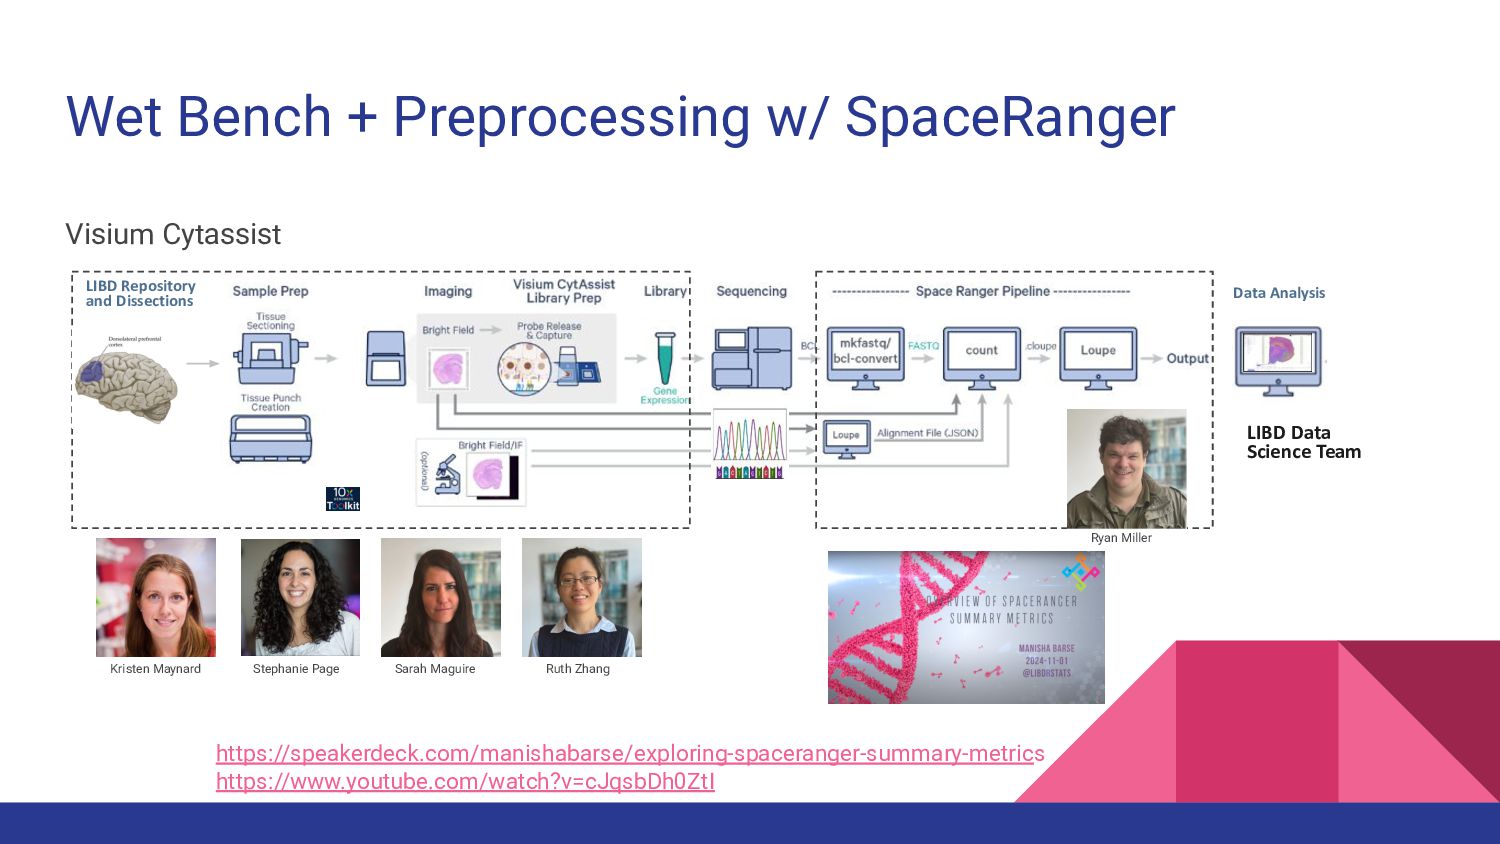
Wet Bench + Preprocessing w/ SpaceRanger Visium Cytassist LIBD Repository
and Dissections Kristen Maynard Stephanie Page Sarah Maguire Ruth Zhang Ryan Miller Data Analysis https://speakerdeck.com/manishabarse/exploring-spaceranger-summary-metrics https://www.youtube.com/watch?v=cJqsbDh0ZtI LIBD Data Science Team -
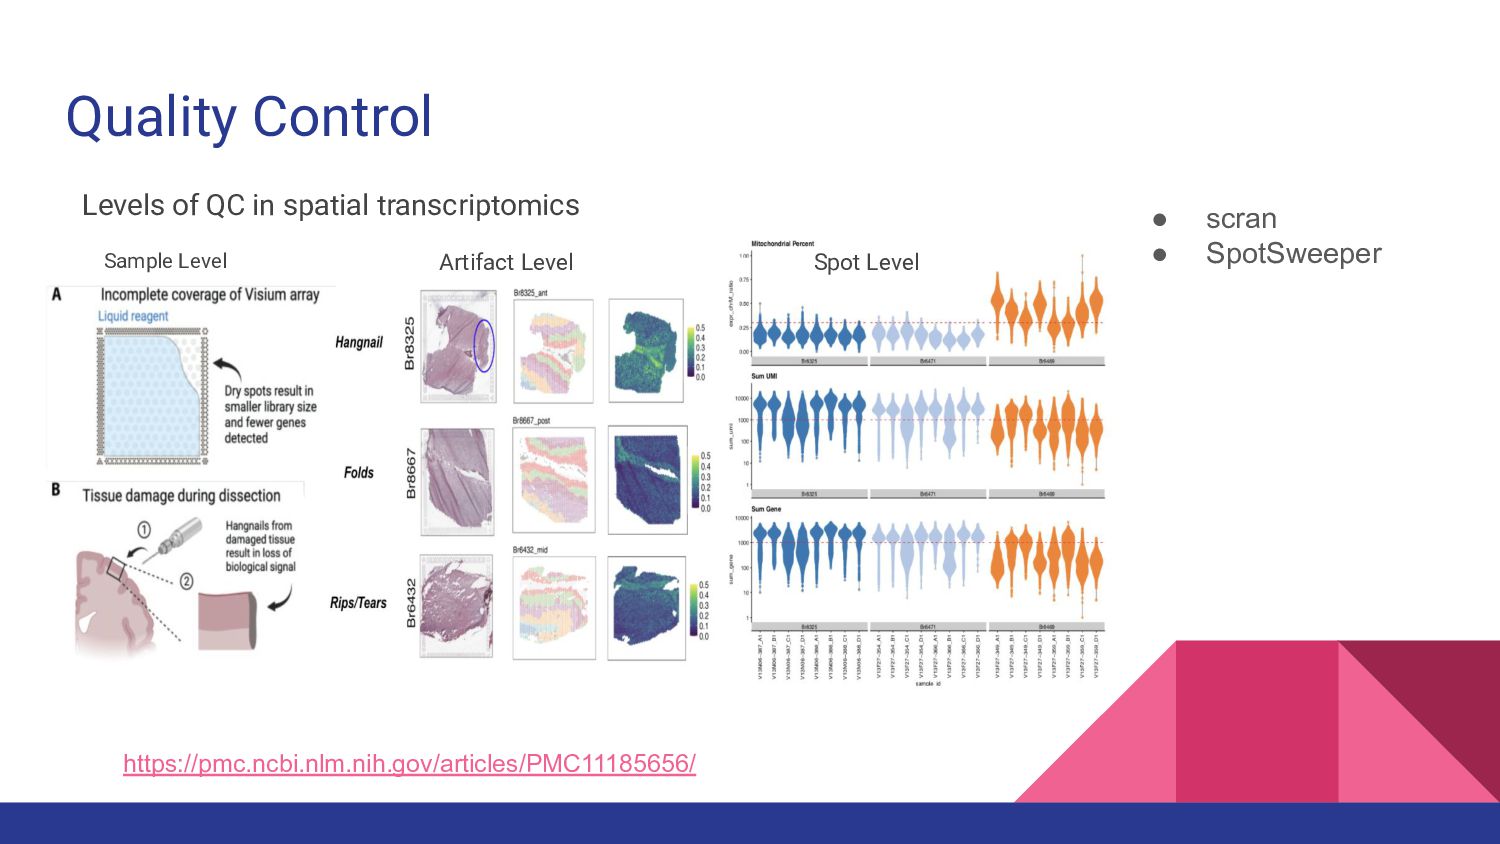
Quality Control Levels of QC in spatial transcriptomics Artifact Level
Spot Level https://pmc.ncbi.nlm.nih.gov/articles/PMC11185656/ Sample Level • scran • SpotSweeper -
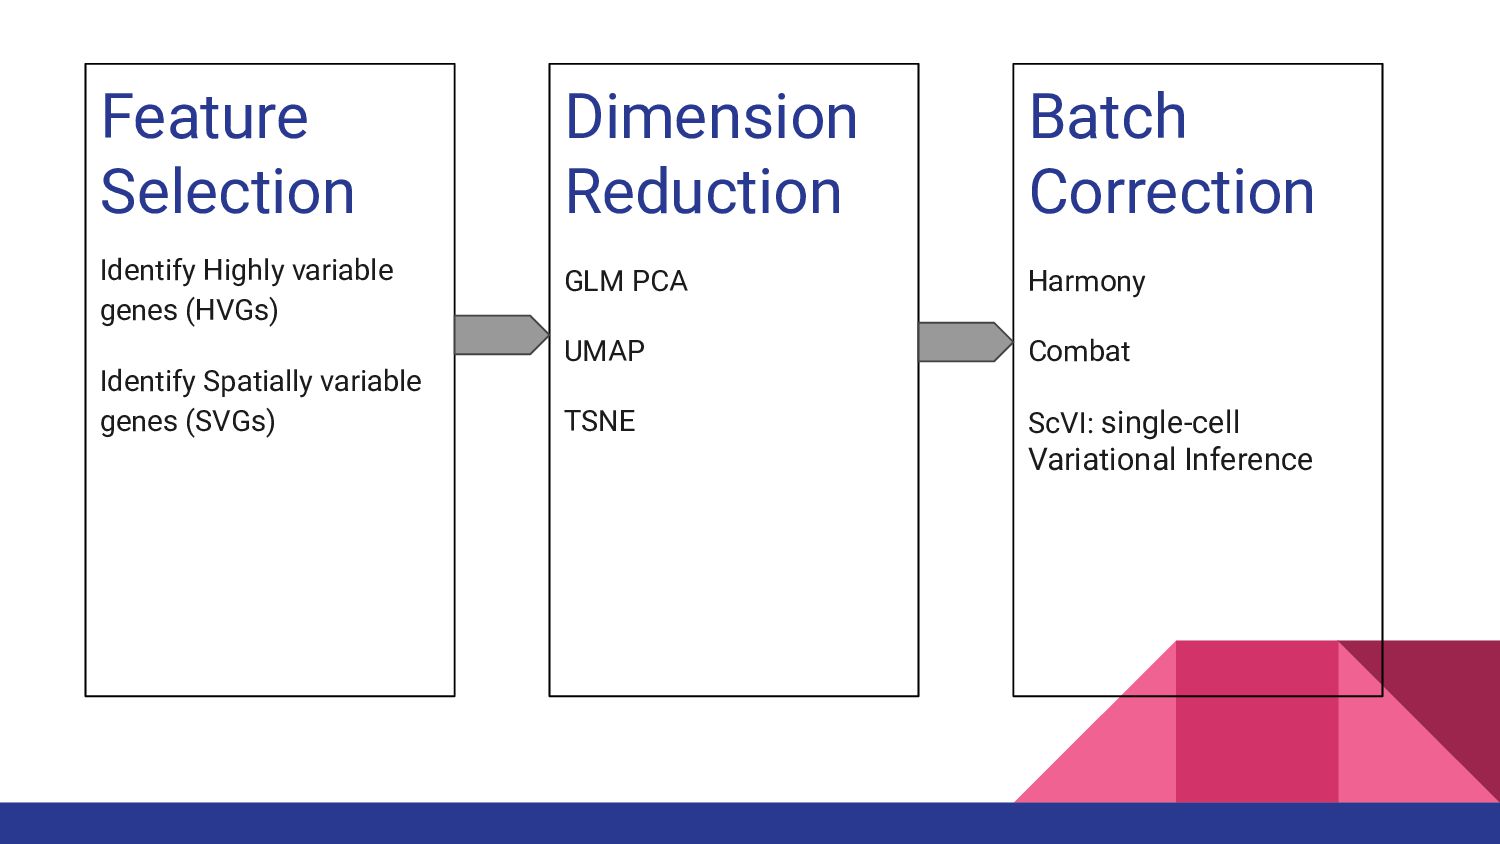
Feature Selection Identify Highly variable genes (HVGs) Identify Spatially variable
genes (SVGs) Dimension Reduction GLM PCA UMAP TSNE Batch Correction Harmony Combat ScVI: single-cell Variational Inference -
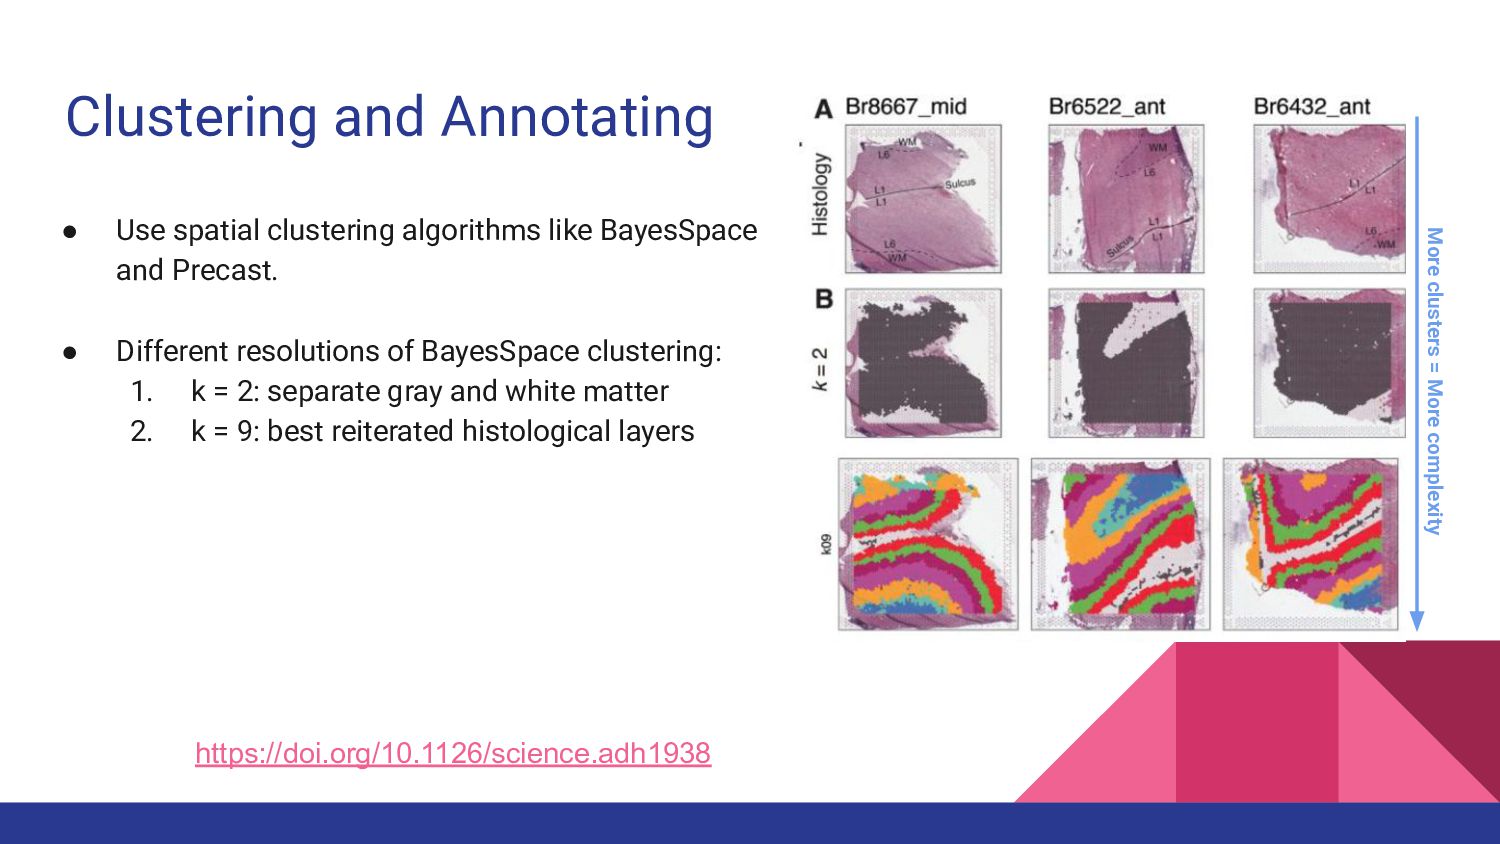
Clustering and Annotating • Use spatial clustering algorithms like BayesSpace
and Precast. • Different resolutions of BayesSpace clustering: 1. k = 2: separate gray and white matter 2. k = 9: best reiterated histological layers https://doi.org/10.1126/science.adh1938 More clusters = More complexity -
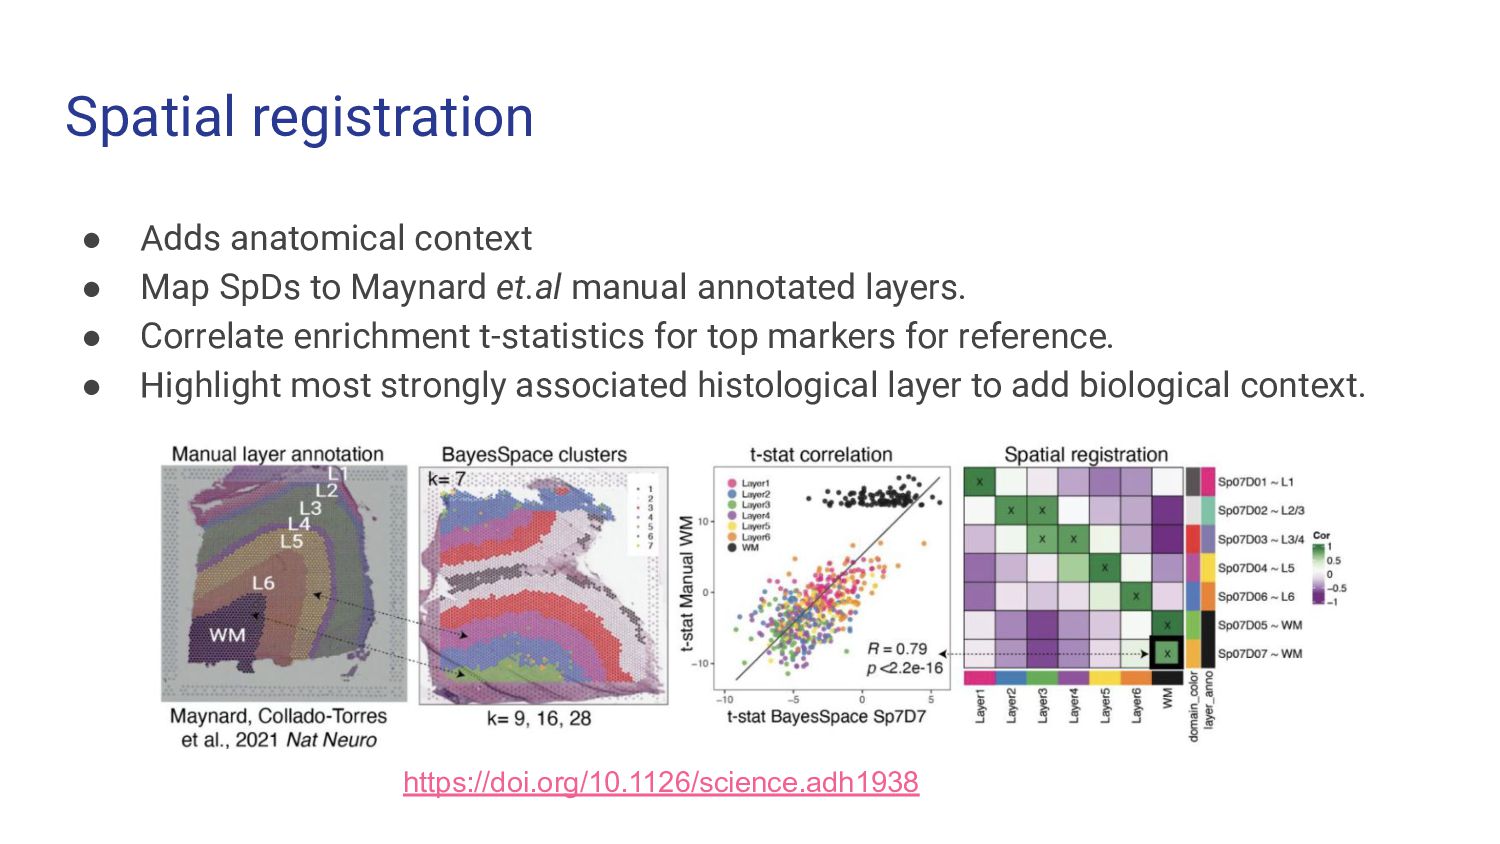
Spatial registration • Adds anatomical context • Map SpDs to
Maynard et.al manual annotated layers. • Correlate enrichment t-statistics for top markers for reference. • Highlight most strongly associated histological layer to add biological context. https://doi.org/10.1126/science.adh1938 -
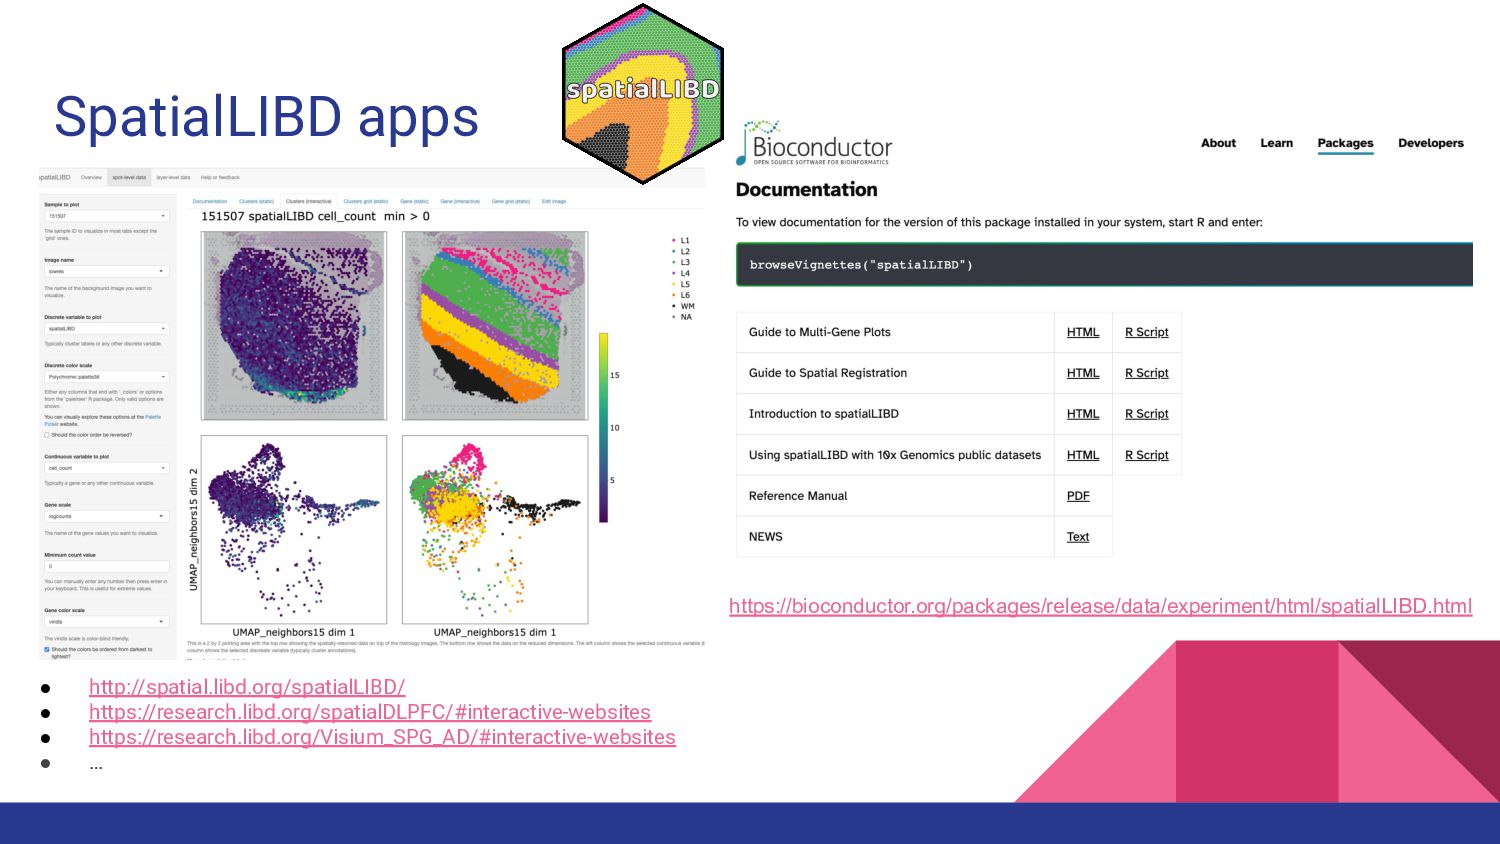
SpatialLIBD apps • http://spatial.libd.org/spatialLIBD/ • https://research.libd.org/spatialDLPFC/#interactive-websites • https://research.libd.org/Visium_SPG_AD/#interactive-websites • …
https://bioconductor.org/packages/release/data/experiment/html/spatialLIBD.html -
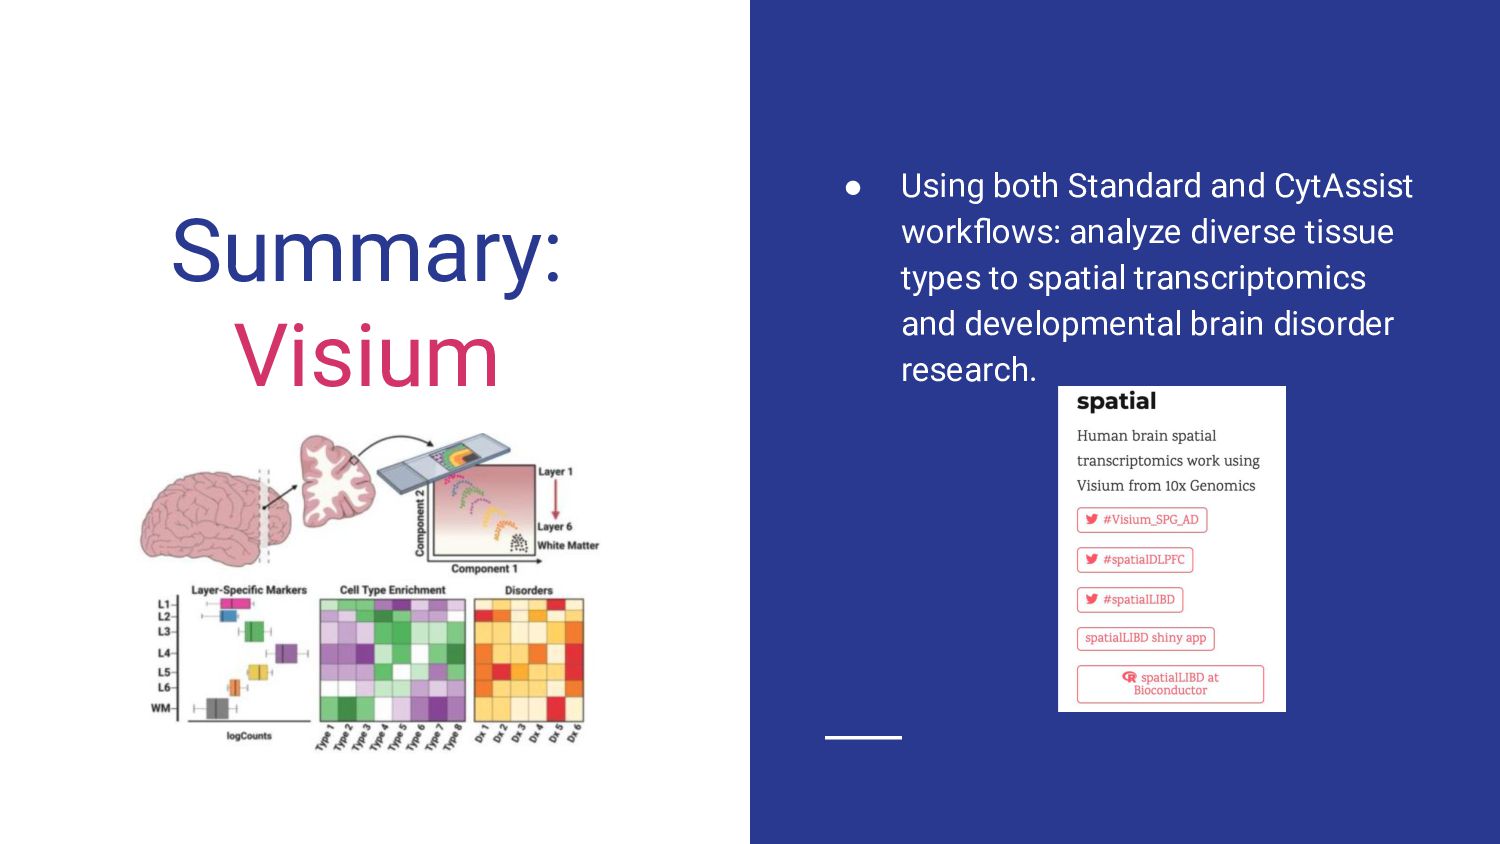
Summary: Visium • Using both Standard and CytAssist workflows: analyze
diverse tissue types to spatial transcriptomics and developmental brain disorder research. -
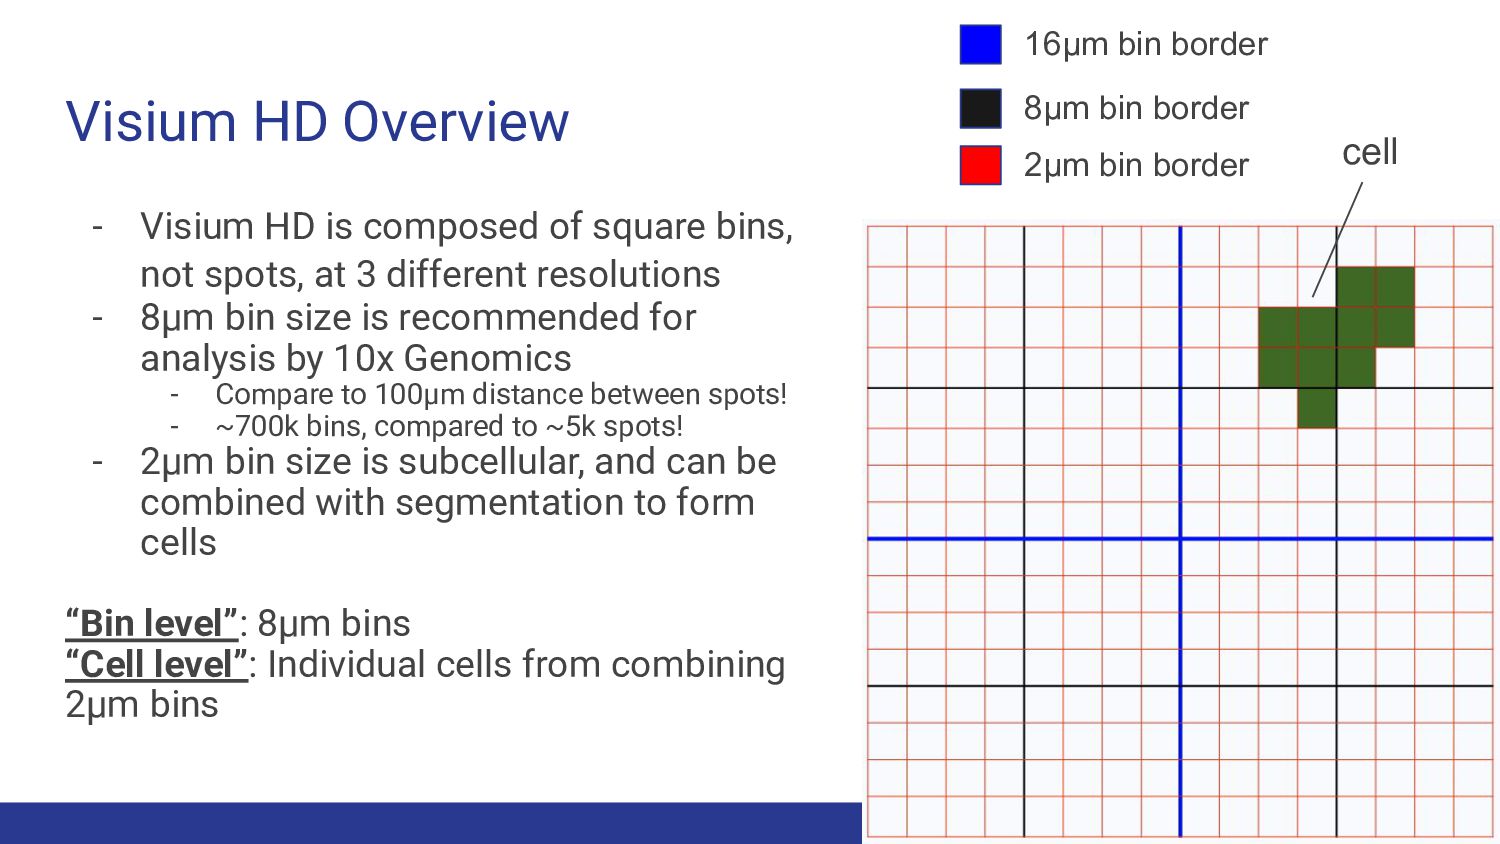
Visium HD Overview - Visium HD is composed of square
bins, not spots, at 3 different resolutions - 8μm bin size is recommended for analysis by 10x Genomics - Compare to 100μm distance between spots! - ~700k bins, compared to ~5k spots! - 2μm bin size is subcellular, and can be combined with segmentation to form cells “Bin level”: 8μm bins “Cell level”: Individual cells from combining 2μm bins 16μm bin border 8μm bin border 2μm bin border cell -
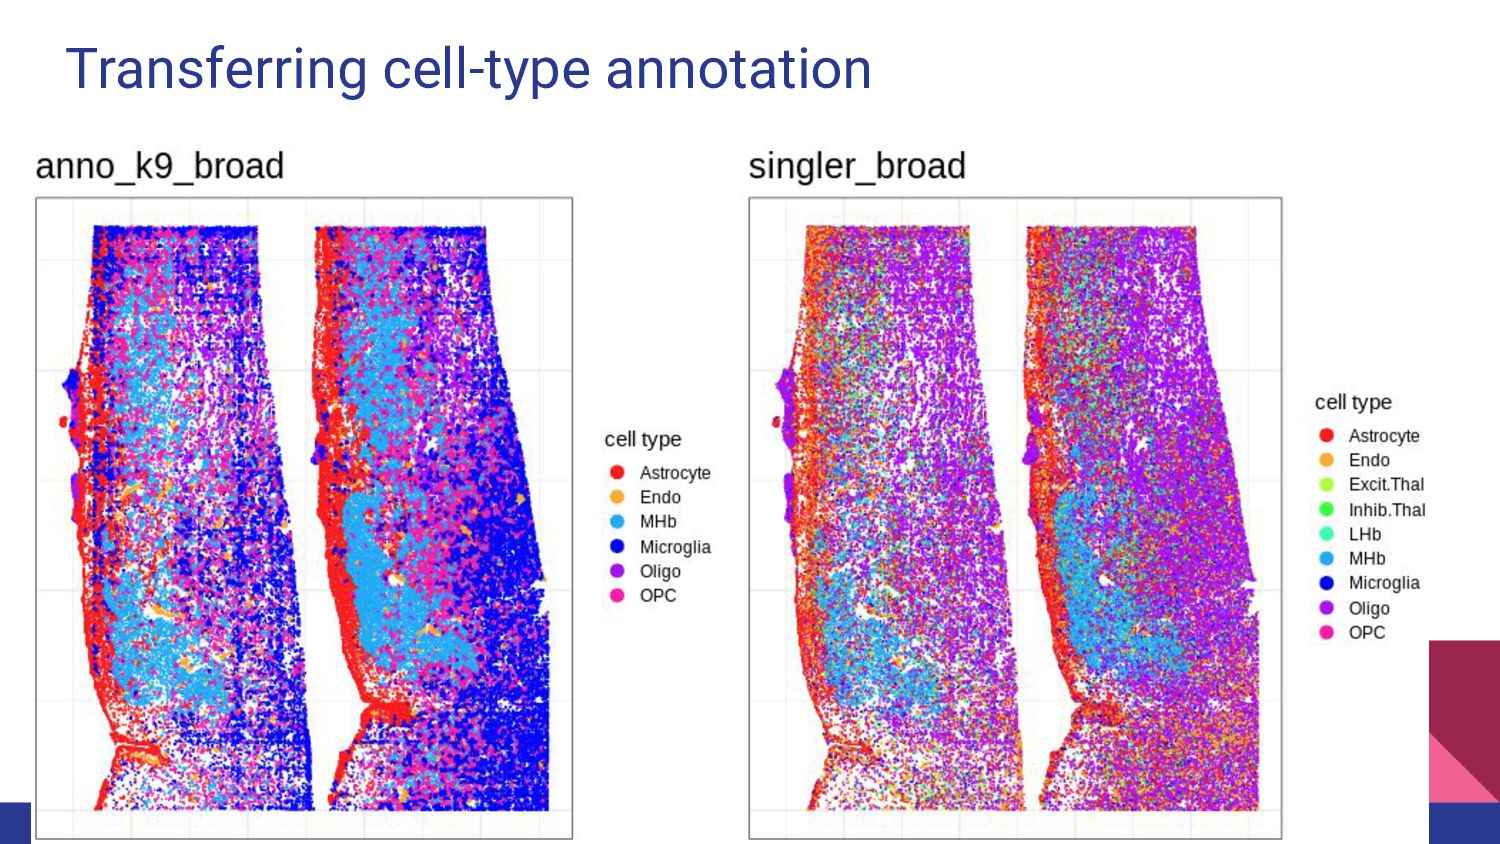
Visium HD: Goals and Challenges Goals: - Explore the current
landscape of Visium HD software tools - What’s useful and feasible to run on our data? - Develop novel code where there are holes - Gain interesting insights from LIBD Visium HD datasets (e.g. habenula, DLPFC, HPC samples) - What questions can we answer with spatially resolved cells? Challenges: - Big data: 1 HD sample is larger than 100 standard samples - Uncharted territory; limited existing solutions -
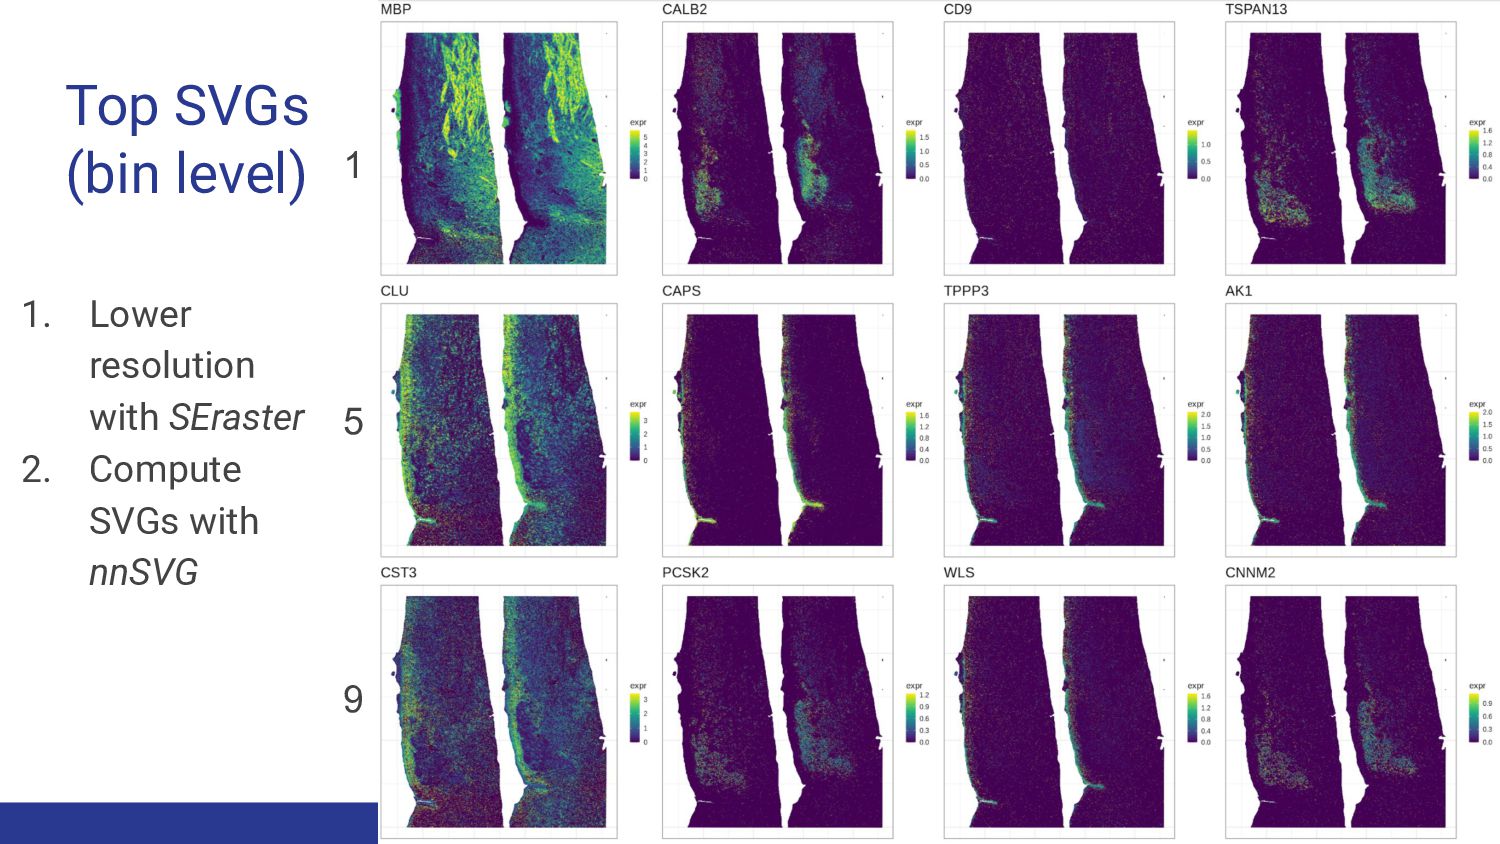
Top SVGs (bin level) 1. Lower resolution with SEraster 2.
Compute SVGs with nnSVG 1 5 9 -
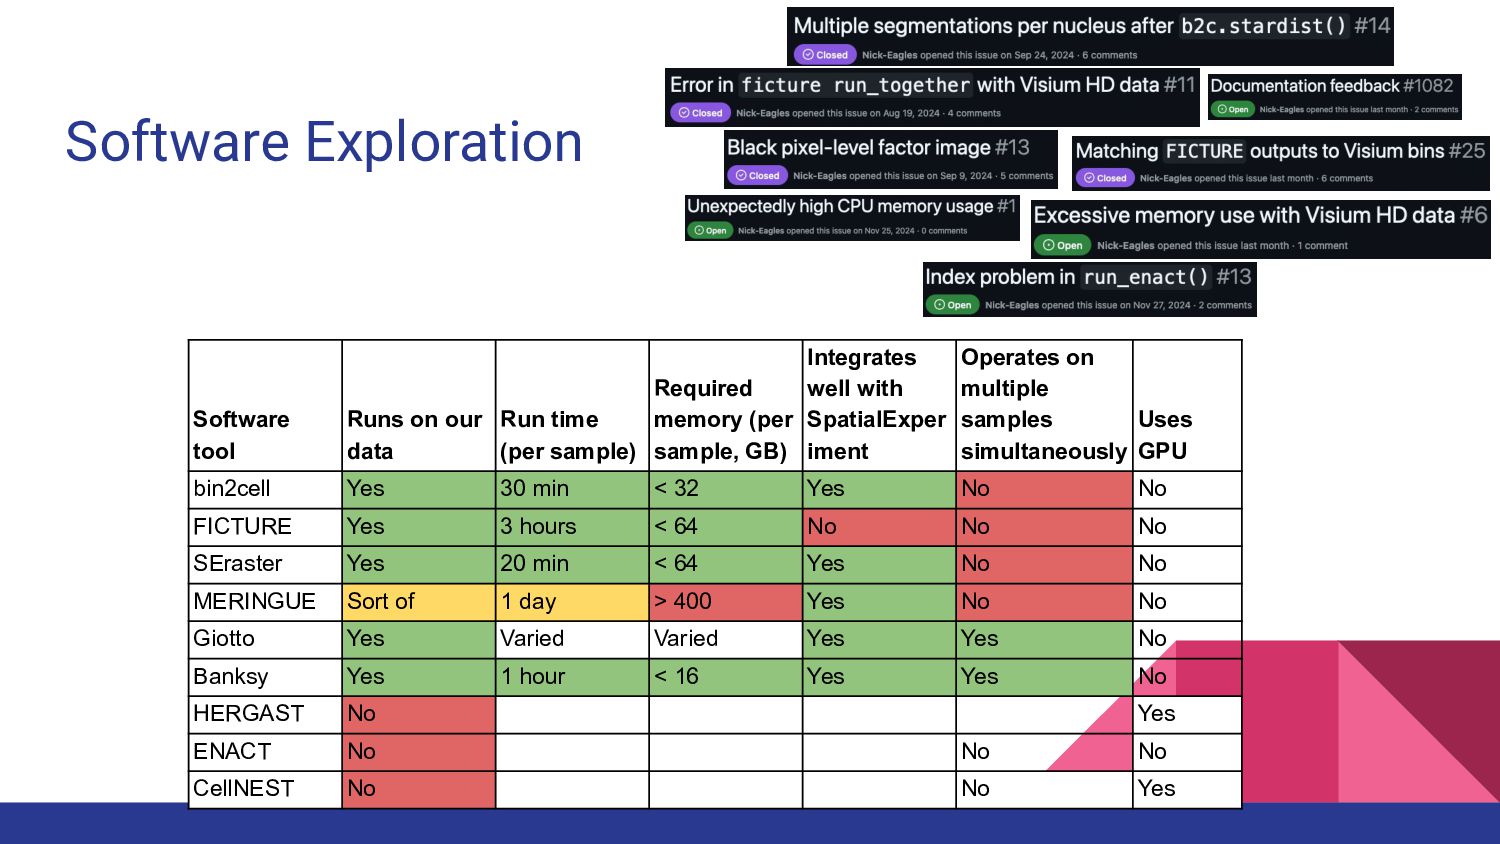
Software Exploration Software tool Runs on our data Run time
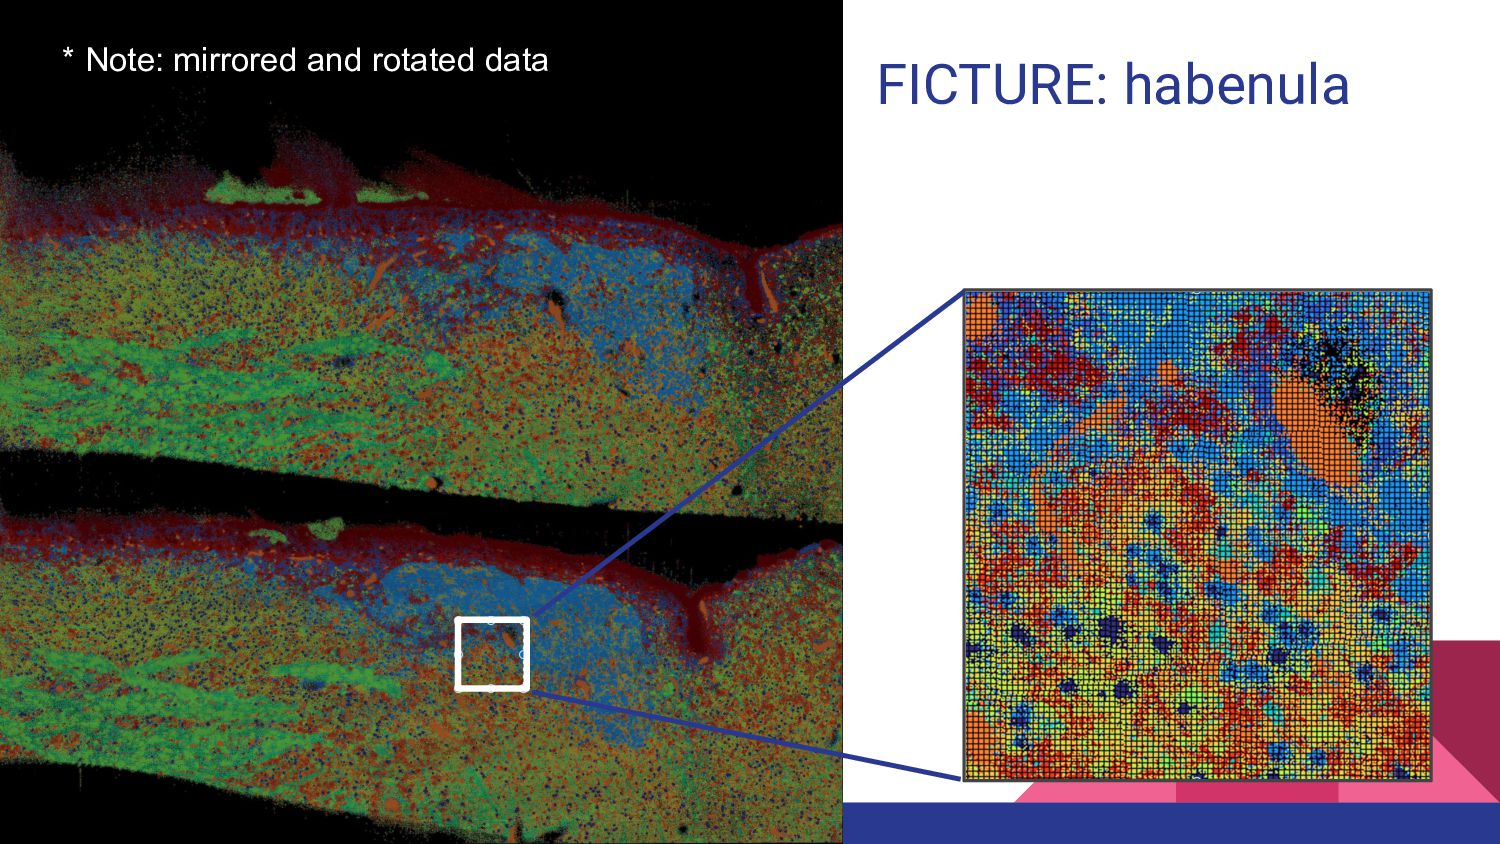
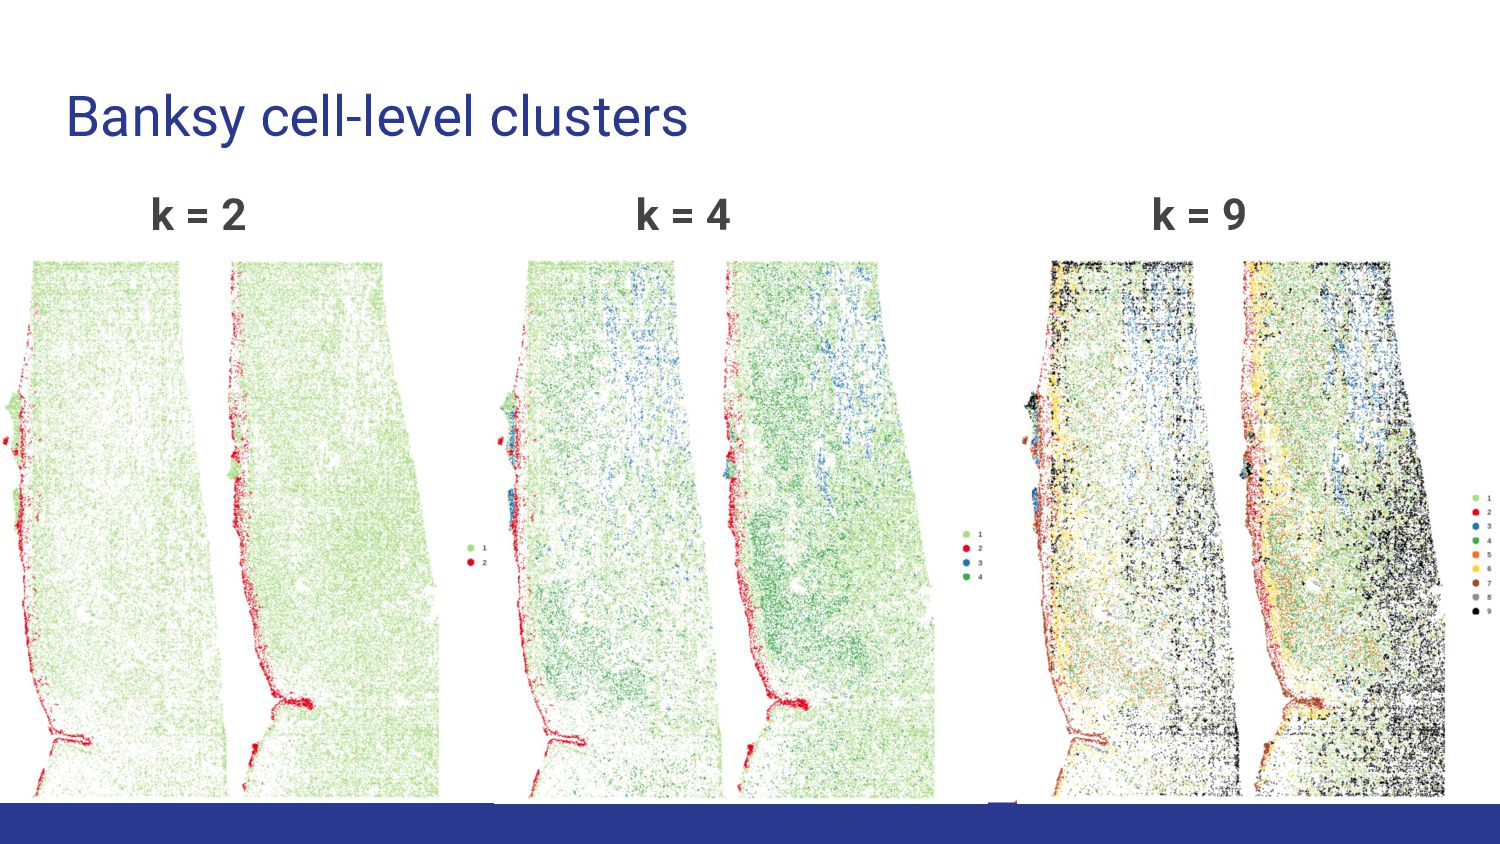
(per sample) Required memory (per sample, GB) Integrates well with SpatialExper iment Operates on multiple samples simultaneously Uses GPU bin2cell Yes 30 min < 32 Yes No No FICTURE Yes 3 hours < 64 No No No SEraster Yes 20 min < 64 Yes No No MERINGUE Sort of 1 day > 400 Yes No No Giotto Yes Varied Varied Yes Yes No Banksy Yes 1 hour < 16 Yes Yes No HERGAST No Yes ENACT No No No CellNEST No No Yes -
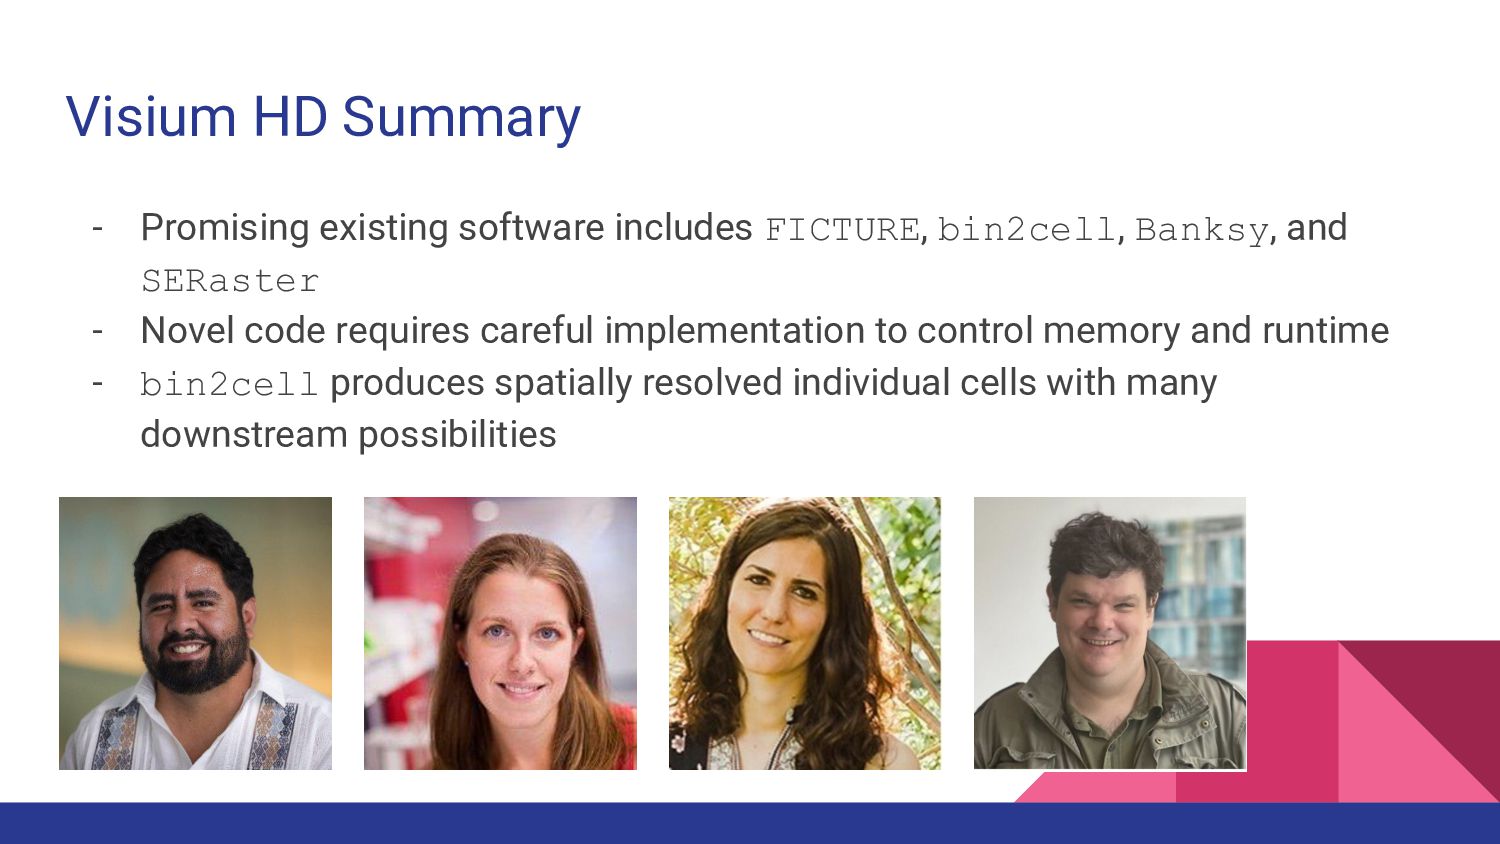
Visium HD Summary - Promising existing software includes FICTURE, bin2cell,
Banksy, and SERaster - Novel code requires careful implementation to control memory and runtime - bin2cell produces spatially resolved individual cells with many downstream possibilities -
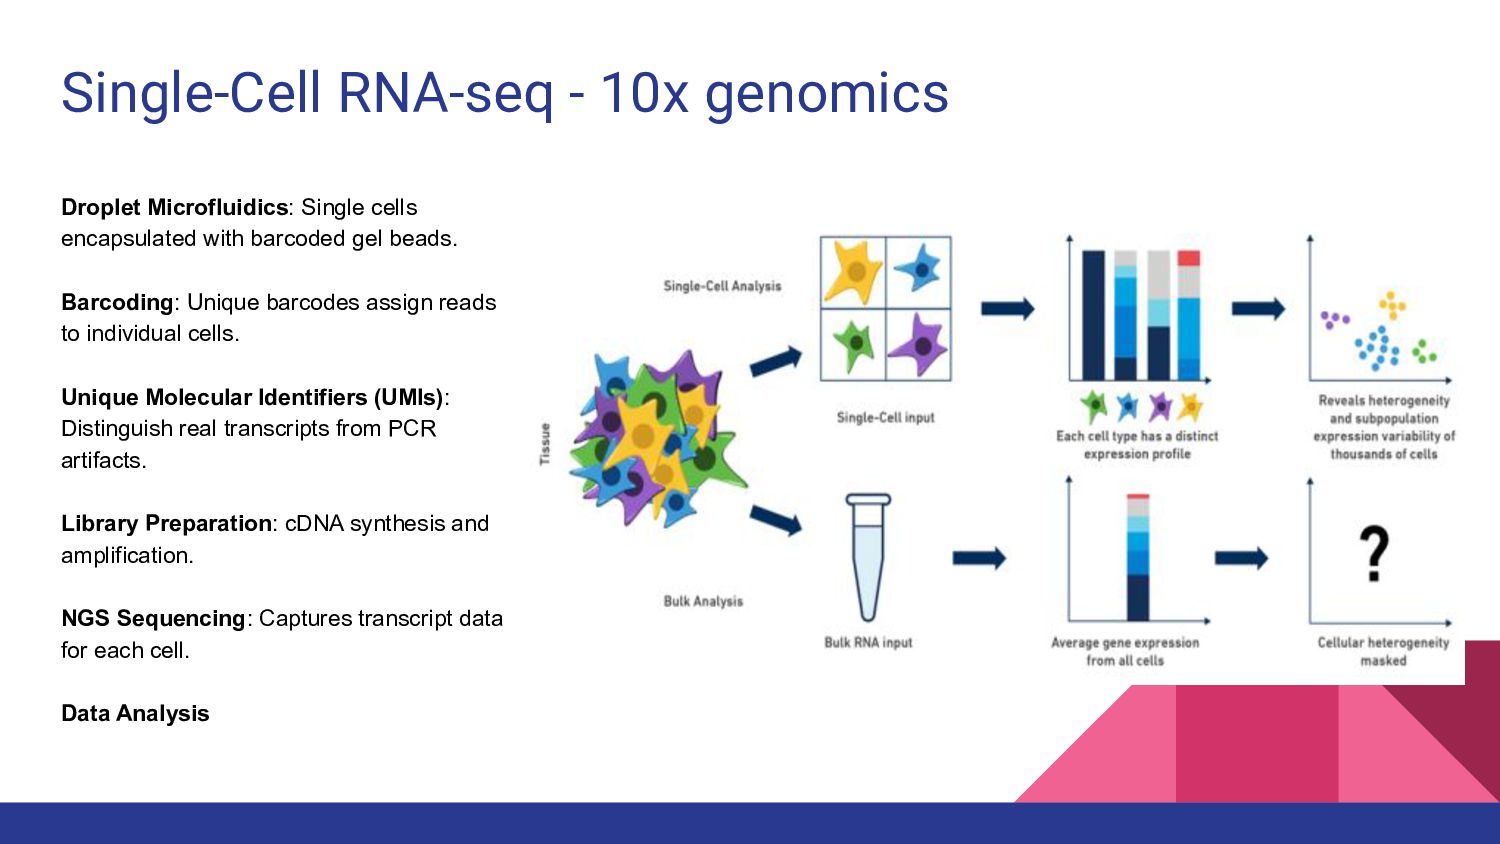
Droplet Microfluidics: Single cells encapsulated with barcoded gel beads. Barcoding:
Unique barcodes assign reads to individual cells. Unique Molecular Identifiers (UMIs): Distinguish real transcripts from PCR artifacts. Library Preparation: cDNA synthesis and amplification. NGS Sequencing: Captures transcript data for each cell. Data Analysis Single-Cell RNA-seq - 10x genomics -
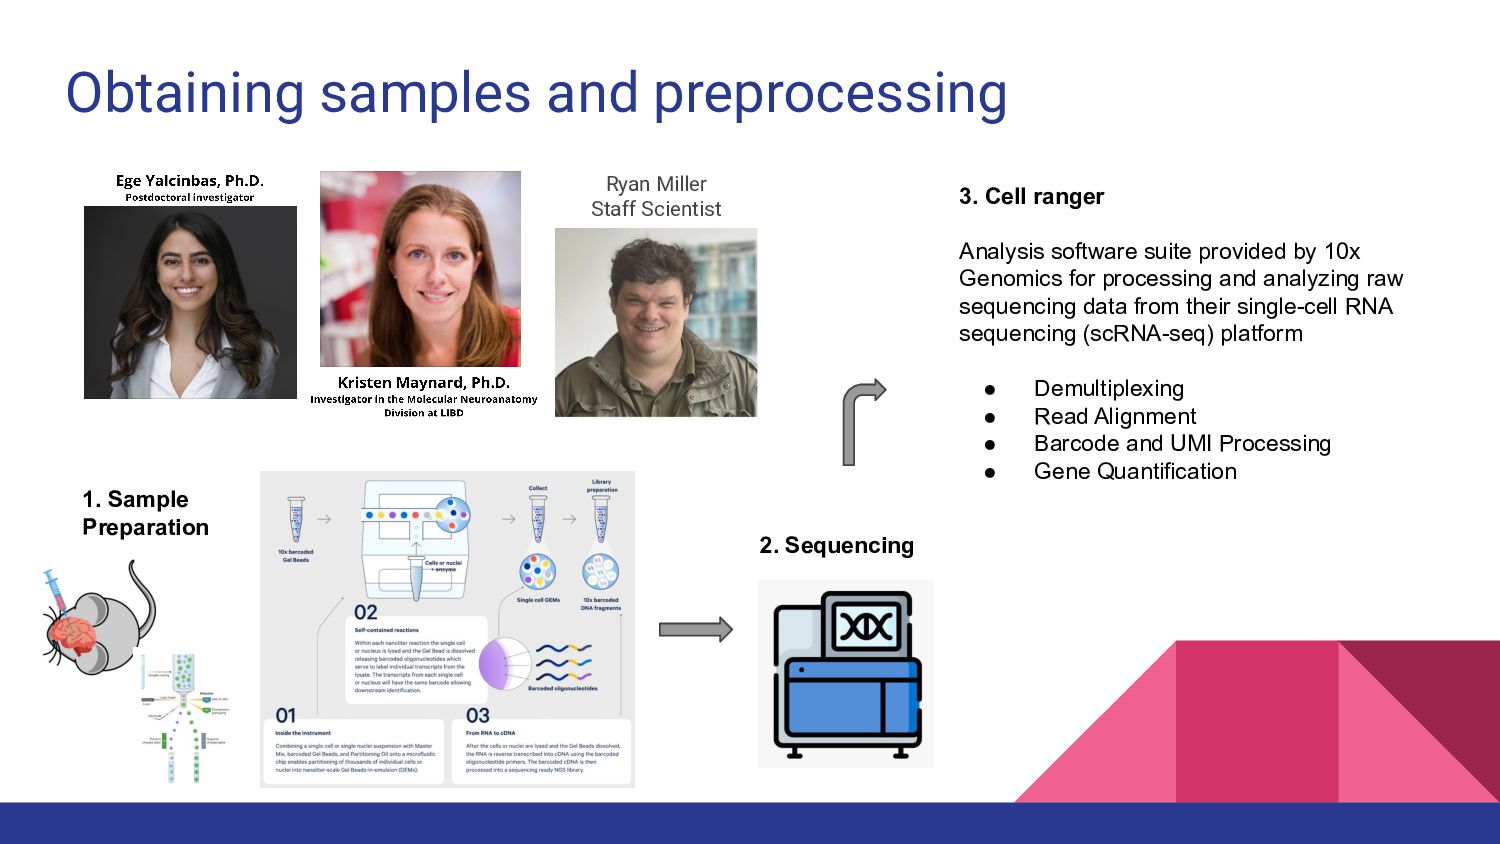
Obtaining samples and preprocessing Ryan Miller Staff Scientist 3. Cell
ranger Analysis software suite provided by 10x Genomics for processing and analyzing raw sequencing data from their single-cell RNA sequencing (scRNA-seq) platform • Demultiplexing • Read Alignment • Barcode and UMI Processing • Gene Quantification 1. Sample Preparation 2. Sequencing -
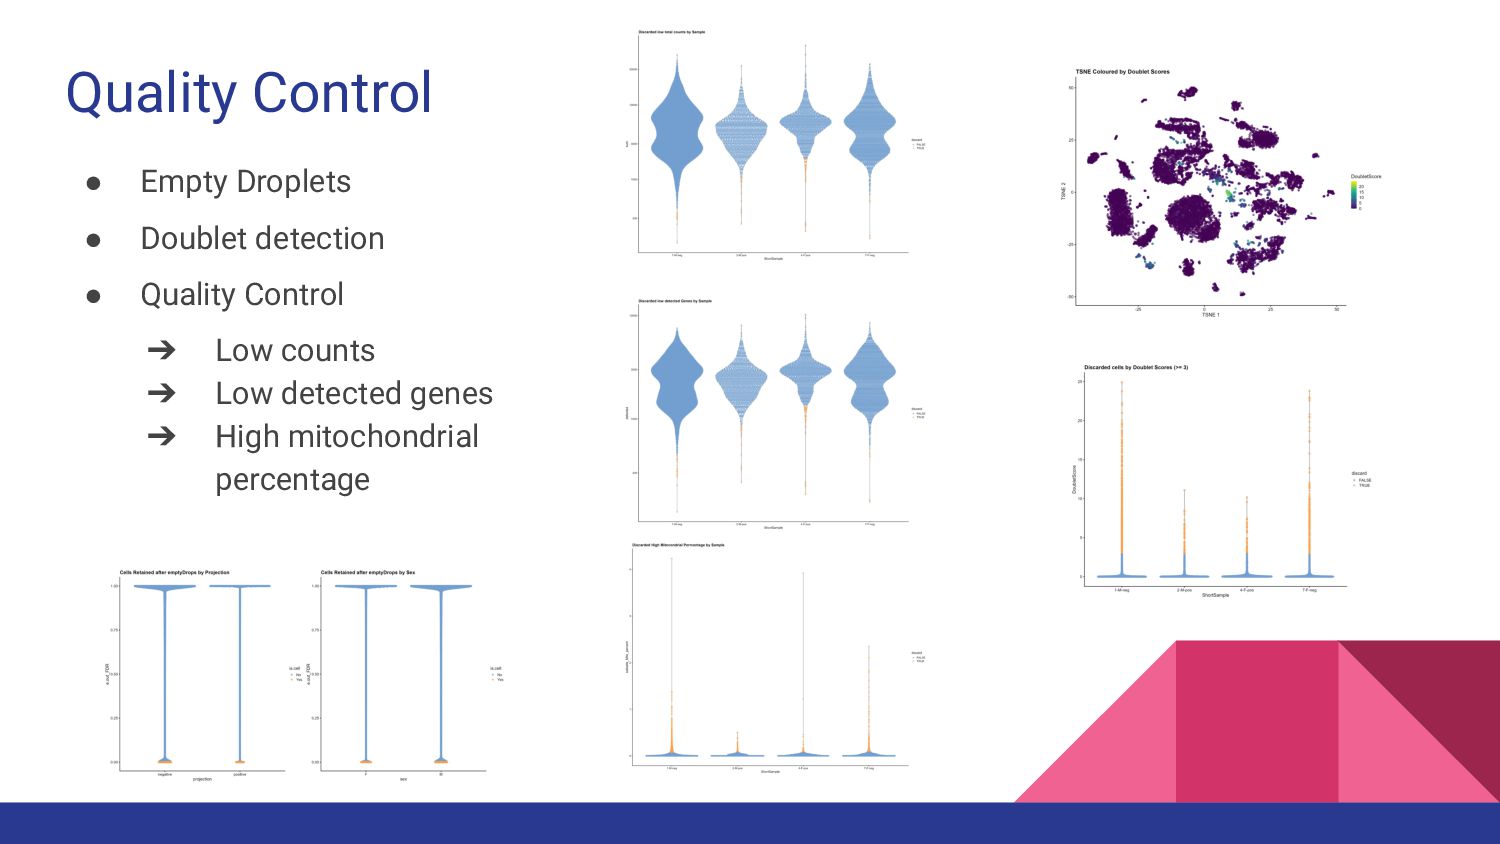
Quality Control • Empty Droplets • Doublet detection • Quality
Control ➔ Low counts ➔ Low detected genes ➔ High mitochondrial percentage -
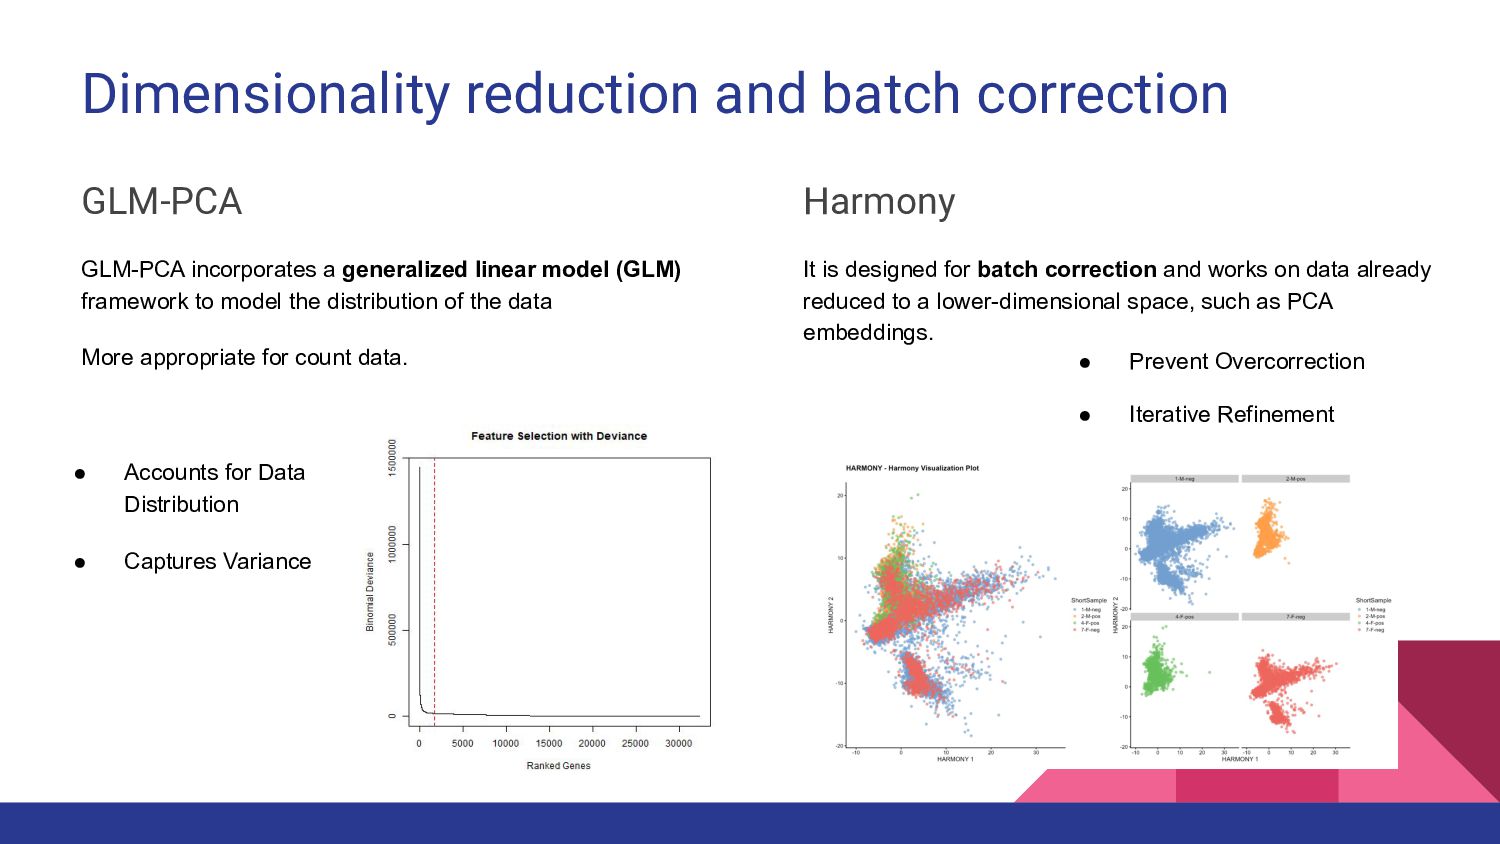
Dimensionality reduction and batch correction GLM-PCA GLM-PCA incorporates a generalized
linear model (GLM) framework to model the distribution of the data More appropriate for count data. • Accounts for Data Distribution • Captures Variance Harmony It is designed for batch correction and works on data already reduced to a lower-dimensional space, such as PCA embeddings. • Prevent Overcorrection • Iterative Refinement -
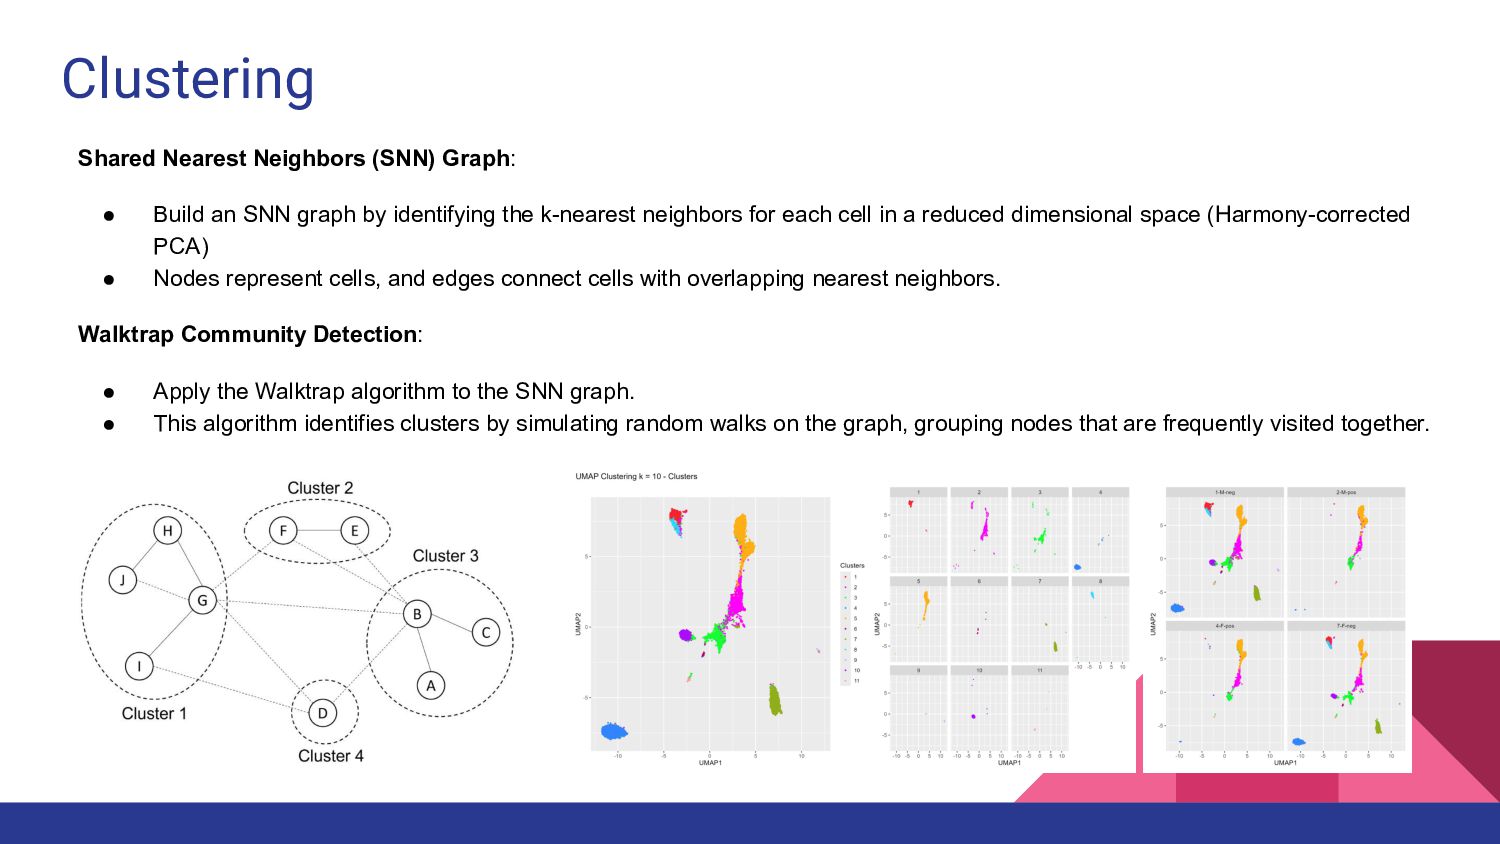
Clustering Shared Nearest Neighbors (SNN) Graph: • Build an SNN
graph by identifying the k-nearest neighbors for each cell in a reduced dimensional space (Harmony-corrected PCA) • Nodes represent cells, and edges connect cells with overlapping nearest neighbors. Walktrap Community Detection: • Apply the Walktrap algorithm to the SNN graph. • This algorithm identifies clusters by simulating random walks on the graph, grouping nodes that are frequently visited together. -
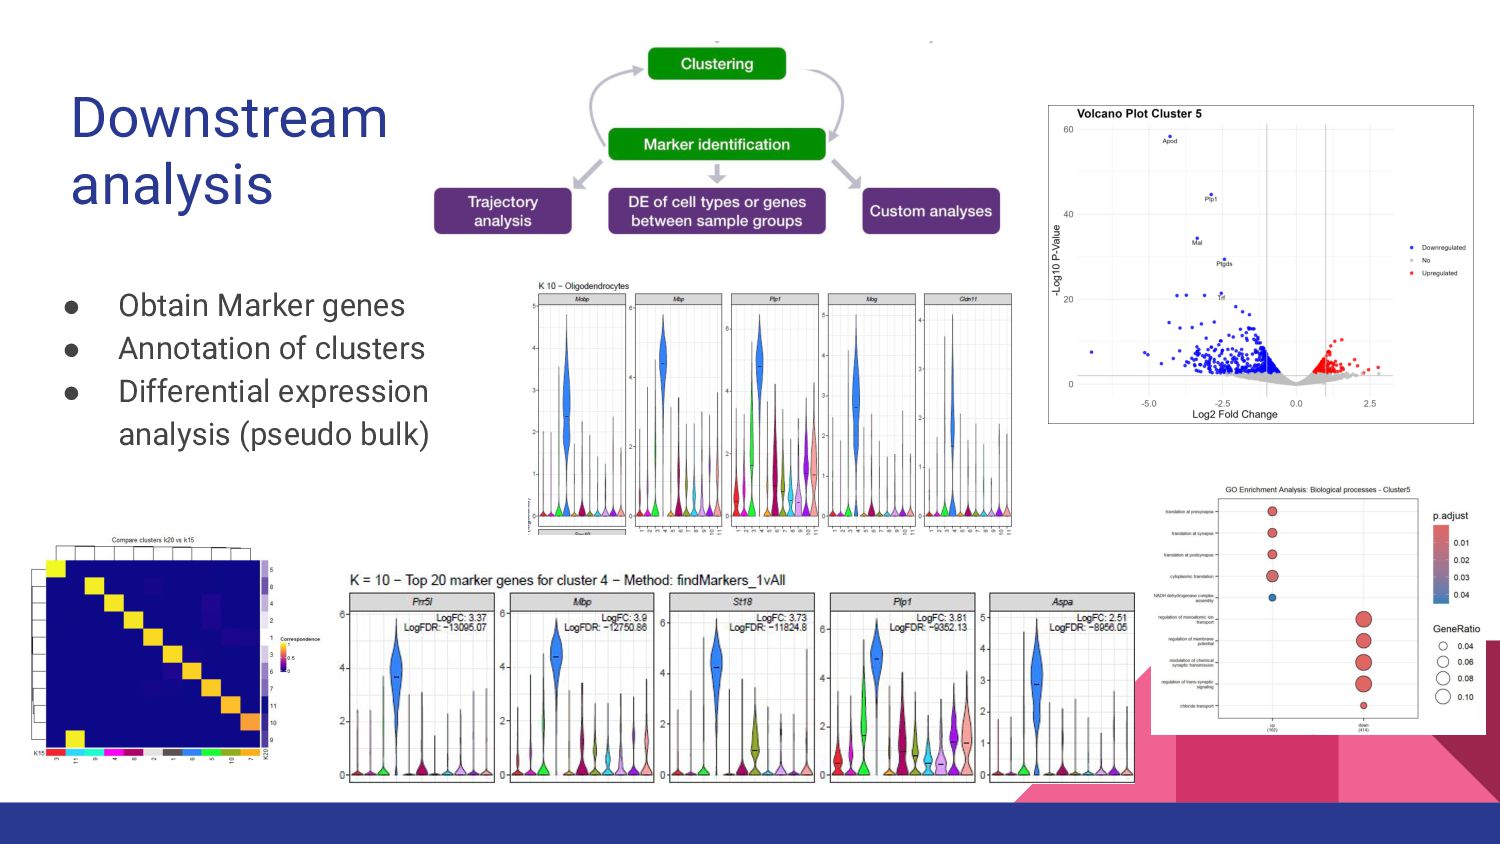
Downstream analysis • Obtain Marker genes • Annotation of clusters
• Differential expression analysis (pseudo bulk) -
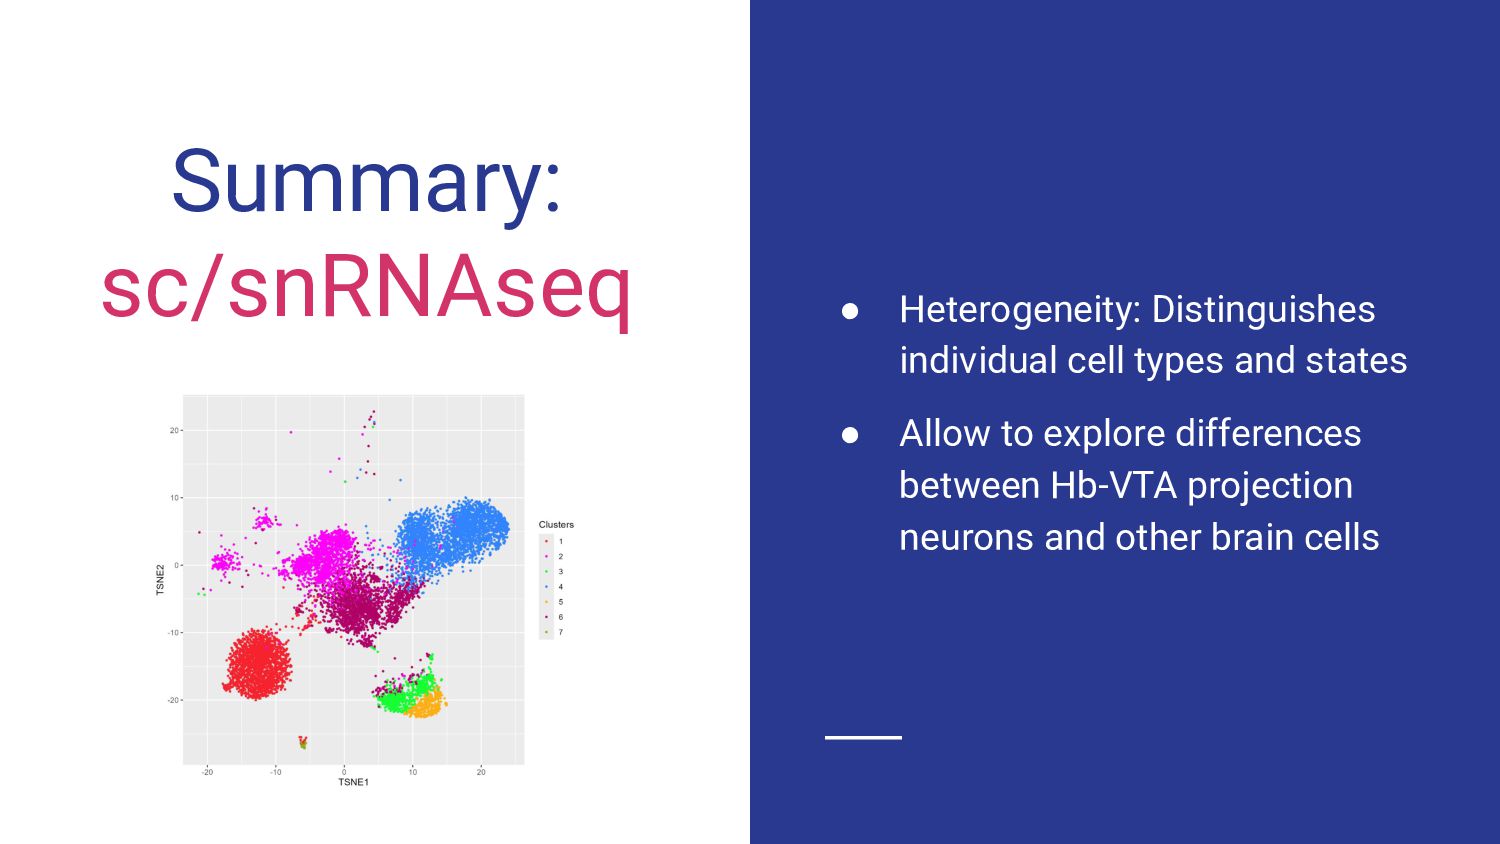
Summary: sc/snRNAseq • Heterogeneity: Distinguishes individual cell types and states
• Allow to explore differences between Hb-VTA projection neurons and other brain cells -
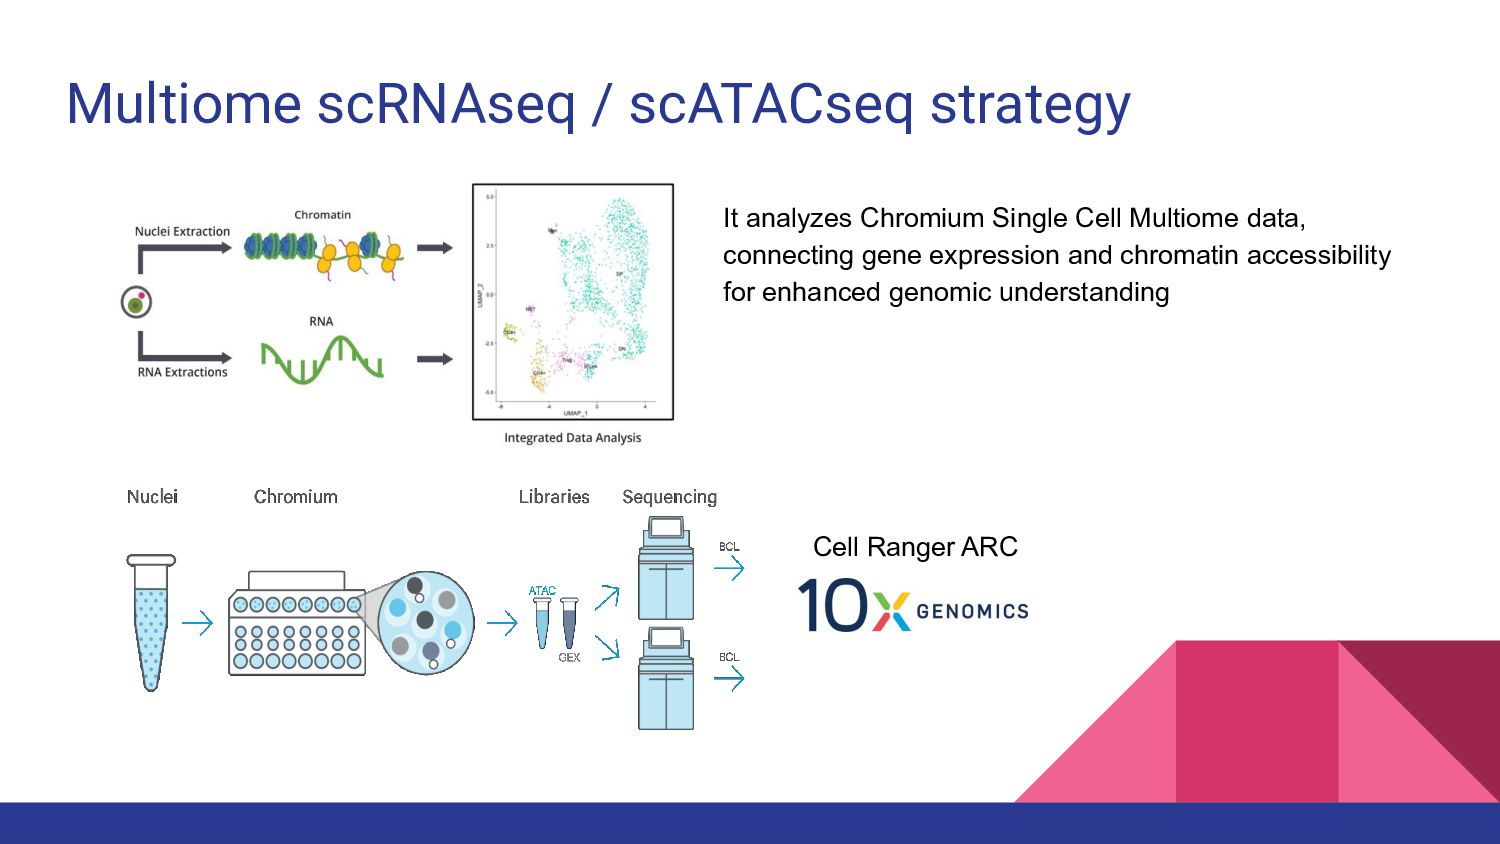
Multiome scRNAseq / scATACseq strategy It analyzes Chromium Single Cell
Multiome data, connecting gene expression and chromatin accessibility for enhanced genomic understanding Cell Ranger ARC -
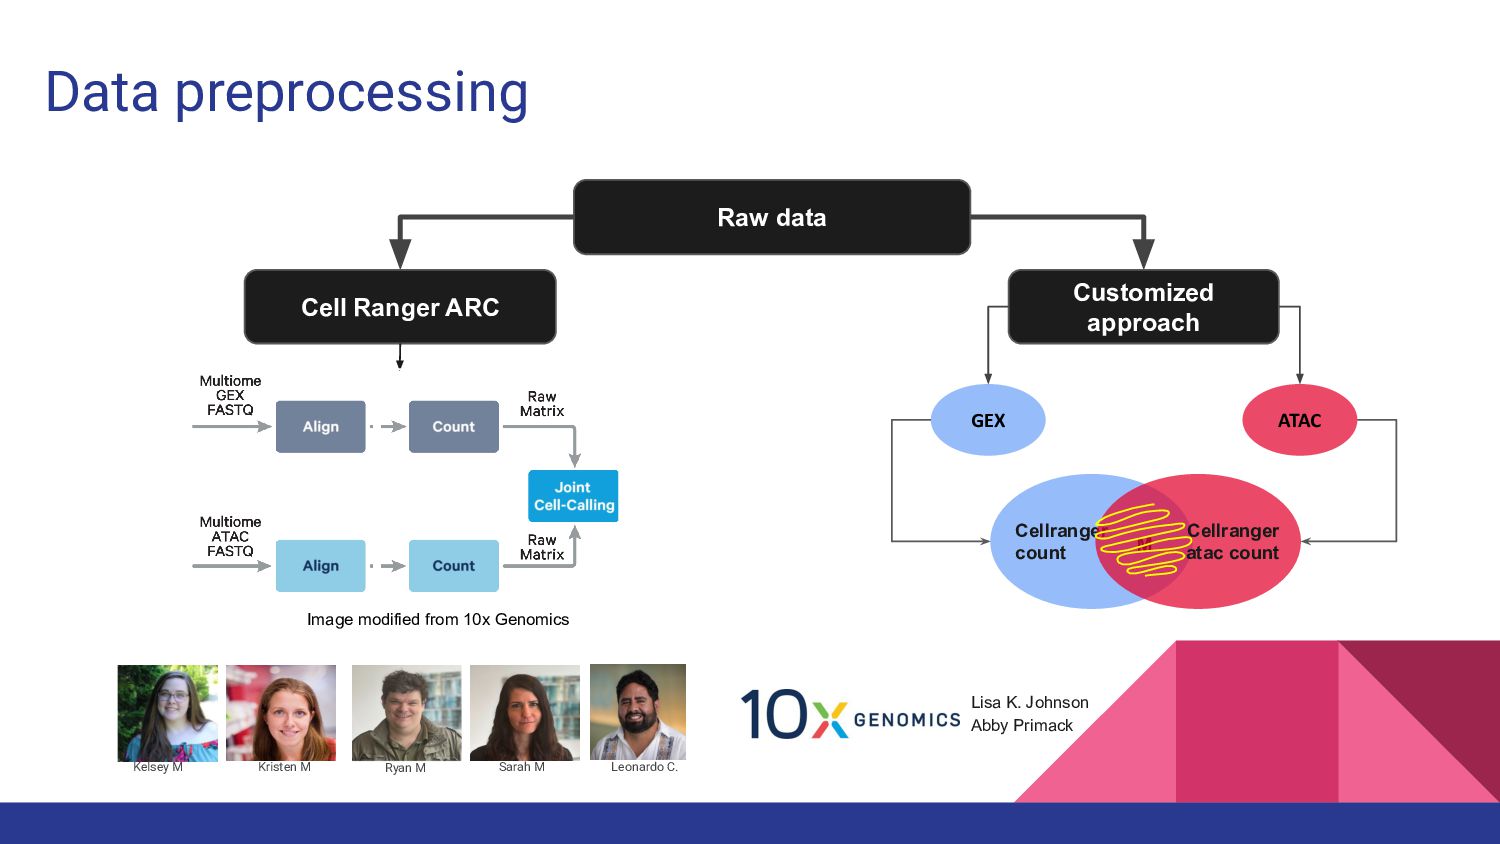
Data preprocessing Raw data Ryan M Kristen M Sarah M
Kelsey M Leonardo C. Customized approach Cellranger count M GEX ATAC Cellranger atac count Lisa K. Johnson Abby Primack Cell Ranger ARC Image modified from 10x Genomics -
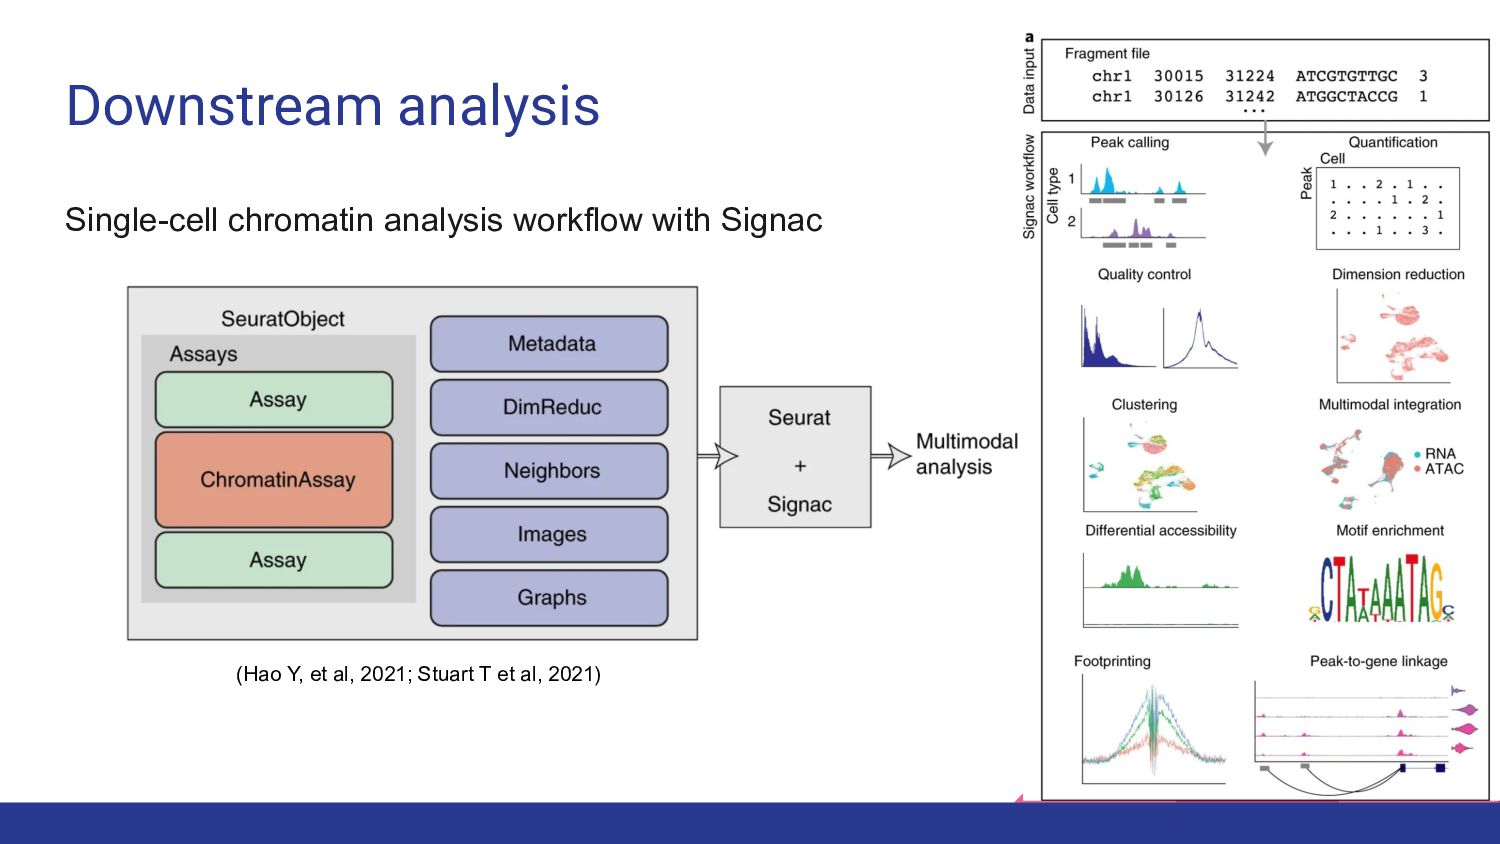
Downstream analysis (Hao Y, et al, 2021; Stuart T et
al, 2021) Single-cell chromatin analysis workflow with Signac -
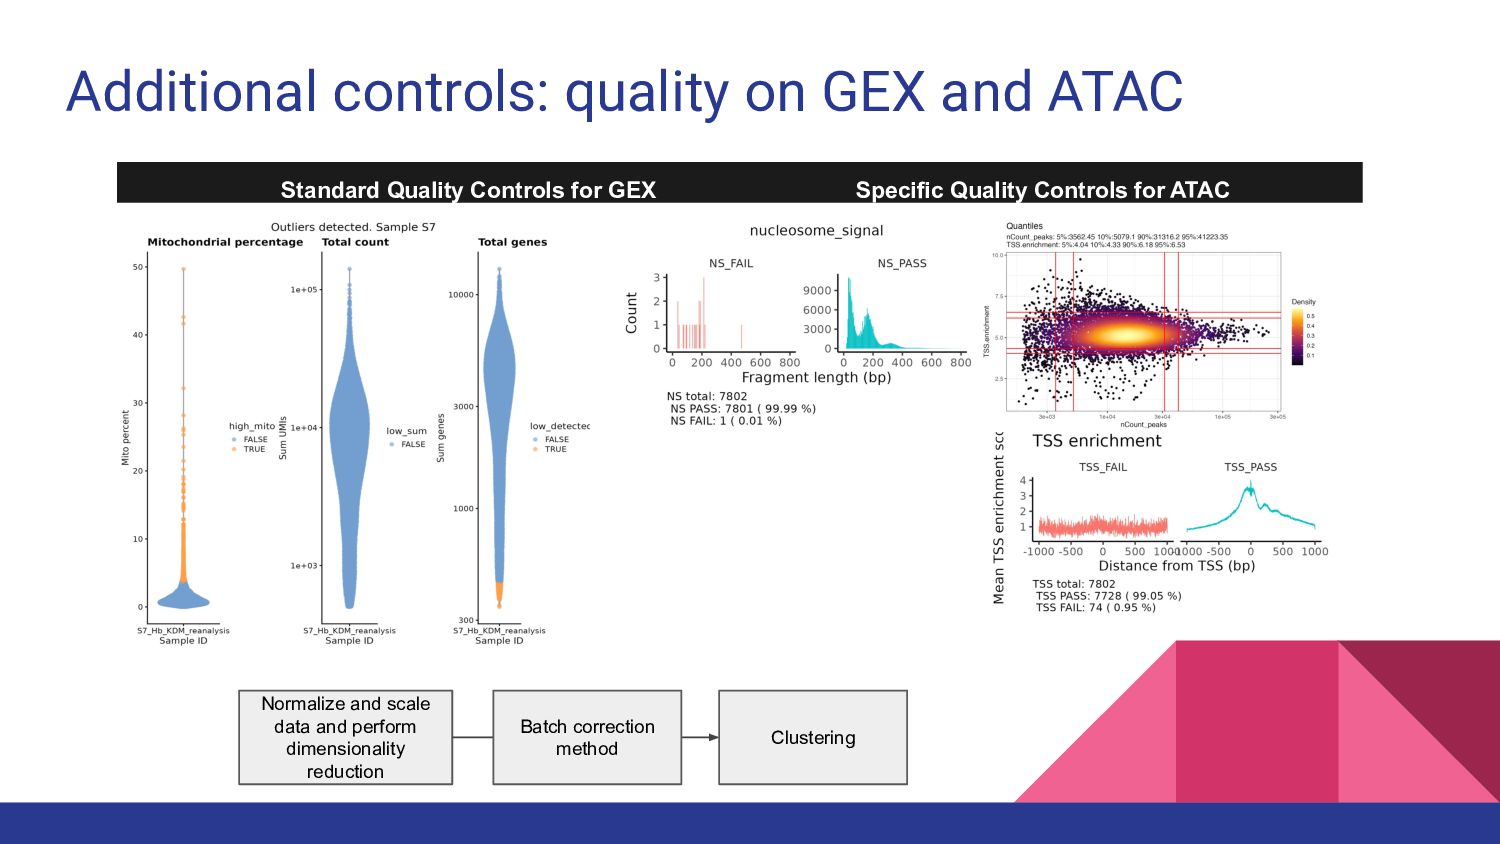
Additional controls: quality on GEX and ATAC Standard Quality Controls
for GEX Specific Quality Controls for ATAC Normalize and scale data and perform dimensionality reduction Batch correction method Clustering -
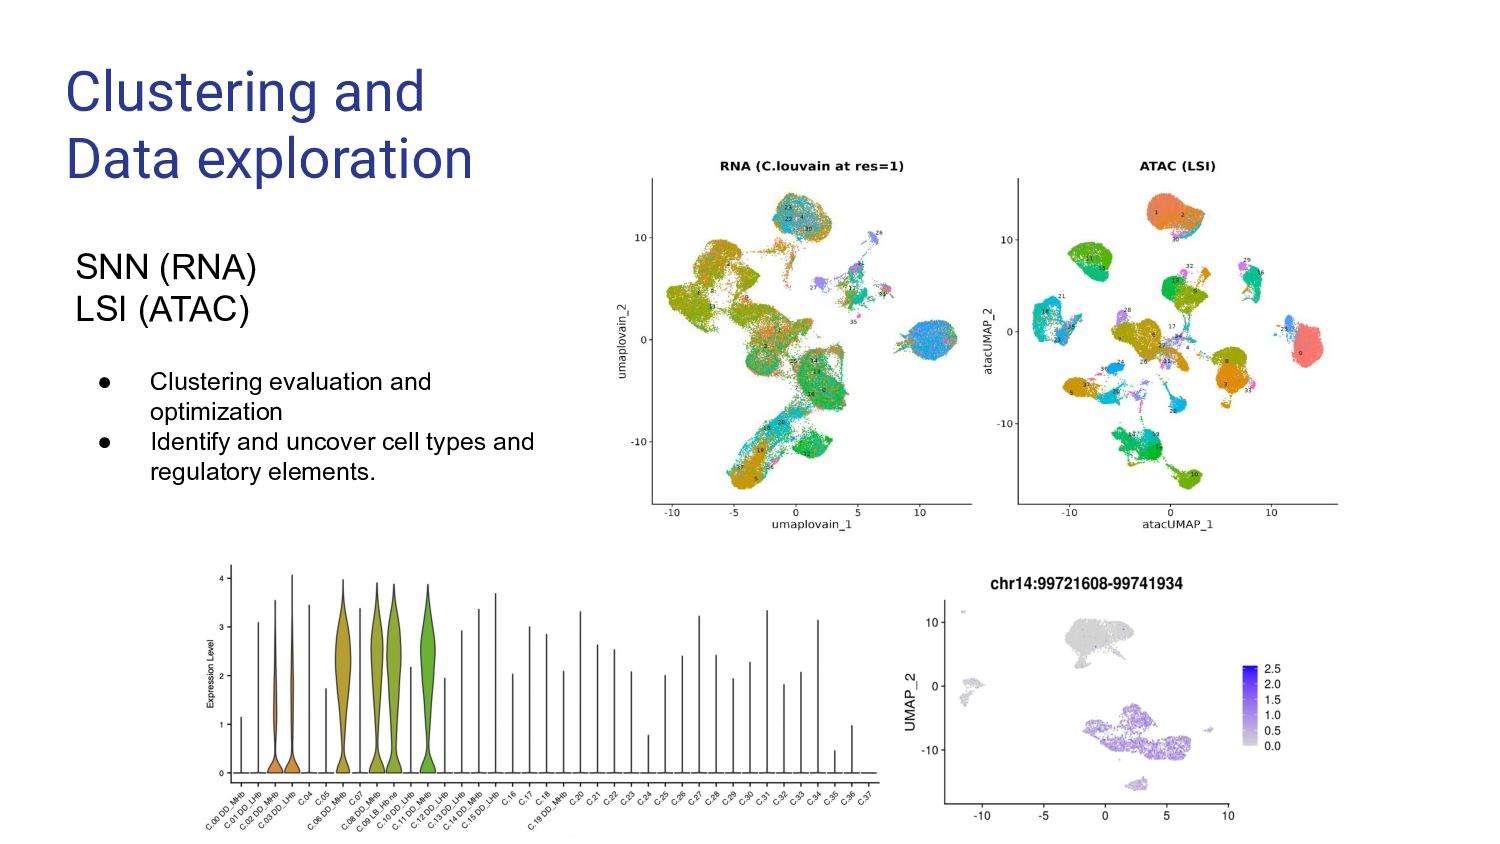
Clustering and Data exploration • Clustering evaluation and optimization •
Identify and uncover cell types and regulatory elements. SNN (RNA) LSI (ATAC) -
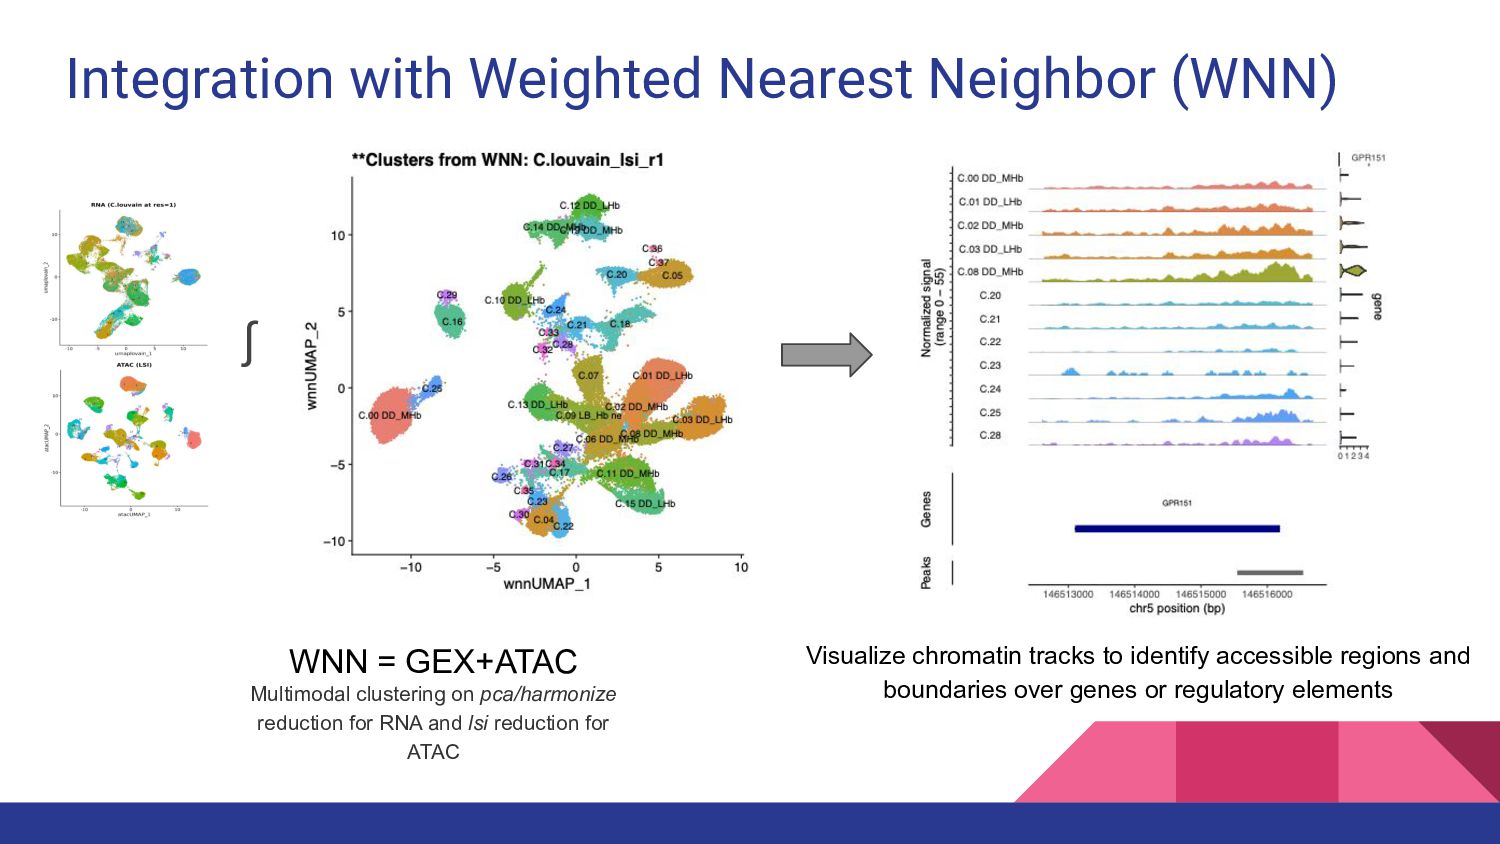
Integration with Weighted Nearest Neighbor (WNN) WNN = GEX+ATAC Multimodal
clustering on pca/harmonize reduction for RNA and lsi reduction for ATAC ∫ Visualize chromatin tracks to identify accessible regions and boundaries over genes or regulatory elements -
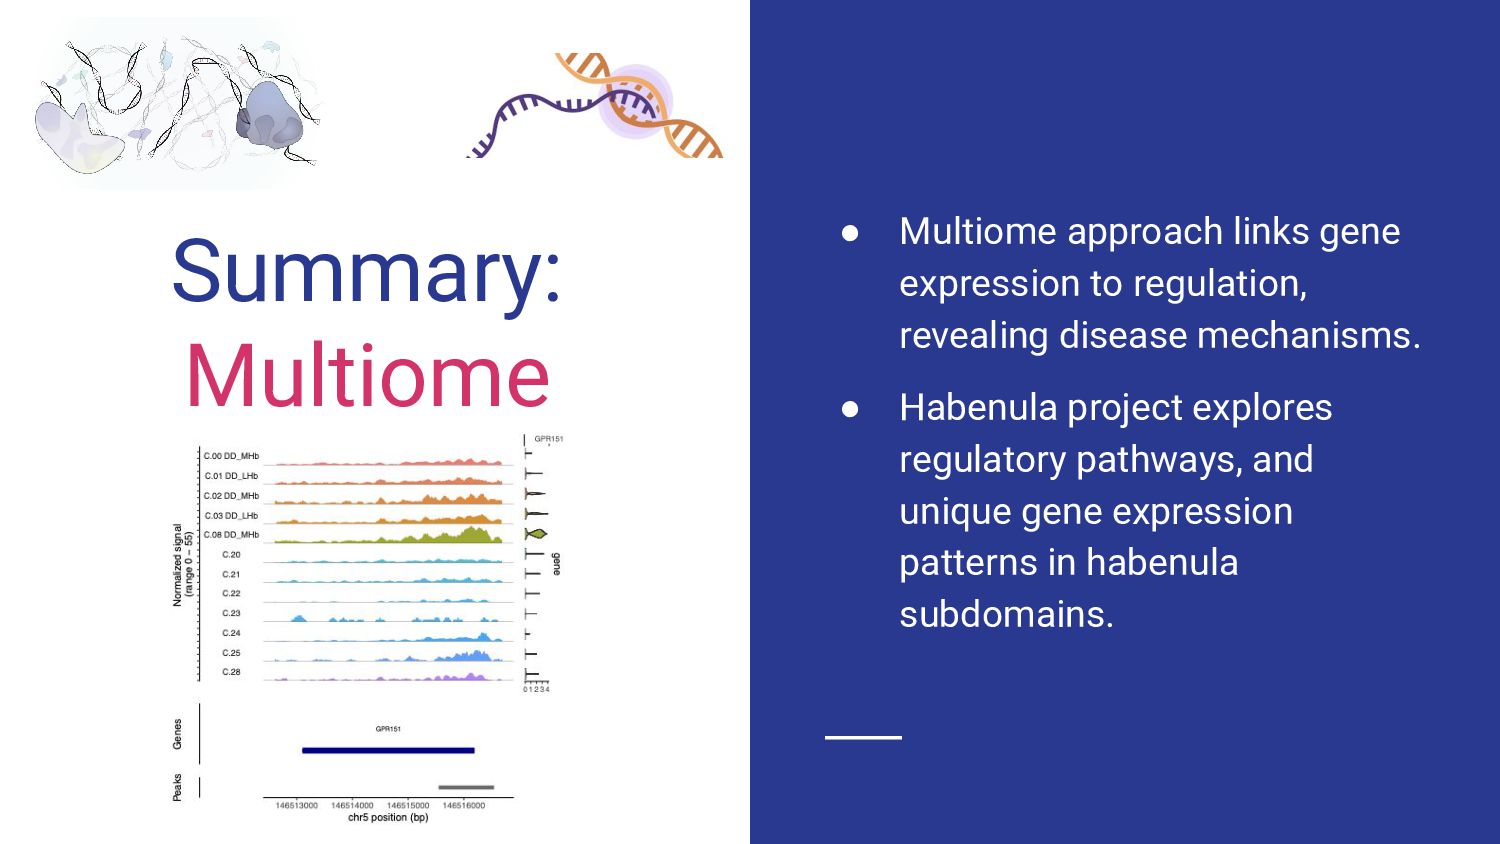
Summary: Multiome • Multiome approach links gene expression to regulation,
revealing disease mechanisms. • Habenula project explores regulatory pathways, and unique gene expression patterns in habenula subdomains. -
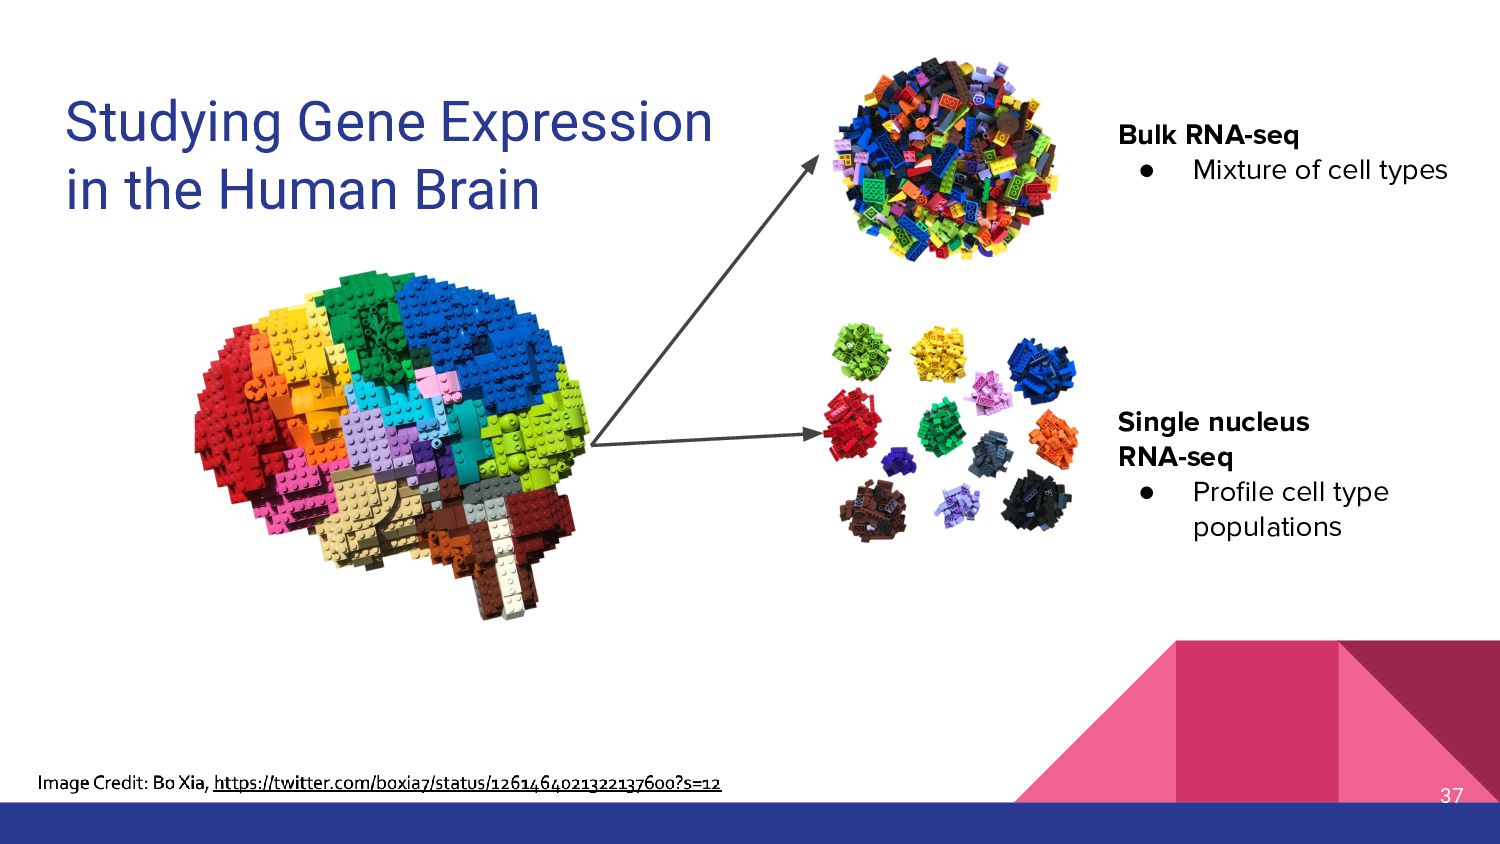
Studying Gene Expression in the Human Brain Bulk RNA-seq •
Mixture of cell types Single nucleus RNA-seq • Profile cell type populations 37 -
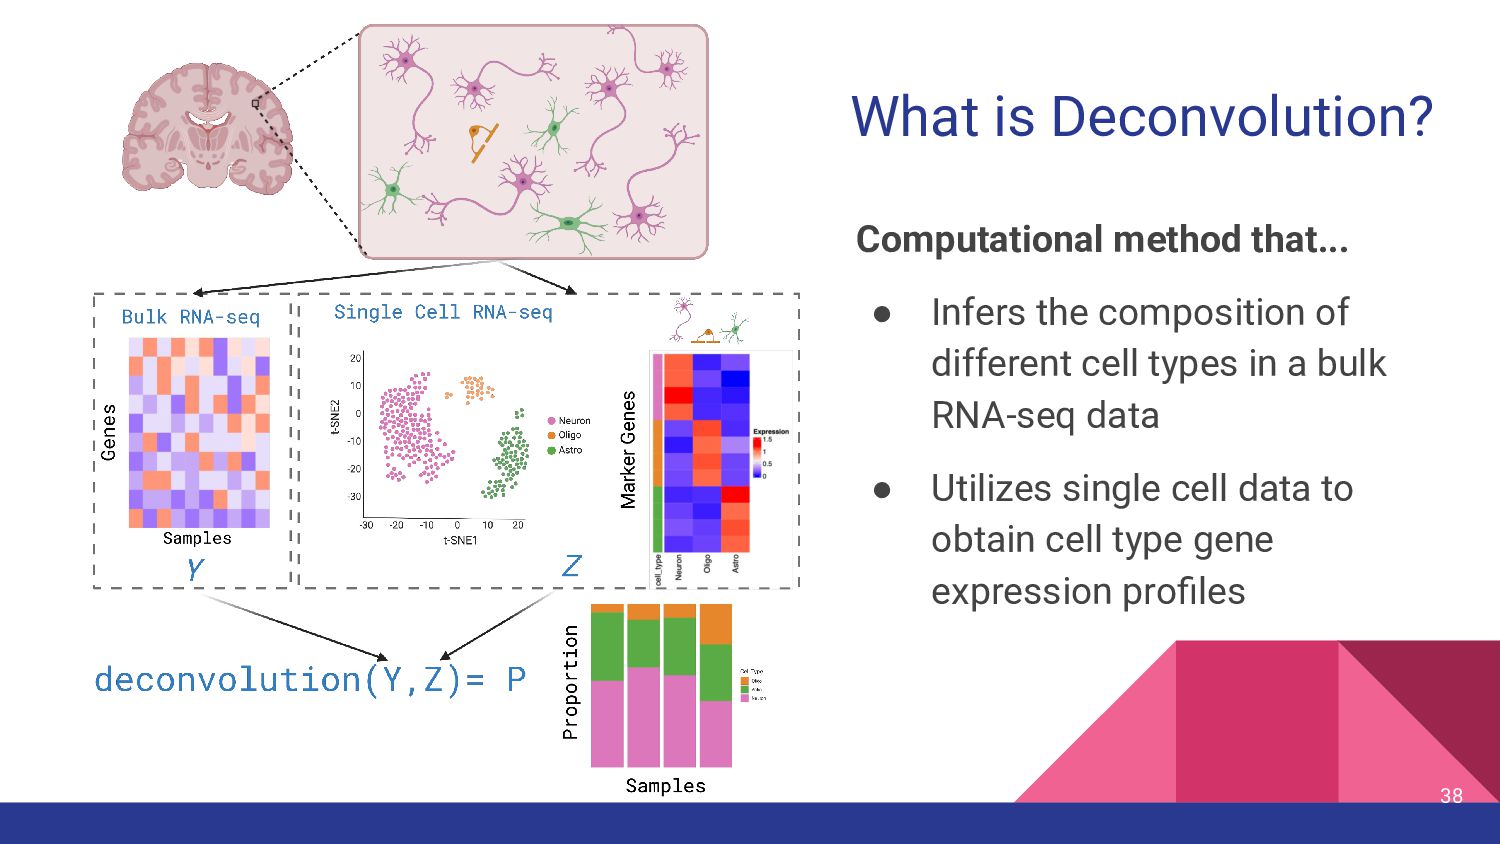
What is Deconvolution? Computational method that... • Infers the composition
of different cell types in a bulk RNA-seq data • Utilizes single cell data to obtain cell type gene expression profiles 38 -
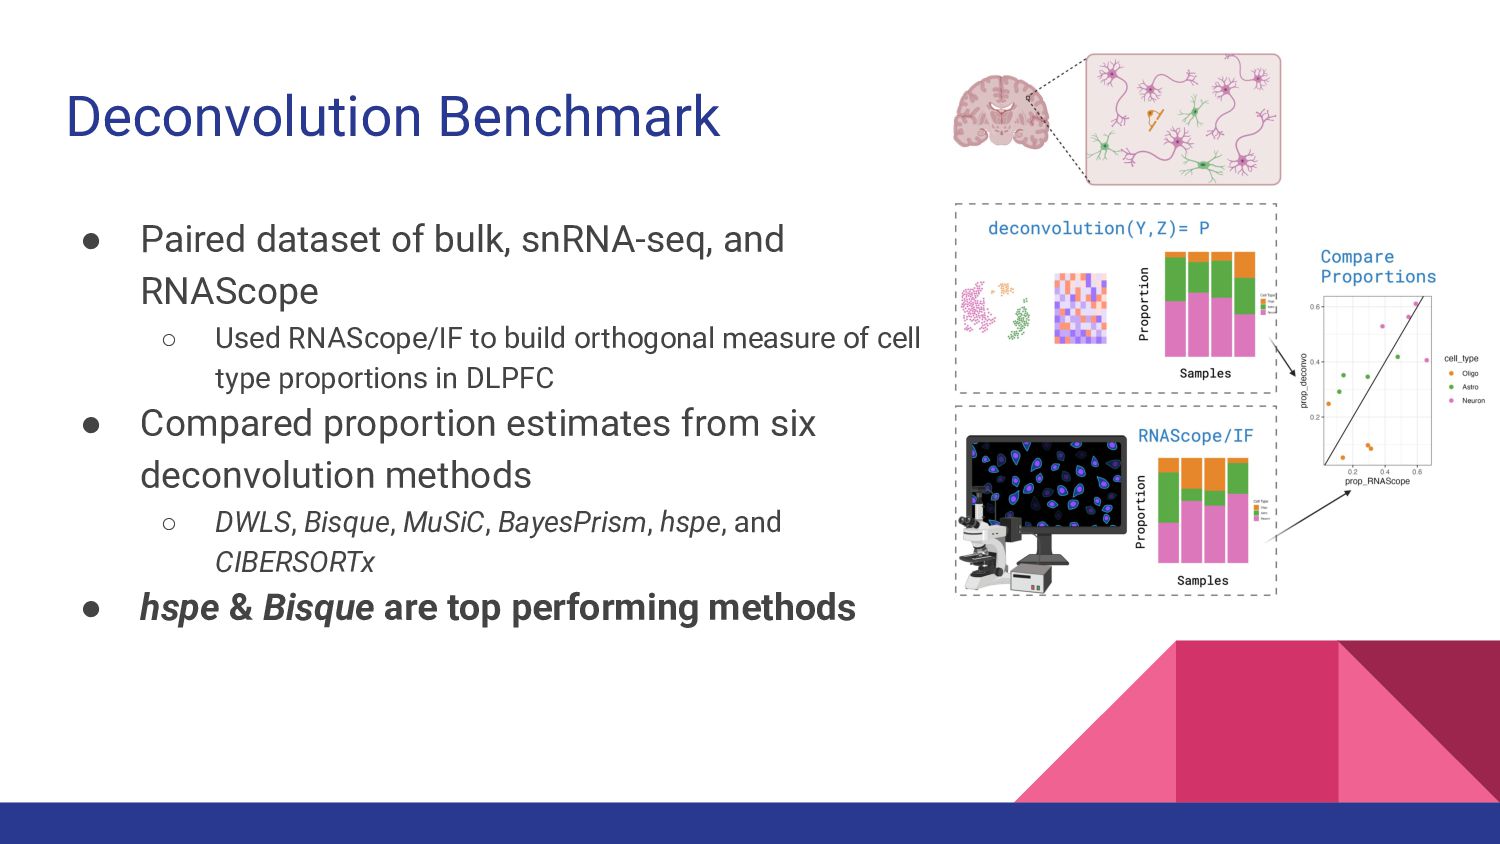
Deconvolution Benchmark • Paired dataset of bulk, snRNA-seq, and RNAScope
◦ Used RNAScope/IF to build orthogonal measure of cell type proportions in DLPFC • Compared proportion estimates from six deconvolution methods ◦ DWLS, Bisque, MuSiC, BayesPrism, hspe, and CIBERSORTx • hspe & Bisque are top performing methods -
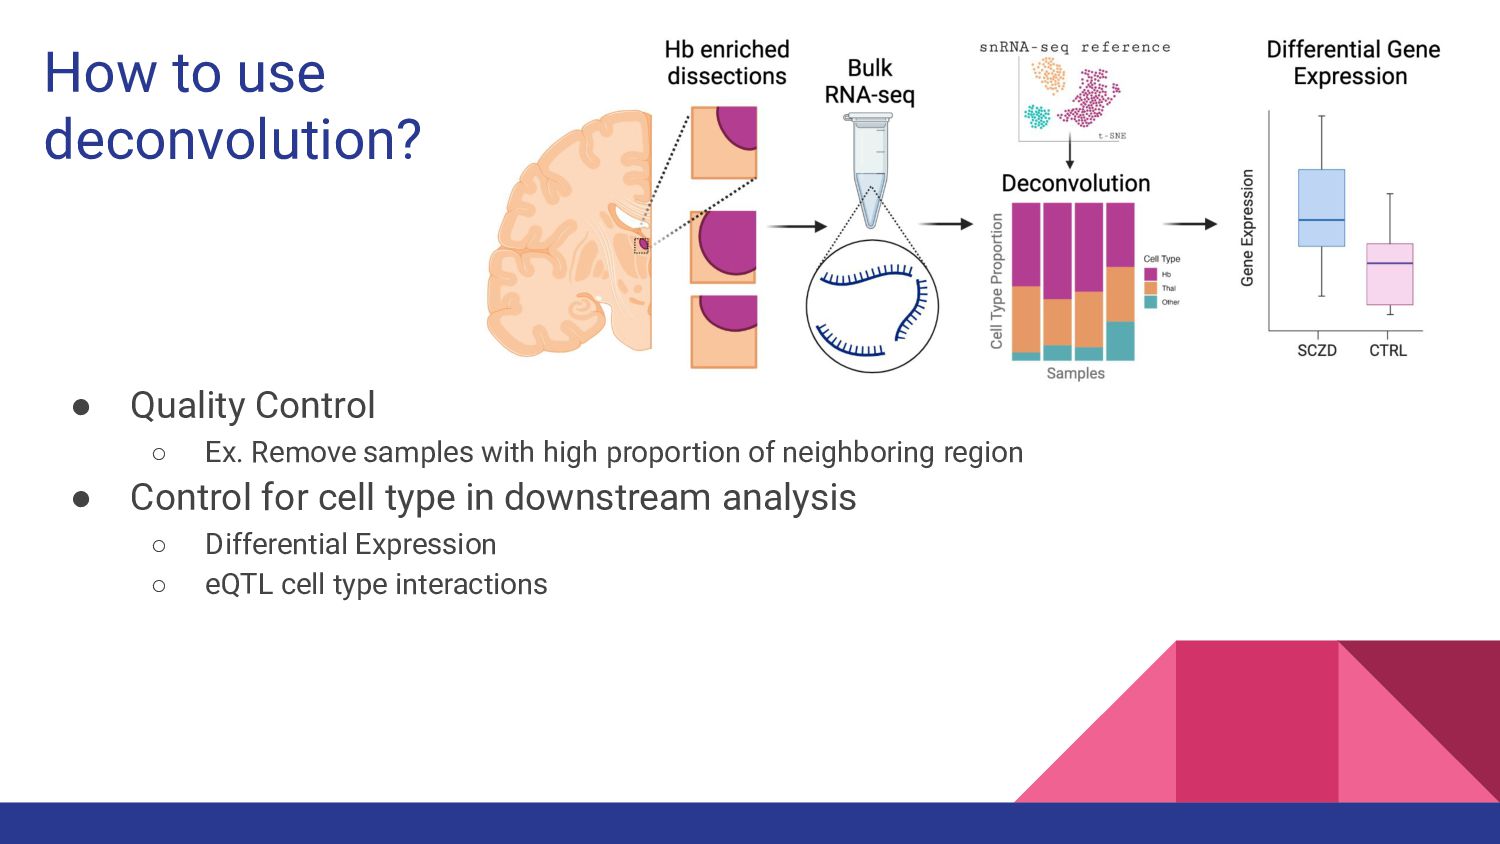
• Quality Control ◦ Ex. Remove samples with high proportion
of neighboring region • Control for cell type in downstream analysis ◦ Differential Expression ◦ eQTL cell type interactions How to use deconvolution? -
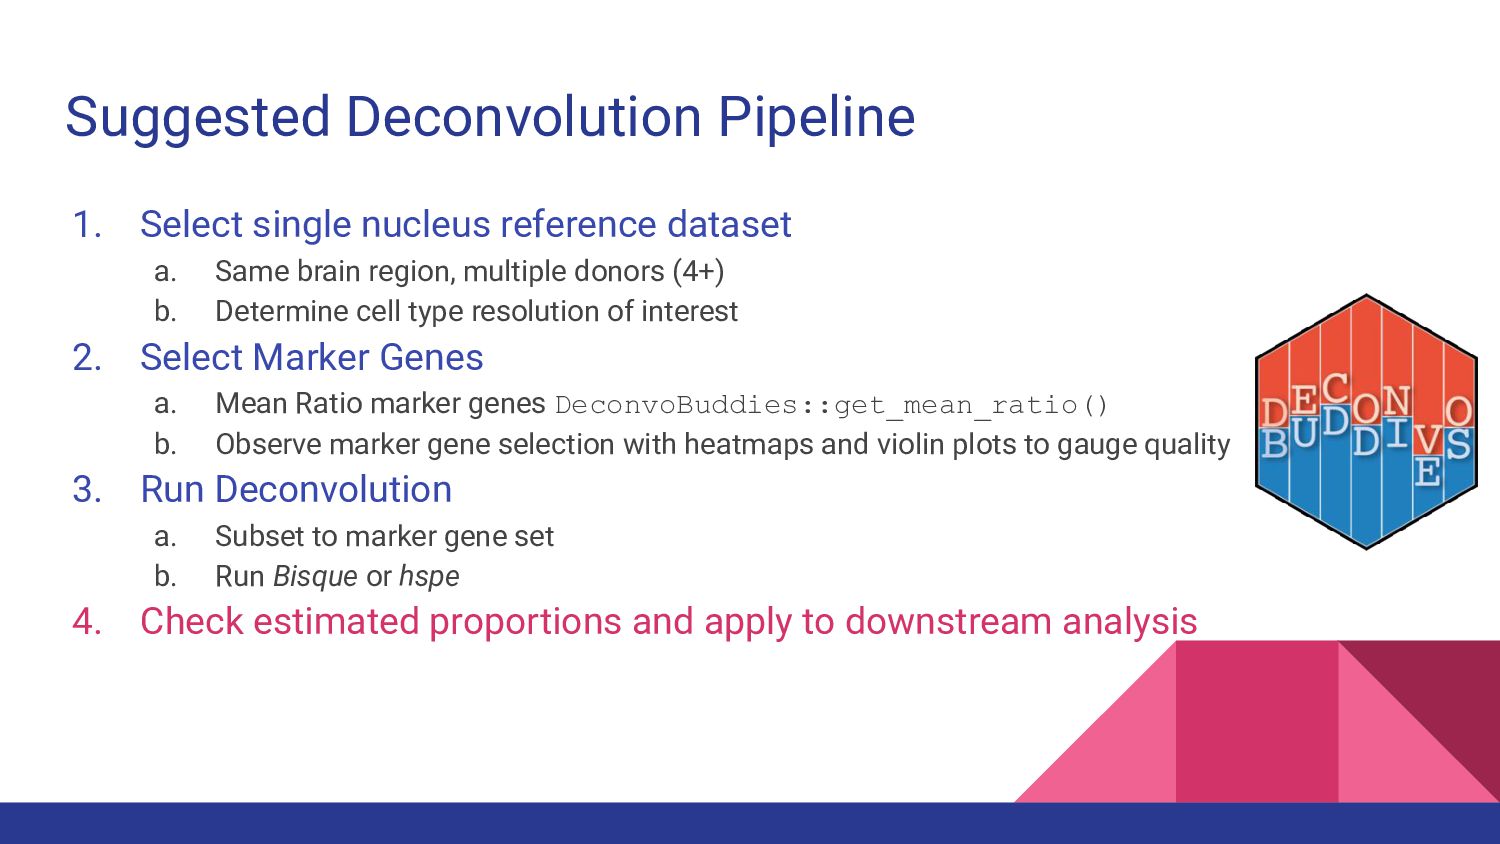
Suggested Deconvolution Pipeline 1. Select single nucleus reference dataset a.
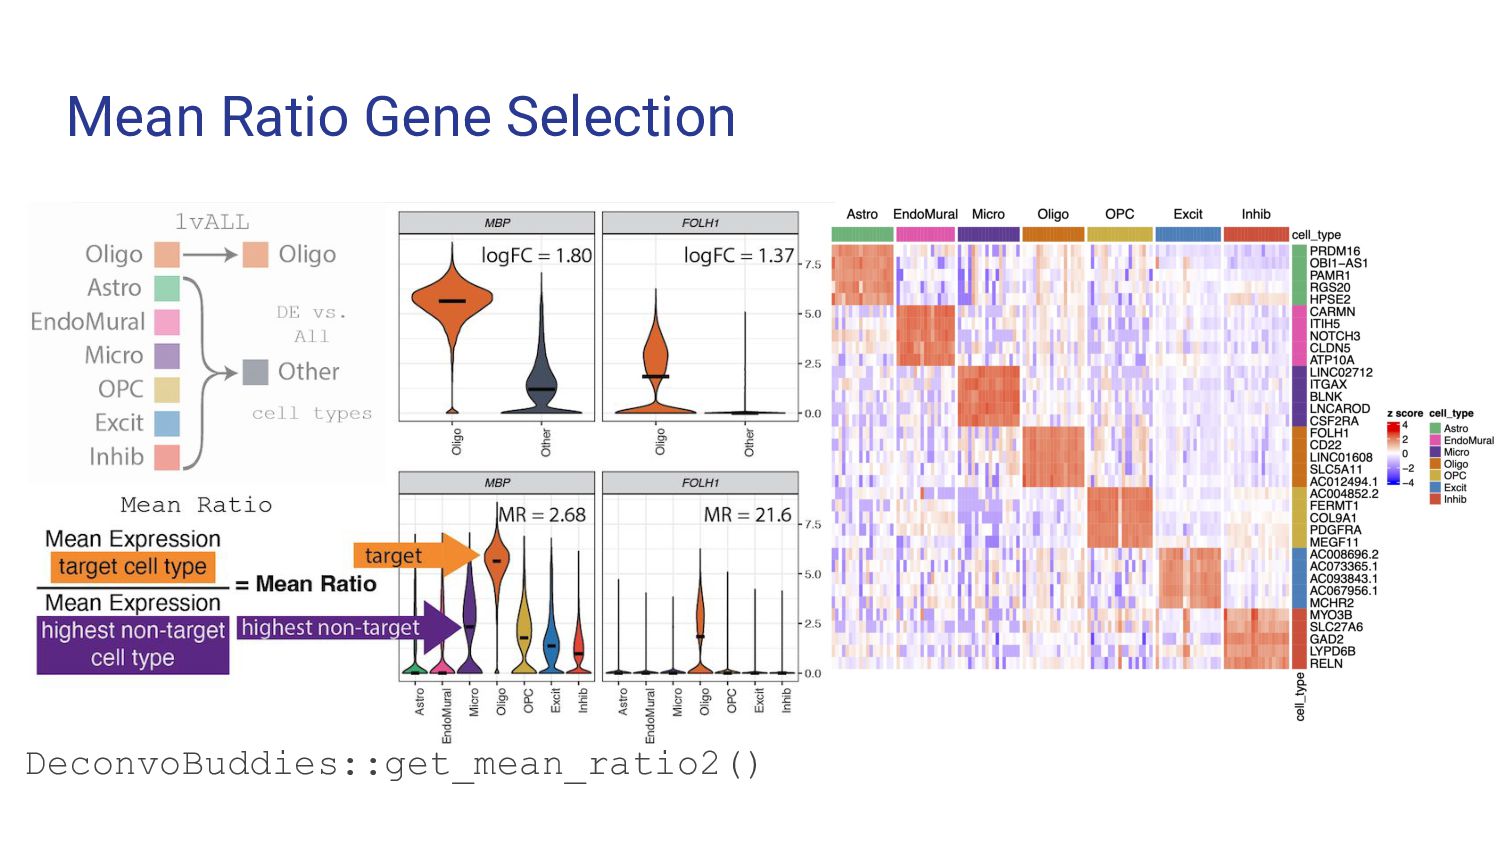
Same brain region, multiple donors (4+) b. Determine cell type resolution of interest 2. Select Marker Genes a. Mean Ratio marker genes DeconvoBuddies::get_mean_ratio() b. Observe marker gene selection with heatmaps and violin plots to gauge quality 3. Run Deconvolution a. Subset to marker gene set b. Run Bisque or hspe 4. Check estimated proportions and apply to downstream analysis -
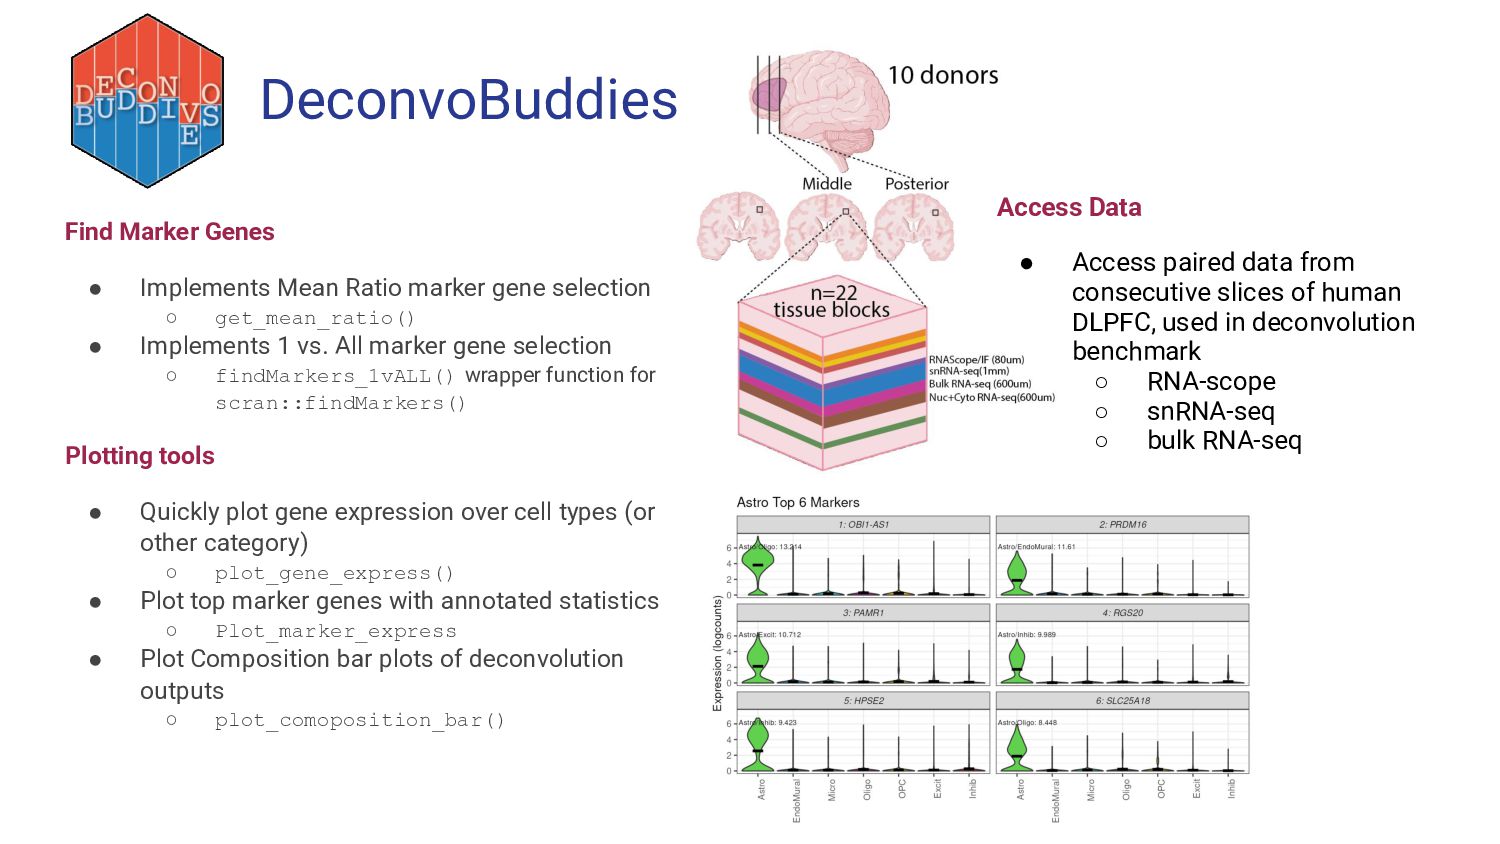
DeconvoBuddies Find Marker Genes • Implements Mean Ratio marker gene
selection ◦ get_mean_ratio() • Implements 1 vs. All marker gene selection ◦ findMarkers_1vALL() wrapper function for scran::findMarkers() Plotting tools • Quickly plot gene expression over cell types (or other category) ◦ plot_gene_express() • Plot top marker genes with annotated statistics ◦ Plot_marker_express • Plot Composition bar plots of deconvolution outputs ◦ plot_comoposition_bar() Access Data • Access paired data from consecutive slices of human DLPFC, used in deconvolution benchmark ◦ RNA-scope ◦ snRNA-seq ◦ bulk RNA-seq -
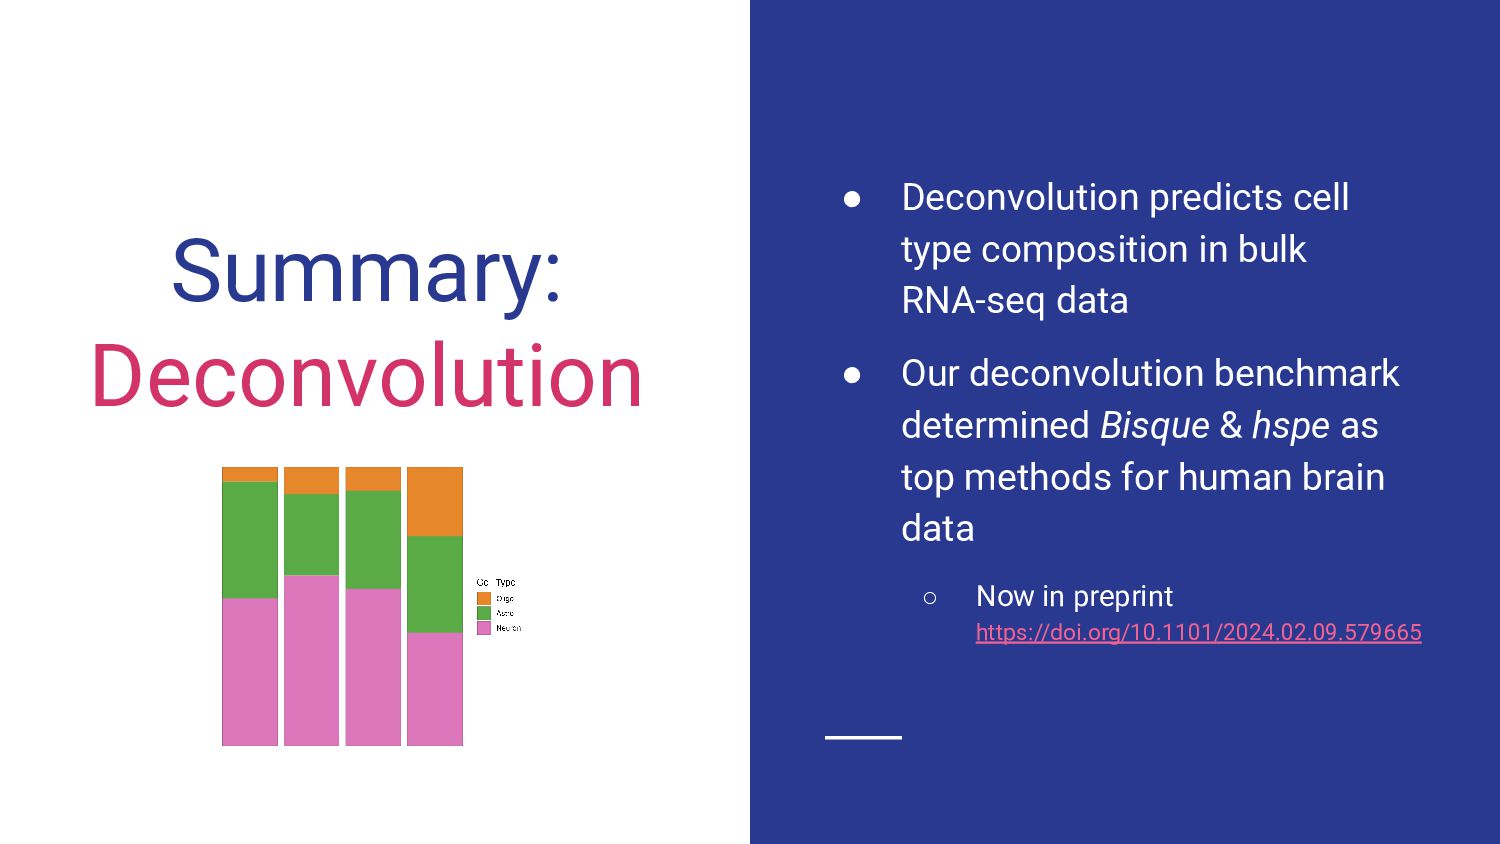
Summary: Deconvolution • Deconvolution predicts cell type composition in bulk
RNA-seq data • Our deconvolution benchmark determined Bisque & hspe as top methods for human brain data ◦ Now in preprint https://doi.org/10.1101/2024.02.09.579665 -
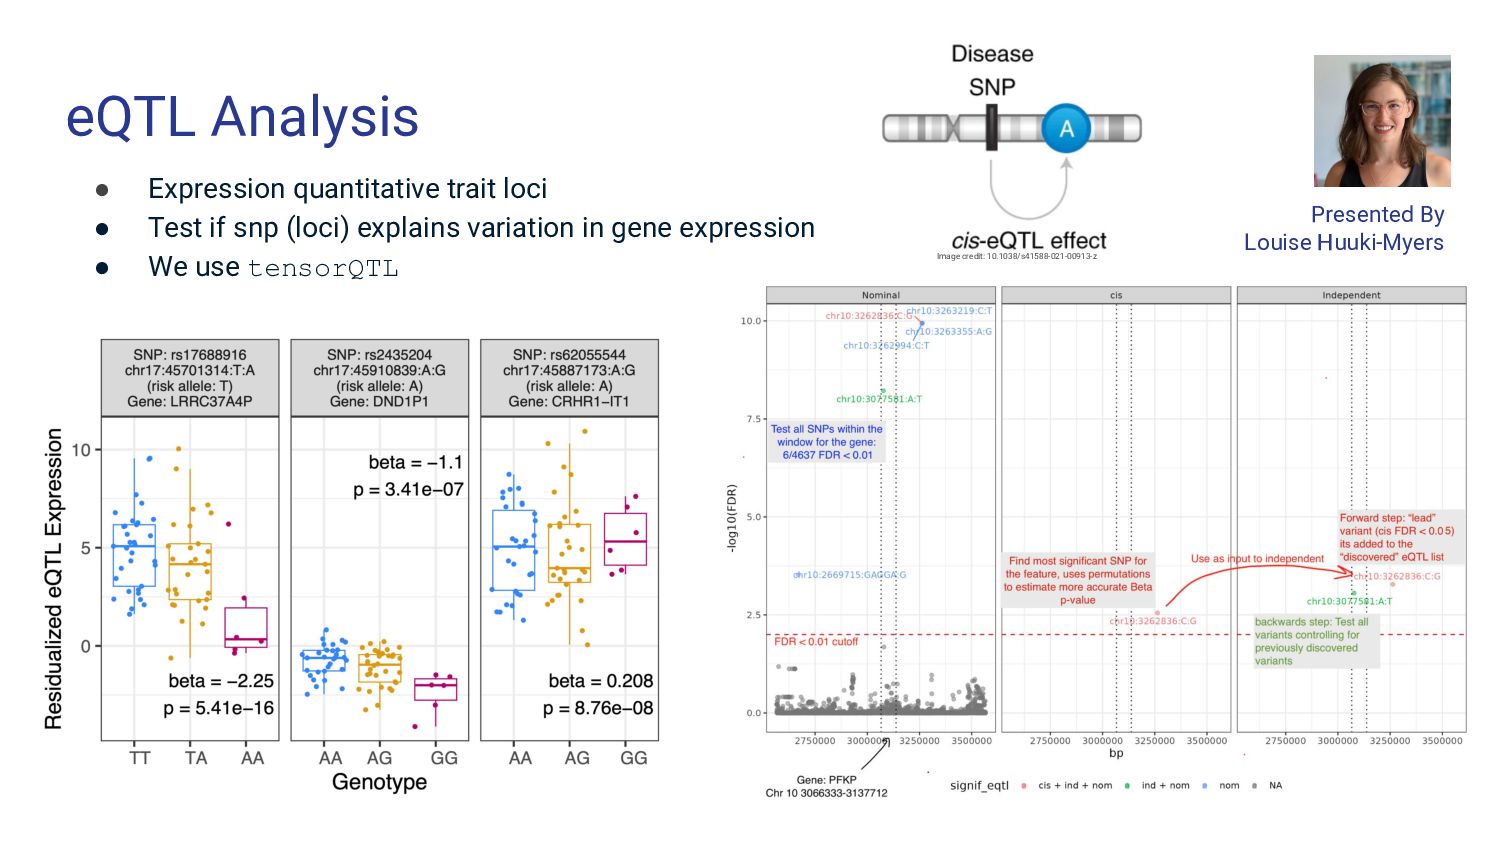
eQTL Analysis • Expression quantitative trait loci • Test if
snp (loci) explains variation in gene expression • We use tensorQTL Presented By Louise Huuki-Myers Image credit: 10.1038/s41588-021-00913-z -
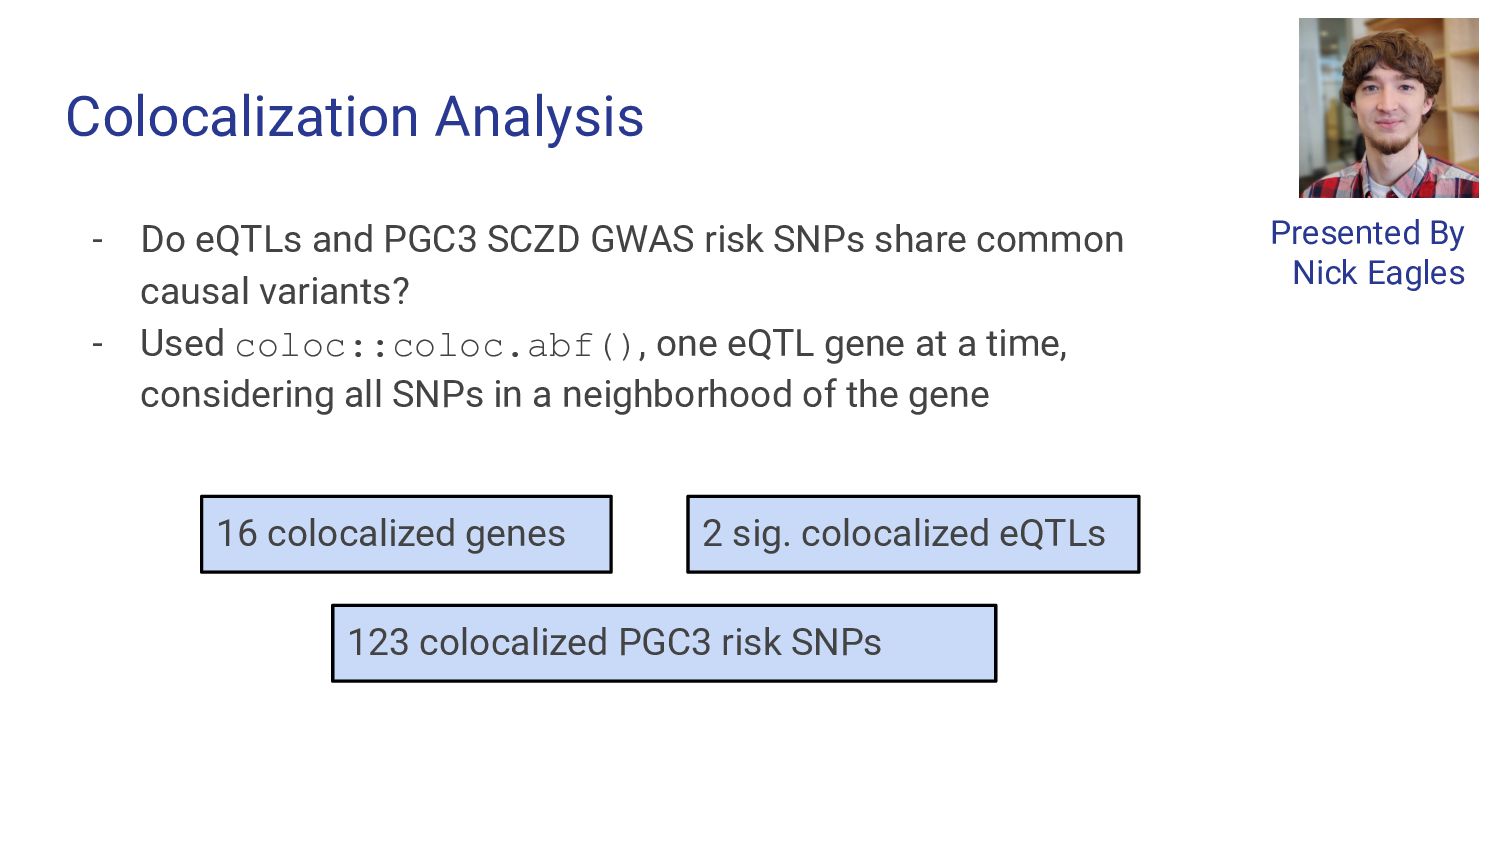
- Do eQTLs and PGC3 SCZD GWAS risk SNPs share
common causal variants? - Used coloc::coloc.abf(), one eQTL gene at a time, considering all SNPs in a neighborhood of the gene Colocalization Analysis Presented By Nick Eagles 16 colocalized genes 2 sig. colocalized eQTLs 123 colocalized PGC3 risk SNPs -
qsvaR Background - Post-mortem studies involve a post-mortem interval where
tissue degrades before being frozen - Different transcripts degrade at different rates - Degradation confounds biological signal in differential expression analysis and can produce false positives -
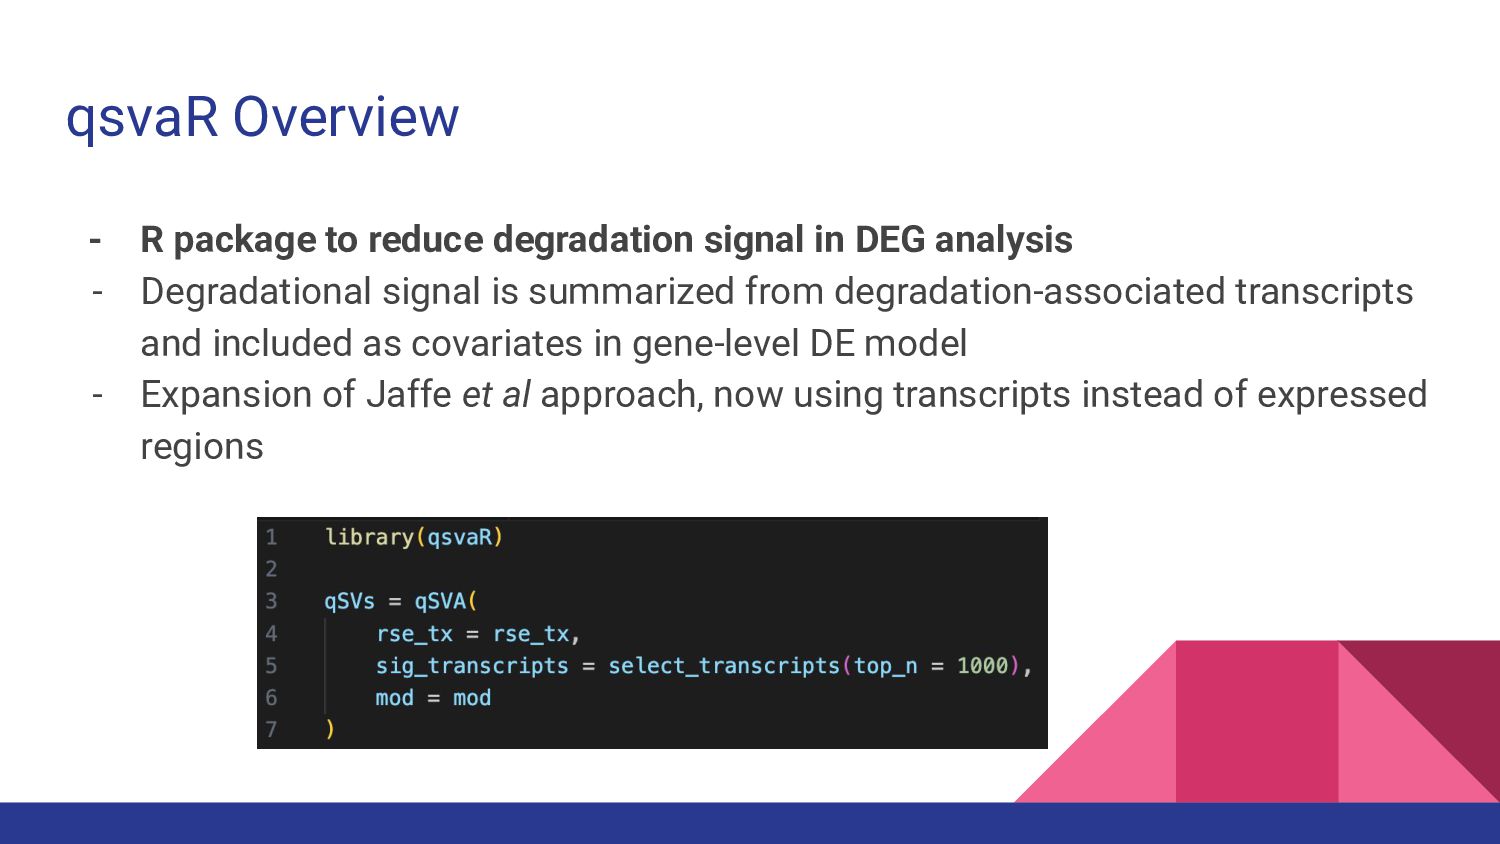
qsvaR Overview - R package to reduce degradation signal in
DEG analysis - Degradational signal is summarized from degradation-associated transcripts and included as covariates in gene-level DE model - Expansion of Jaffe et al approach, now using transcripts instead of expressed regions -
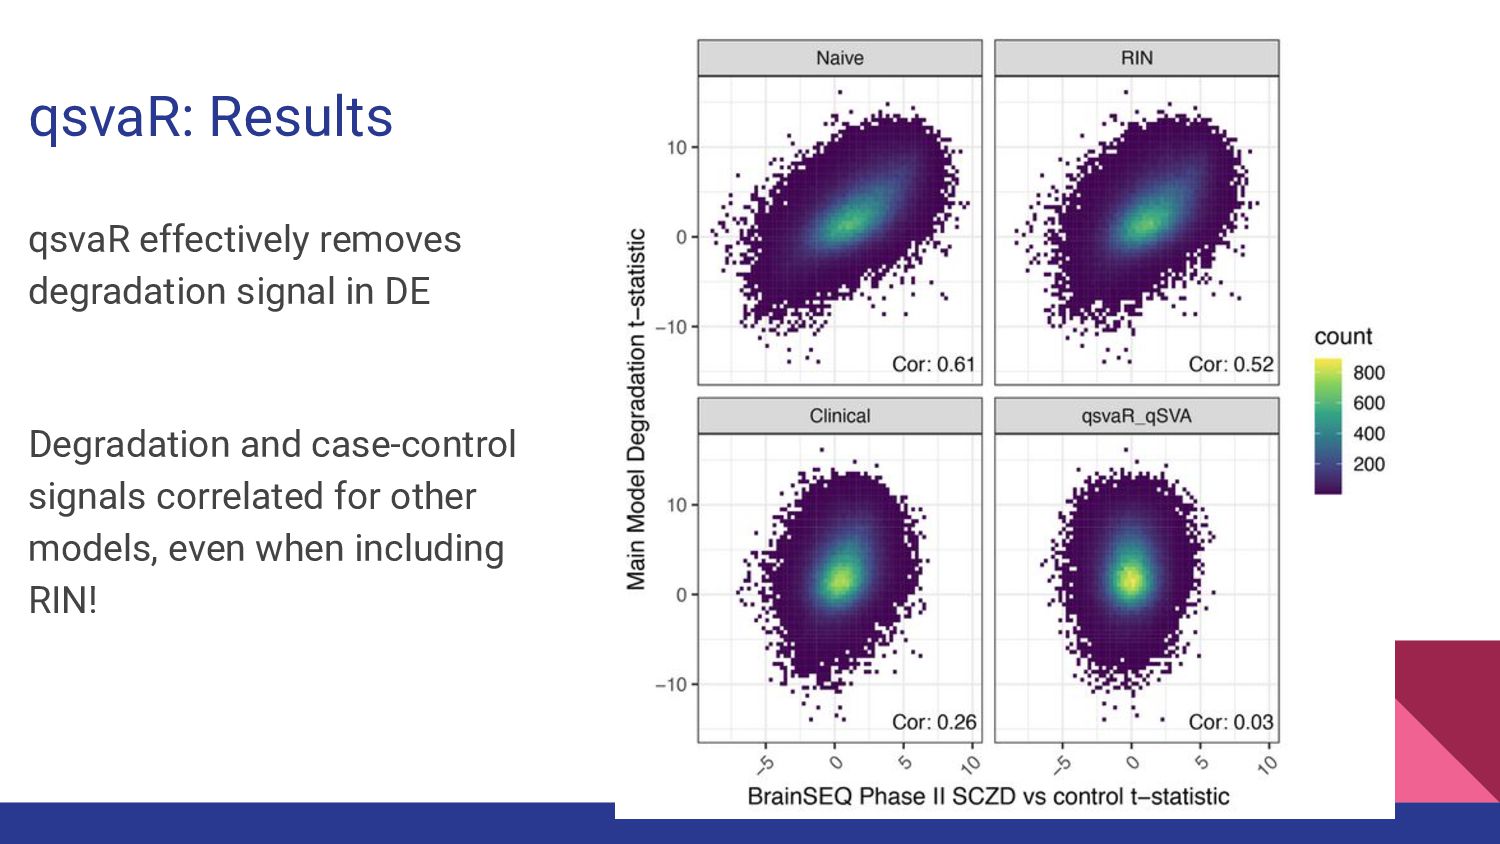
qsvaR: Results qsvaR effectively removes degradation signal in DE Degradation
and case-control signals correlated for other models, even when including RIN! -
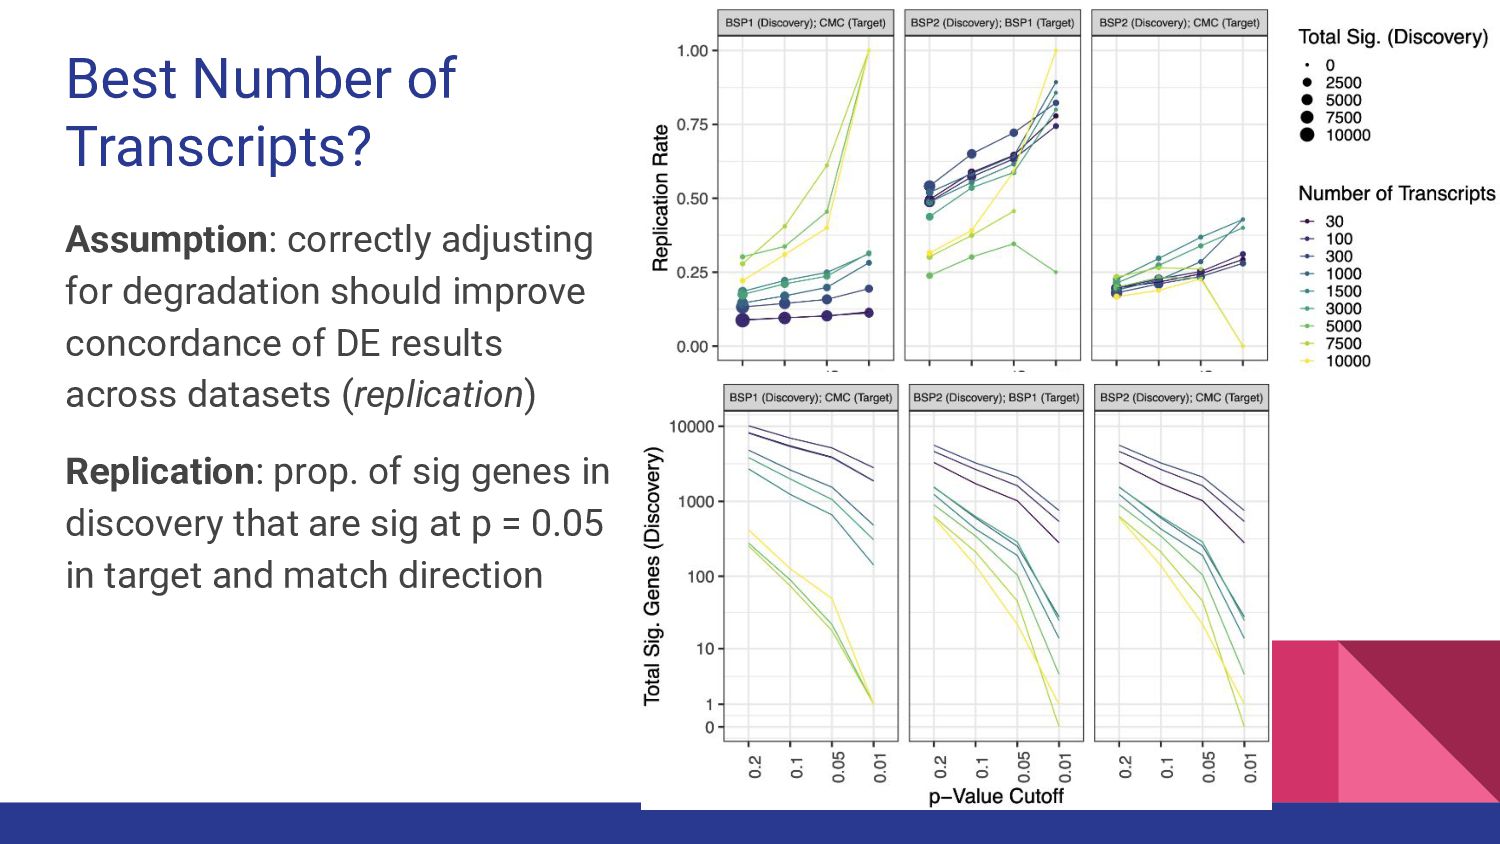
Best Number of Transcripts? Assumption: correctly adjusting for degradation should
improve concordance of DE results across datasets (replication) Replication: prop. of sig genes in discovery that are sig at p = 0.05 in target and match direction -
Summary: qsvaR • qsvaR is an R package reducing the
confounding effect of degradation on DE • Requires transcript-level data instead of expressed regions • Upcoming manuscript -
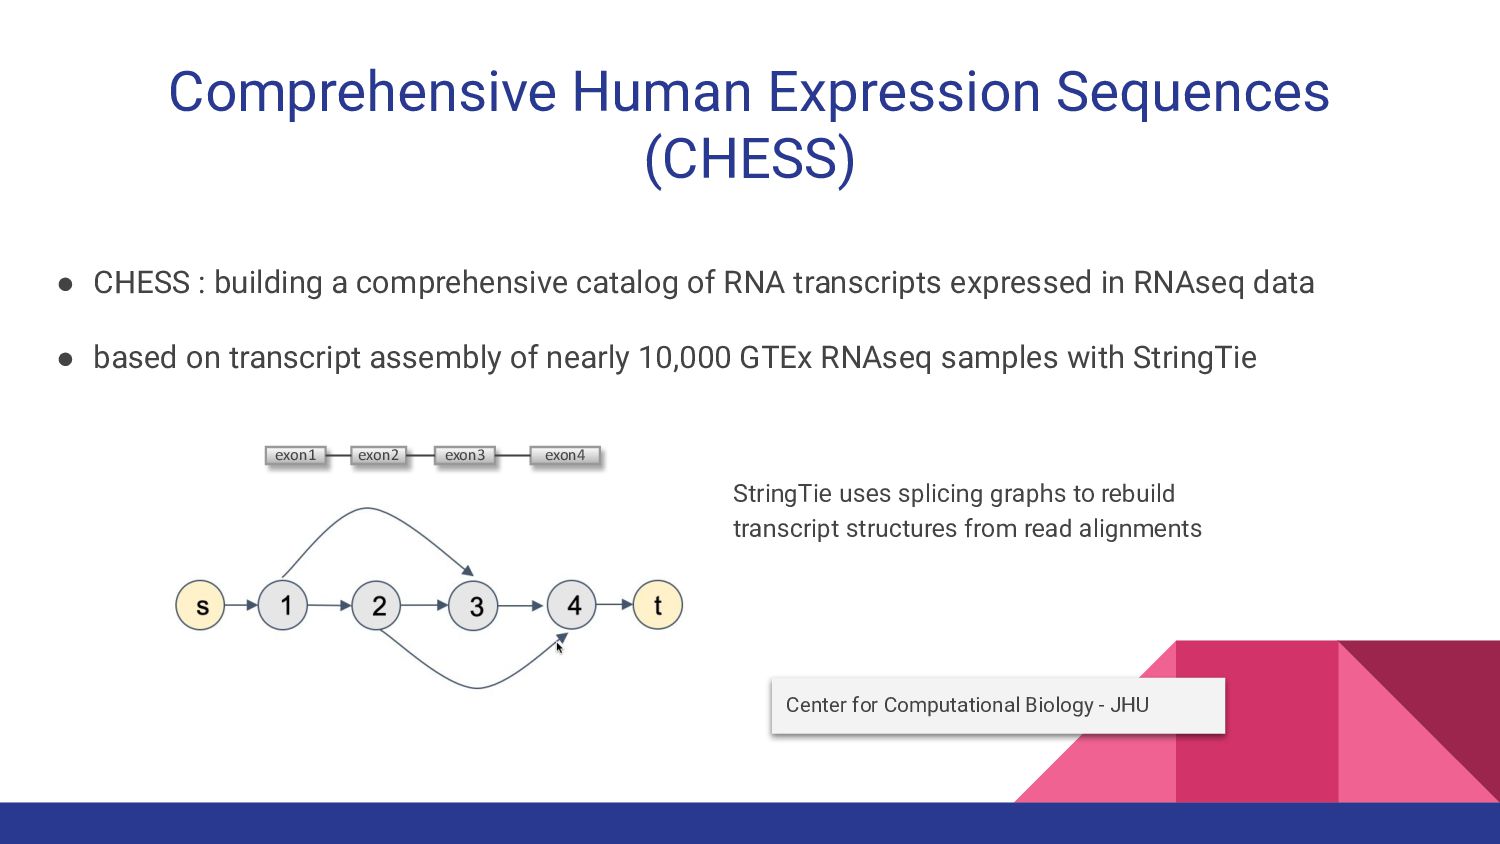
Center for Computational Biology - JHU • CHESS : building
a comprehensive catalog of RNA transcripts expressed in RNAseq data • based on transcript assembly of nearly 10,000 GTEx RNAseq samples with StringTie Comprehensive Human Expression Sequences (CHESS) exon2 exon3 exon1 exon4 StringTie uses splicing graphs to rebuild transcript structures from read alignments -
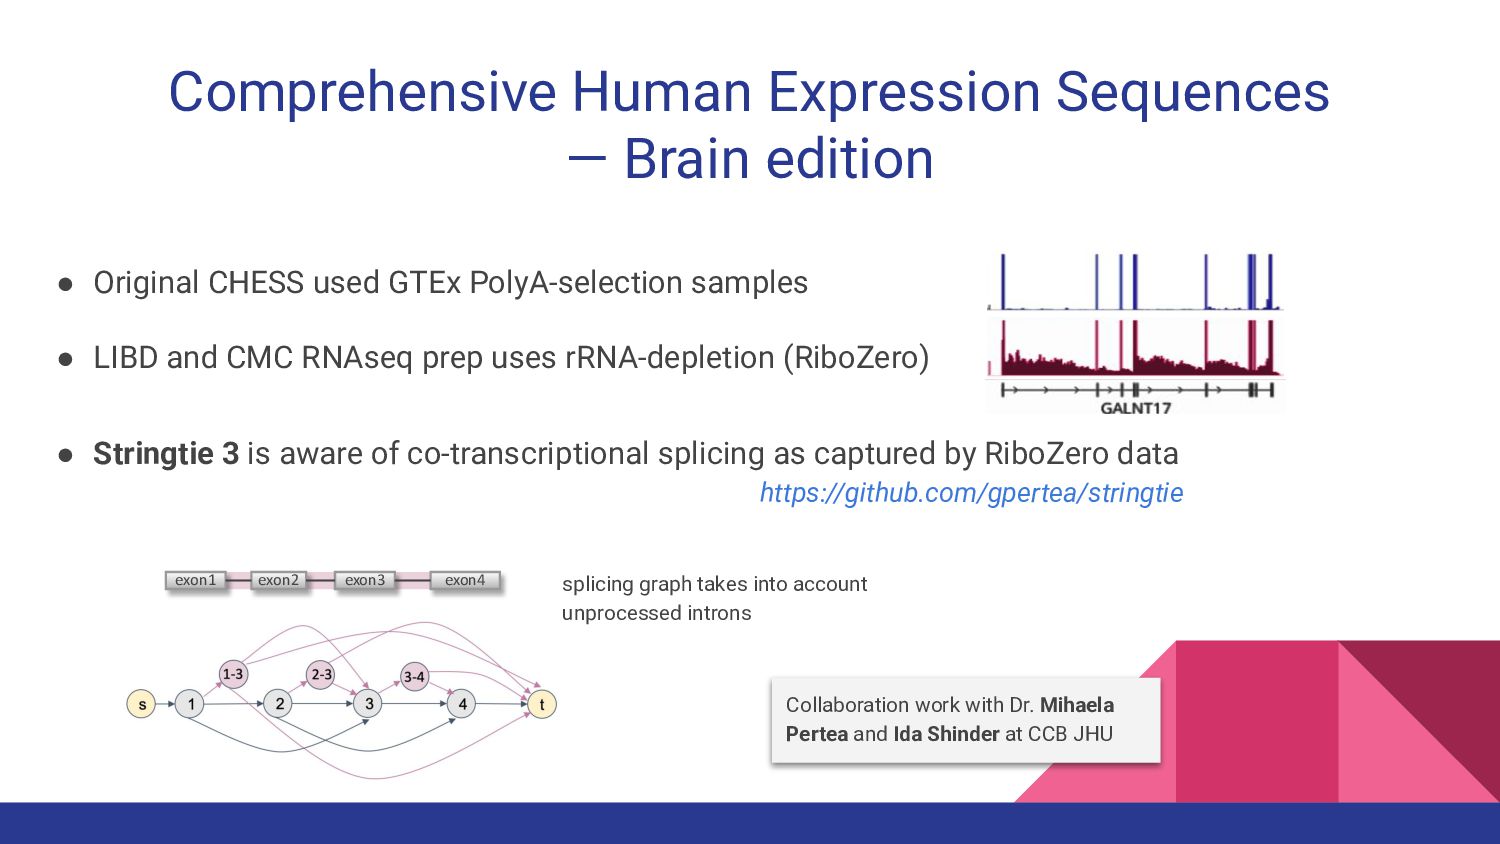
Collaboration work with Dr. Mihaela Pertea and Ida Shinder at
CCB JHU • Original CHESS used GTEx PolyA-selection samples • LIBD and CMC RNAseq prep uses rRNA-depletion (RiboZero) • Stringtie 3 is aware of co-transcriptional splicing as captured by RiboZero data Comprehensive Human Expression Sequences — Brain edition exon2 exon3 exon1 exon4 splicing graph takes into account unprocessed introns https://github.com/gpertea/stringtie -
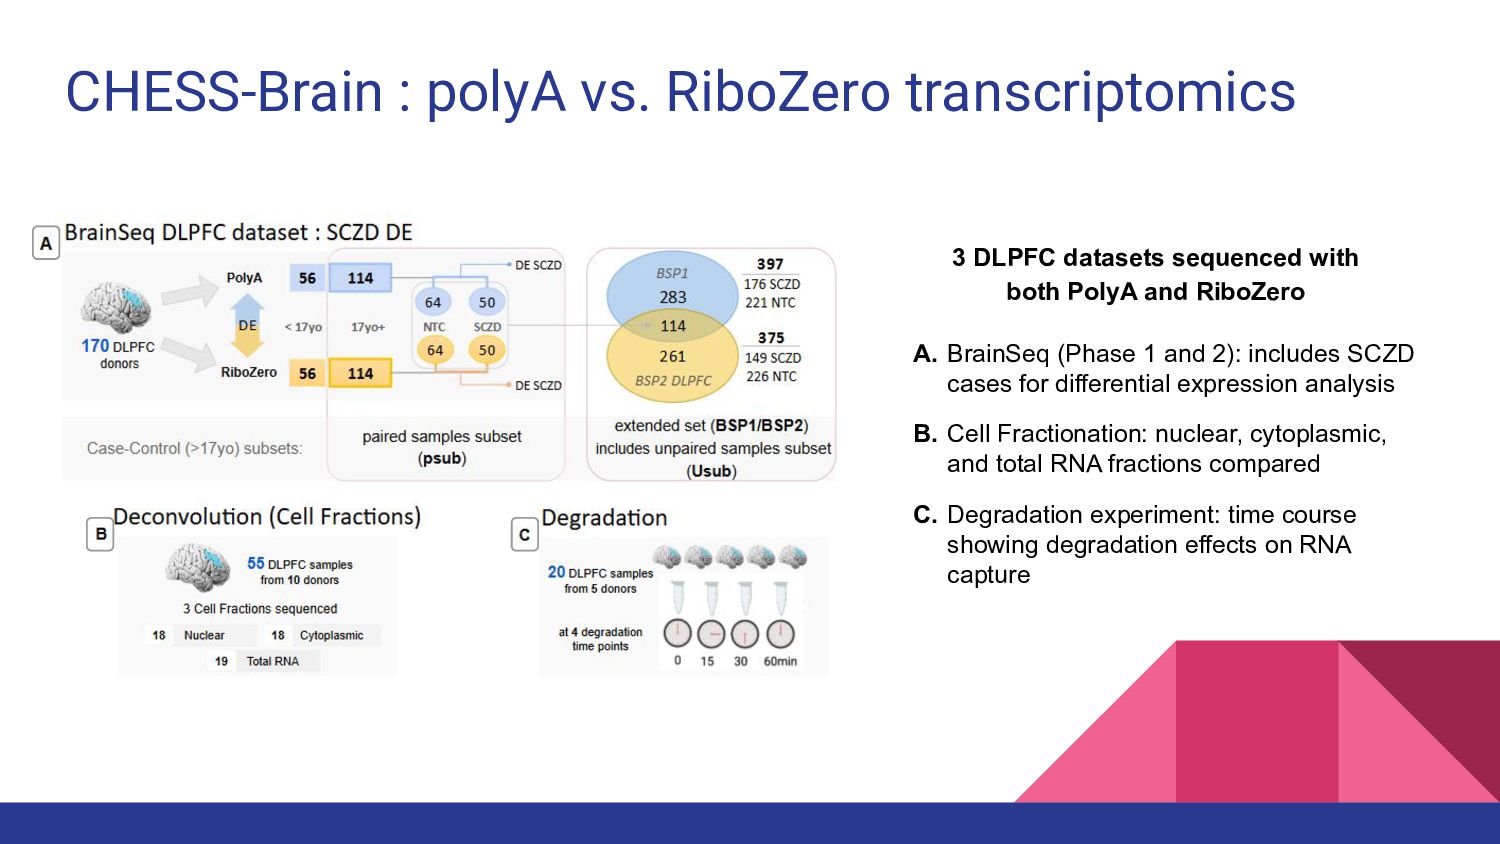
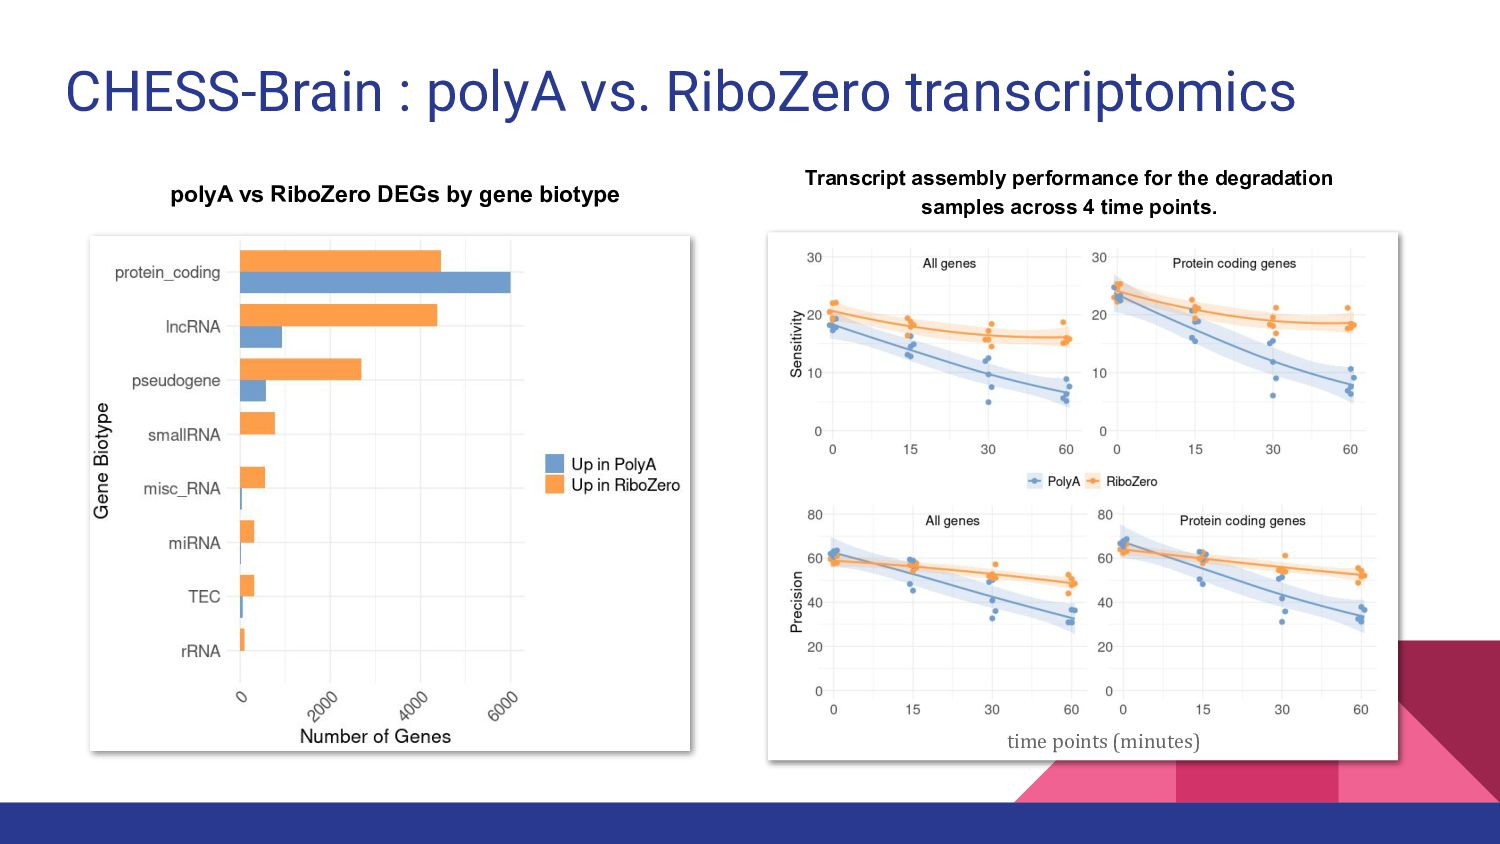
CHESS-Brain : polyA vs. RiboZero transcriptomics A. BrainSeq (Phase 1
and 2): includes SCZD cases for differential expression analysis B. Cell Fractionation: nuclear, cytoplasmic, and total RNA fractions compared C. Degradation experiment: time course showing degradation effects on RNA capture 3 DLPFC datasets sequenced with both PolyA and RiboZero -
CHESS-Brain : polyA vs. RiboZero transcriptomics Transcript assembly performance for
the degradation samples across 4 time points. time points (minutes) polyA vs RiboZero DEGs by gene biotype -
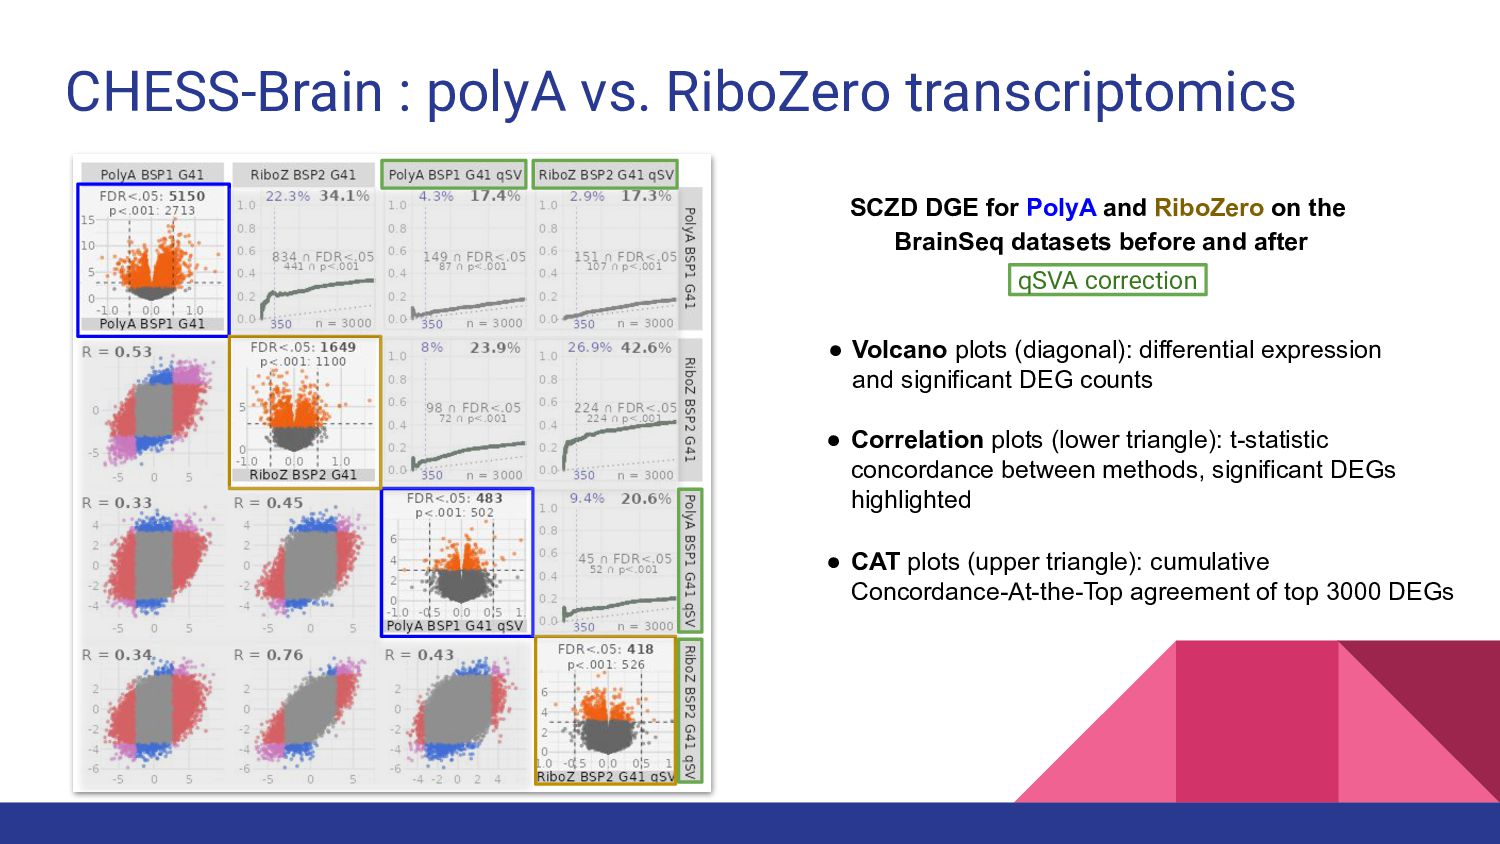
SCZD DGE for PolyA and RiboZero on the BrainSeq datasets
before and after • Volcano plots (diagonal): differential expression and significant DEG counts CHESS-Brain : polyA vs. RiboZero transcriptomics • Correlation plots (lower triangle): t-statistic concordance between methods, significant DEGs highlighted • CAT plots (upper triangle): cumulative Concordance-At-the-Top agreement of top 3000 DEGs qSVA correction -
Summary: CHESS-Brain • Data-driven expansion of the catalog of RNA
transcripts expressed in brain tissue • Improved transcript-level analyses of LIBD RNAseq RiboZero data • Upcoming manuscripts -
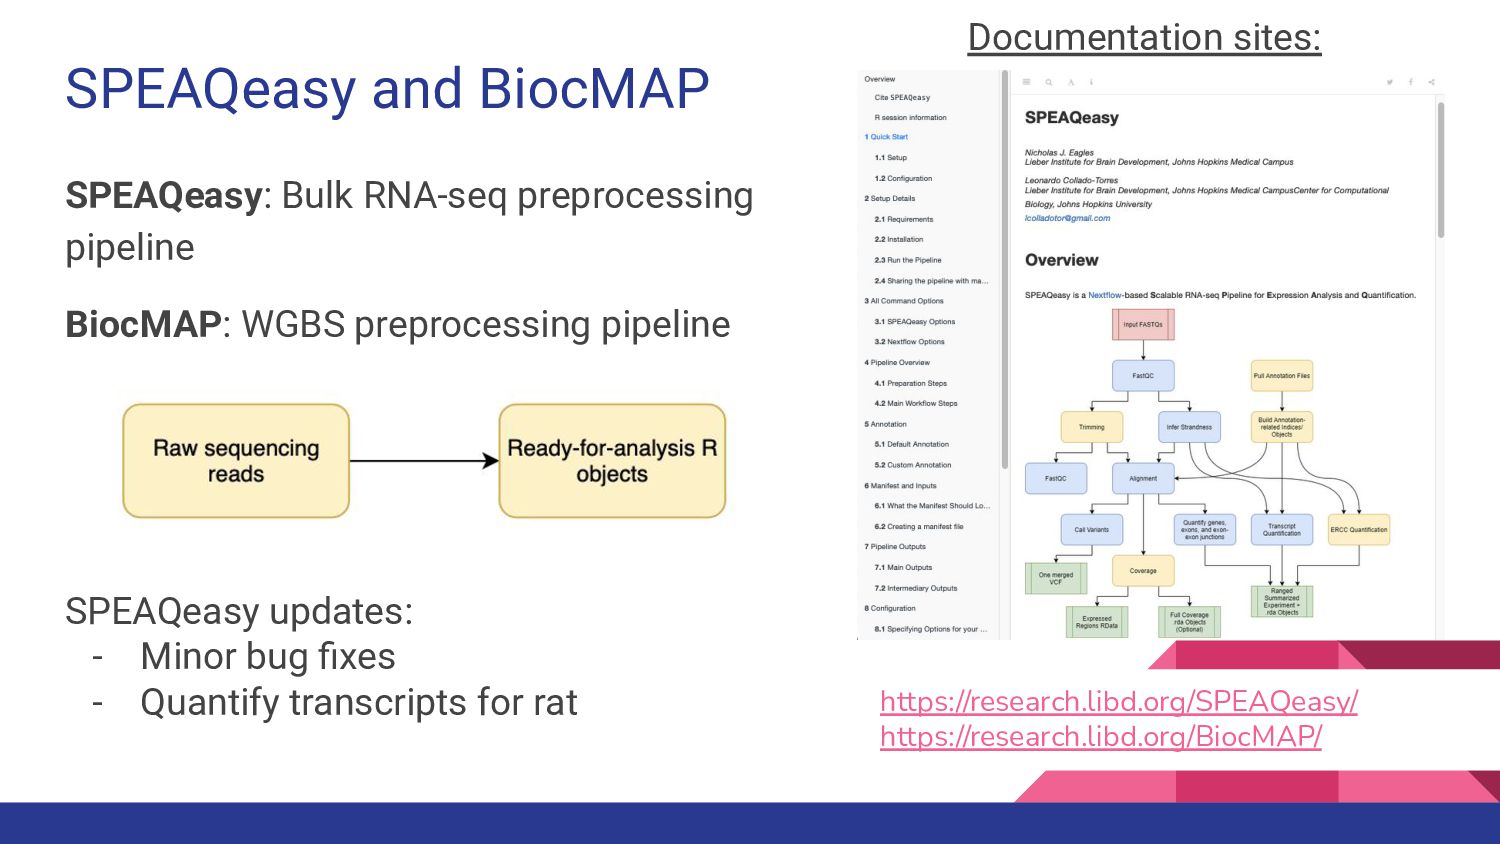
SPEAQeasy and BiocMAP SPEAQeasy: Bulk RNA-seq preprocessing pipeline BiocMAP: WGBS
preprocessing pipeline Documentation sites: https://research.libd.org/SPEAQeasy/ https://research.libd.org/BiocMAP/ SPEAQeasy updates: - Minor bug fixes - Quantify transcripts for rat -
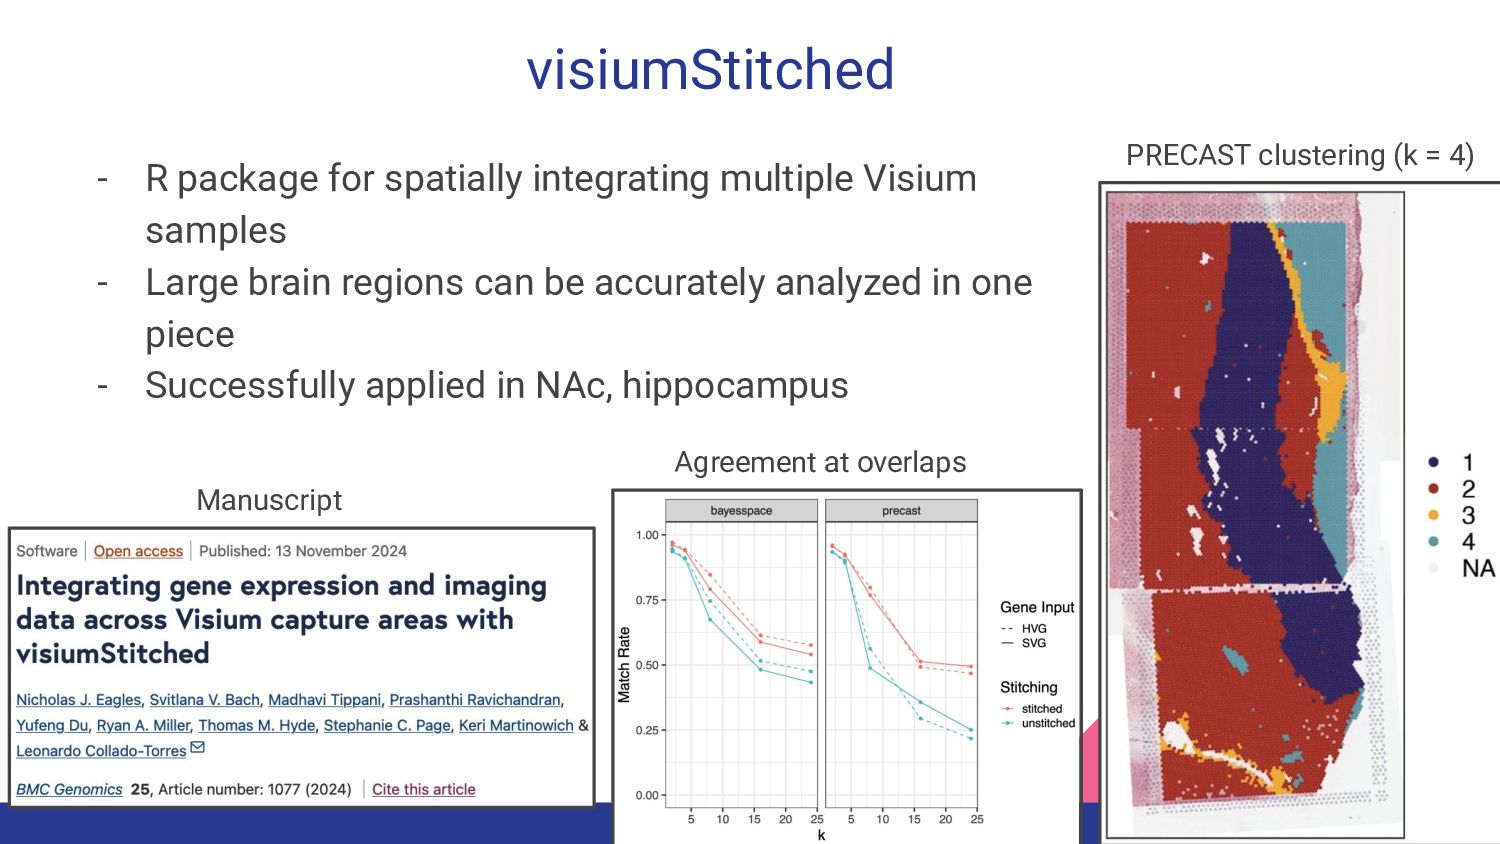
visiumStitched - R package for spatially integrating multiple Visium samples
- Large brain regions can be accurately analyzed in one piece - Successfully applied in NAc, hippocampus Agreement at overlaps PRECAST clustering (k = 4) Manuscript -
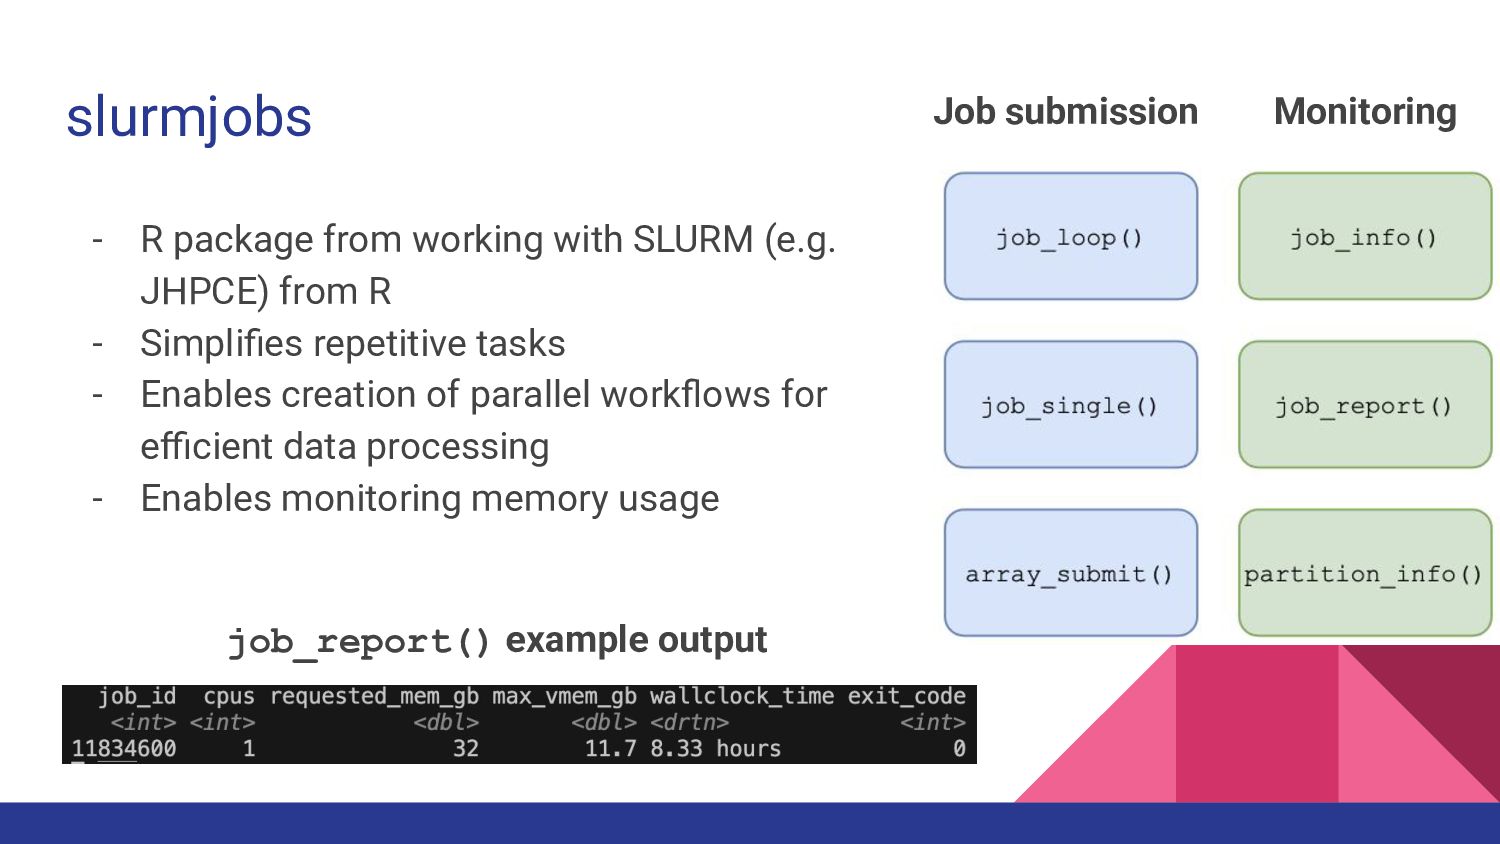
slurmjobs - R package from working with SLURM (e.g. JHPCE)
from R - Simplifies repetitive tasks - Enables creation of parallel workflows for efficient data processing - Enables monitoring memory usage Job submission Monitoring job_report() example output -
Packages Maintained by the Team • SpatialLIBD • DeconvoBuddies •
qsvaR • SPEAQeasy • visiumStitched • slurmjobs -
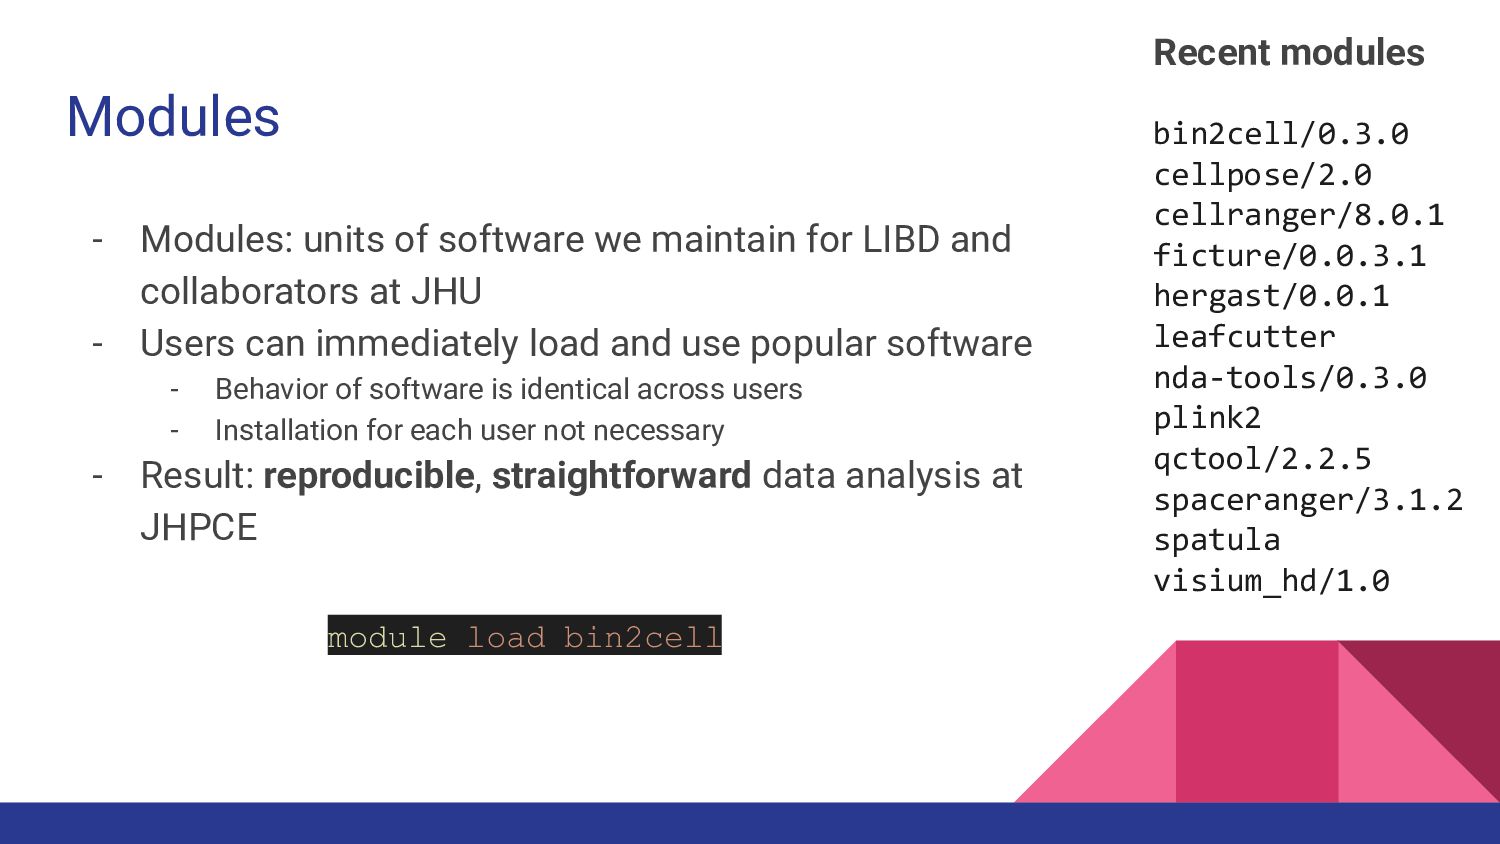
Modules - Modules: units of software we maintain for LIBD
and collaborators at JHU - Users can immediately load and use popular software - Behavior of software is identical across users - Installation for each user not necessary - Result: reproducible, straightforward data analysis at JHPCE bin2cell/0.3.0 cellpose/2.0 cellranger/8.0.1 ficture/0.0.3.1 hergast/0.0.1 leafcutter nda-tools/0.3.0 plink2 qctool/2.2.5 spaceranger/3.1.2 spatula visium_hd/1.0 Recent modules module load bin2cell -
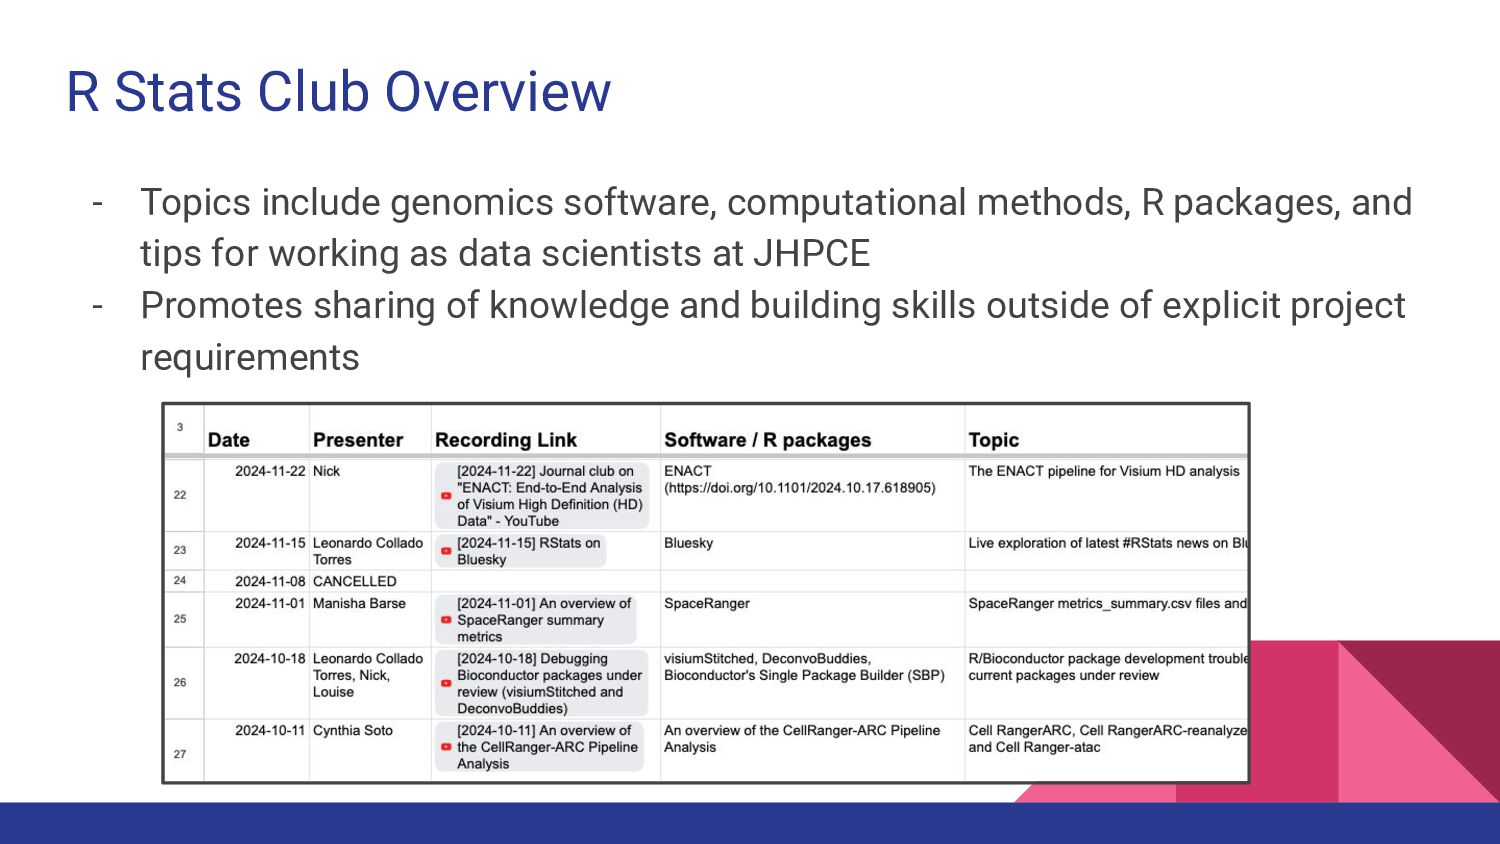
R Stats Club Overview - Topics include genomics software, computational
methods, R packages, and tips for working as data scientists at JHPCE - Promotes sharing of knowledge and building skills outside of explicit project requirements -
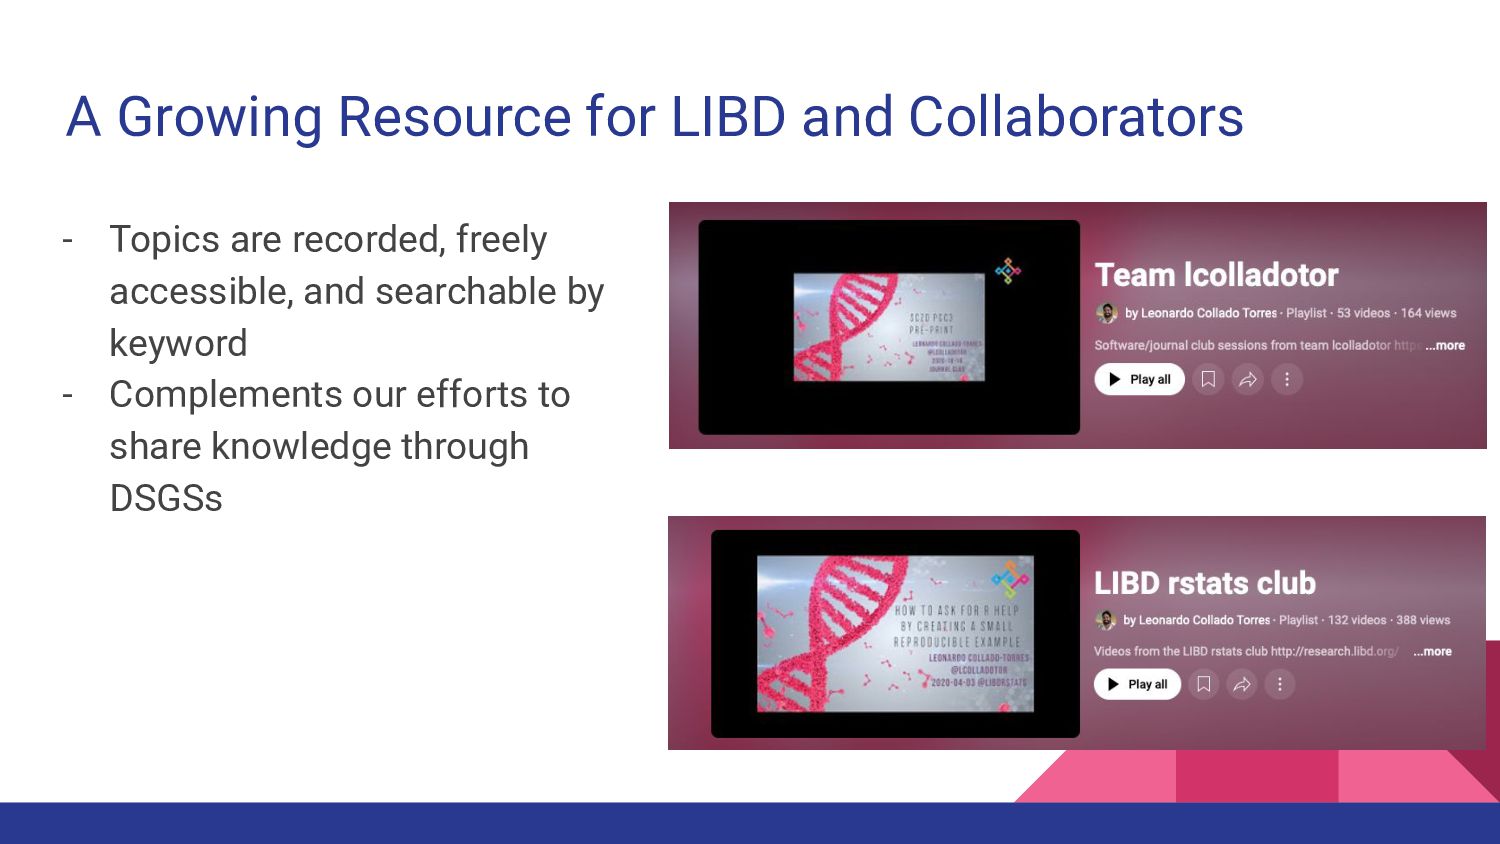
A Growing Resource for LIBD and Collaborators - Topics are
recorded, freely accessible, and searchable by keyword - Complements our efforts to share knowledge through DSGSs