Upgrade to Pro — share decks privately, control downloads, hide ads and more …

Team lcolladotor Journal Club: Crumblr

Louise Huuki-Myers
February 14, 2025
9

Team lcolladotor Journal Club: Crumblr

Team lcolladotor Journal Club: Fast, flexible analysis of differences in cellular composition with crumblr
Gabriel E. Hoffman and Panos Roussos, bioRxiv, 2025
doi: https://doi.org/10.1101/2025.01.29.635498

Presented by: Louise Huuki-Myers, Feb 12, 2025
Recording of our journal club meeting: youtube.com/watch?v=Hi5Eg1rBRnc

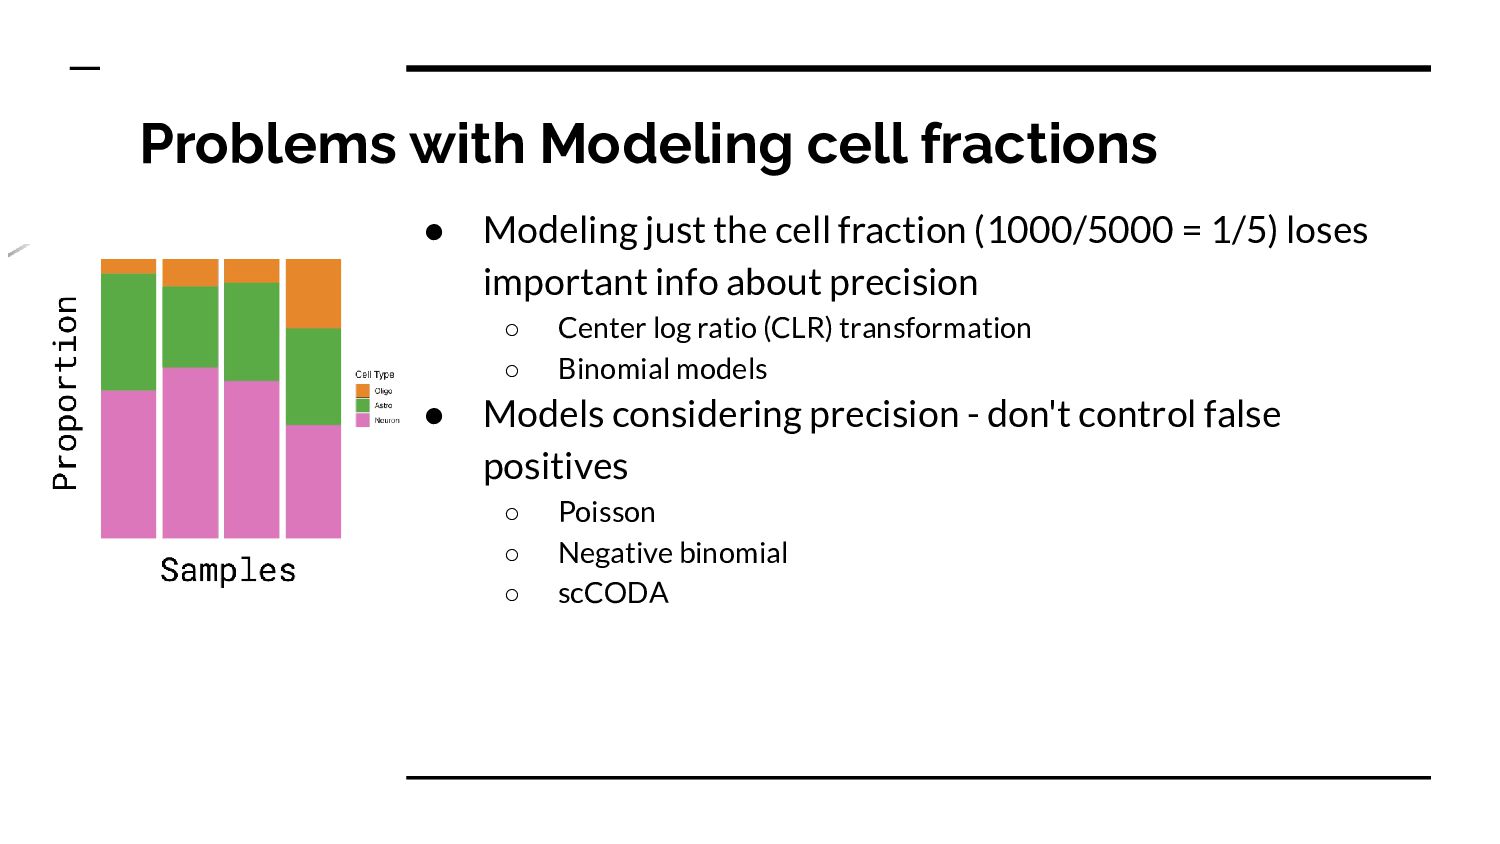
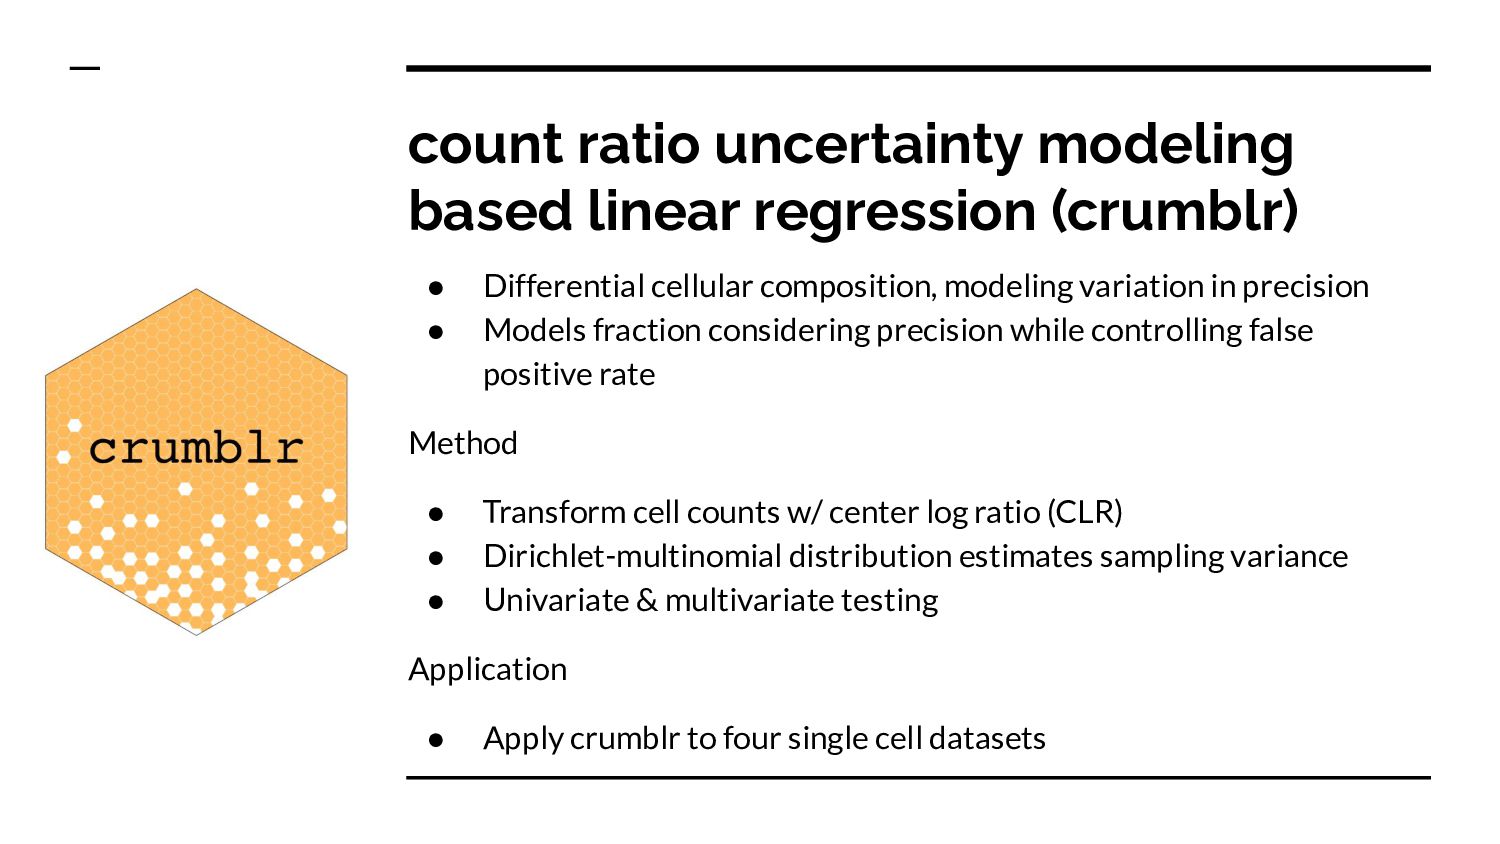
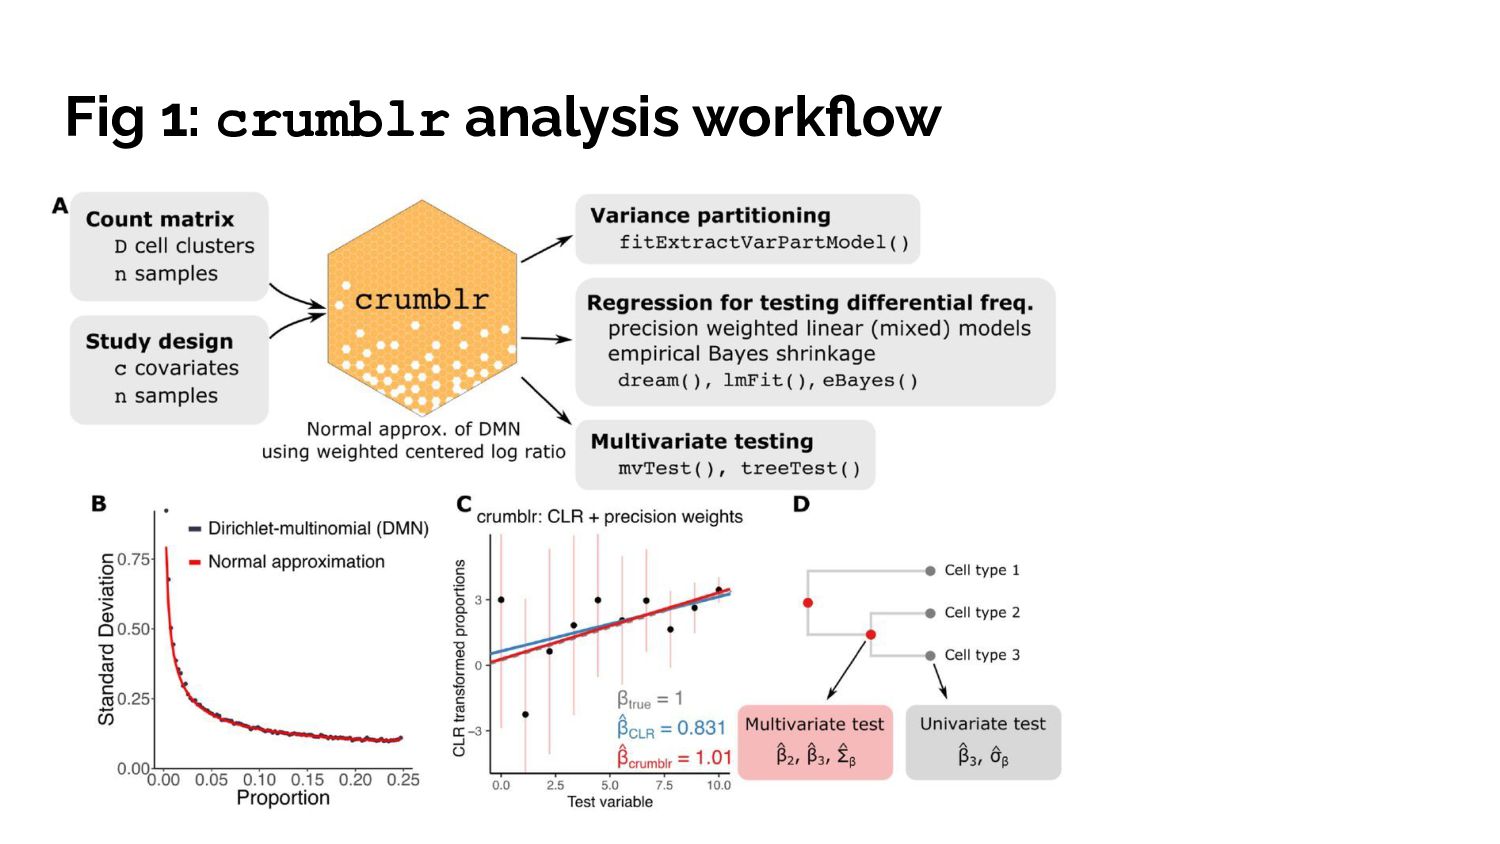
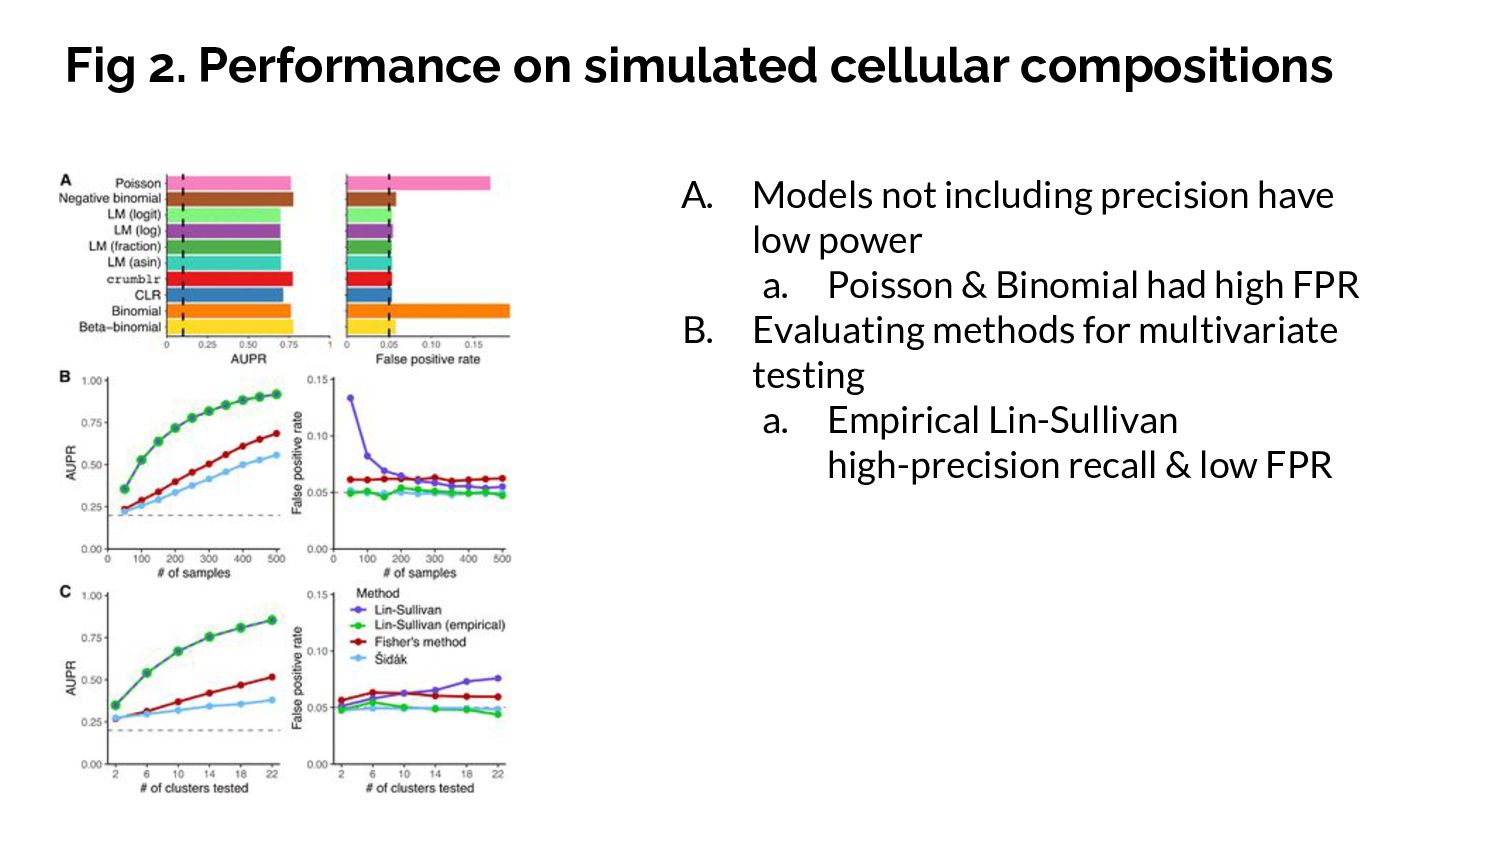
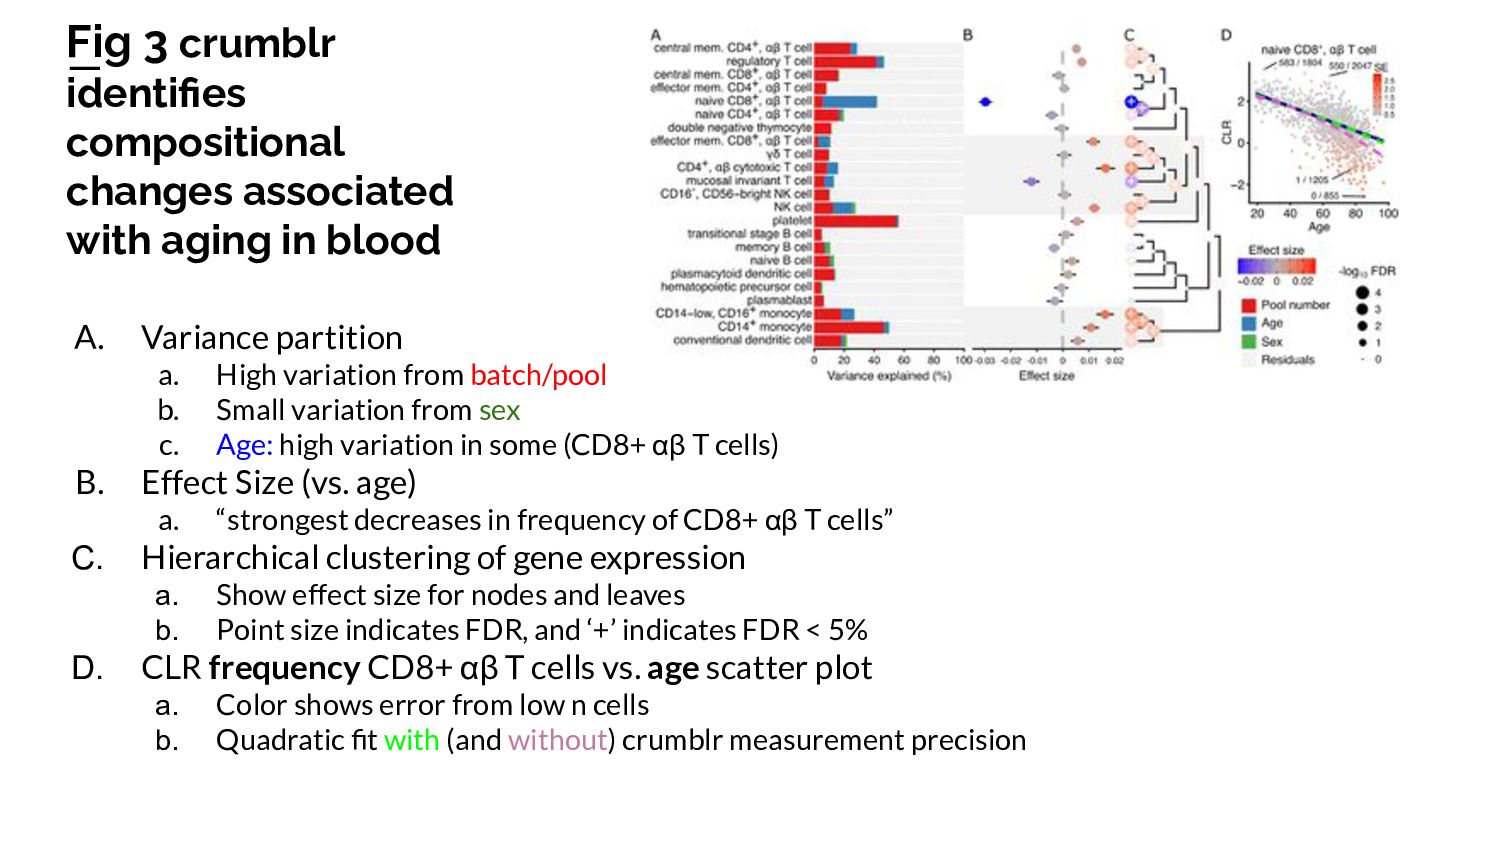
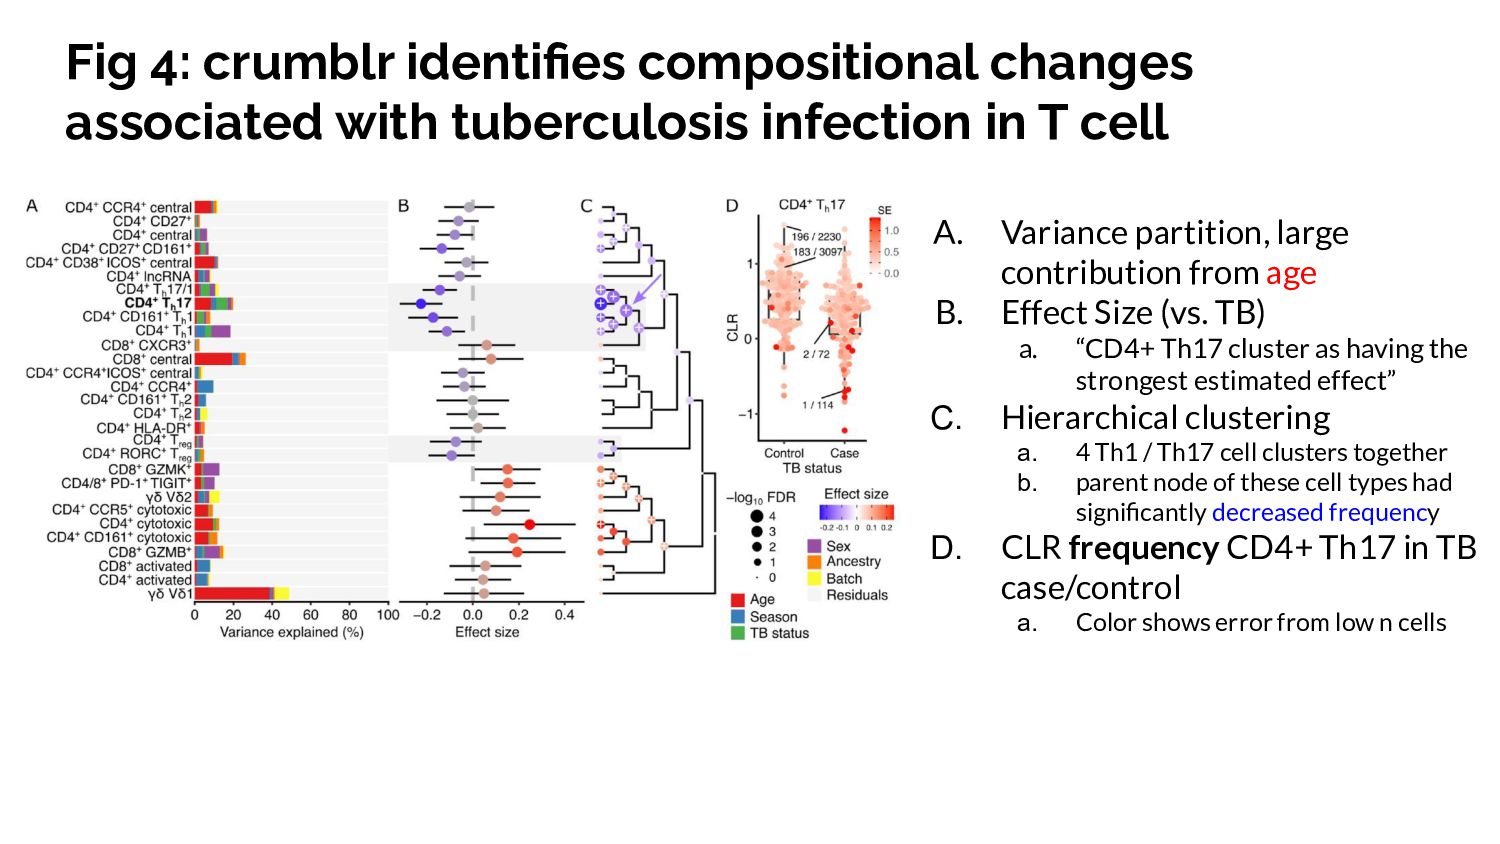
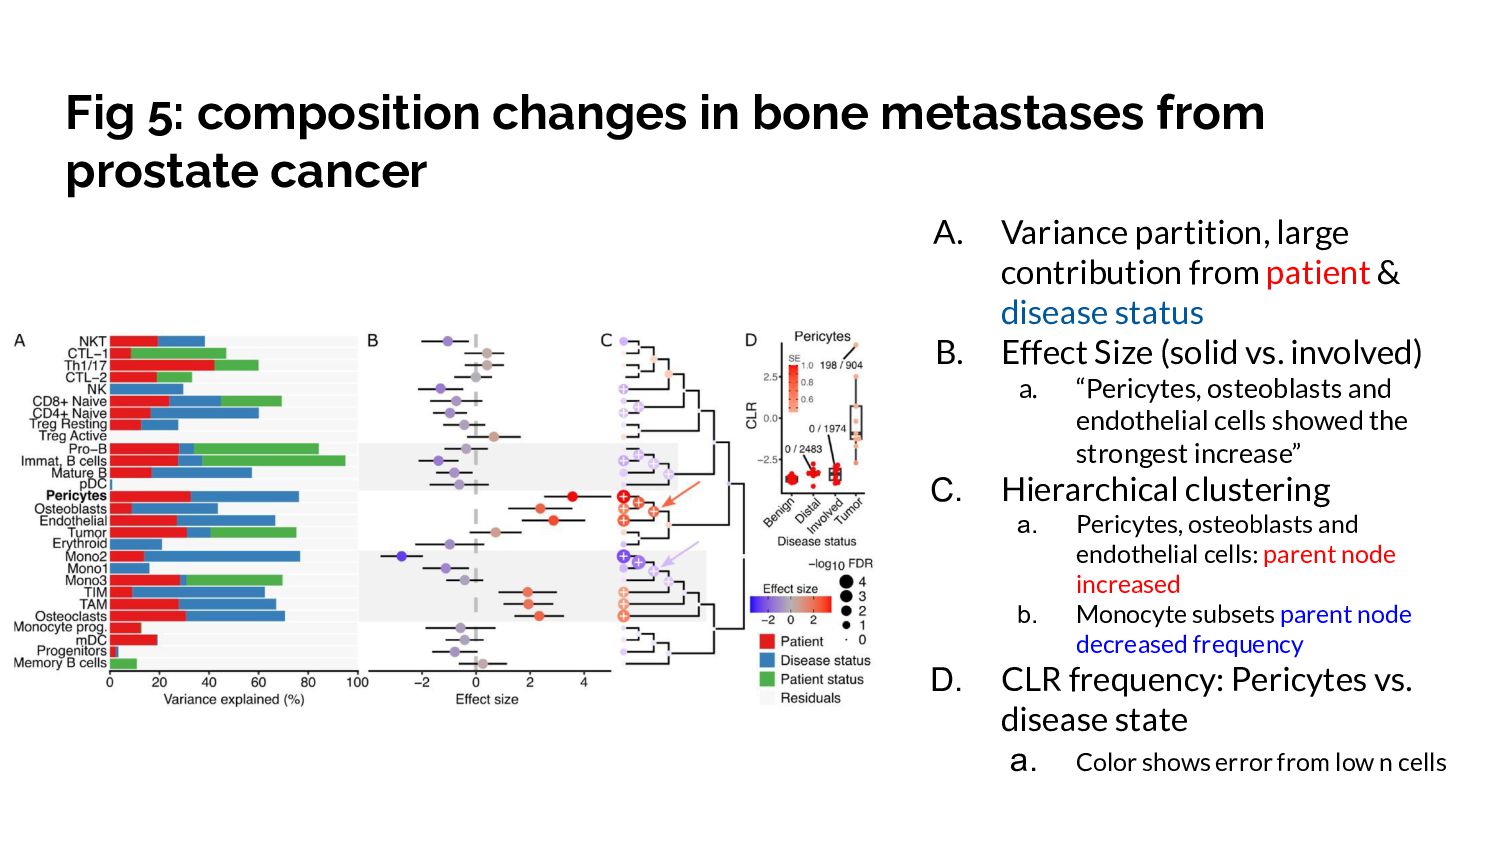
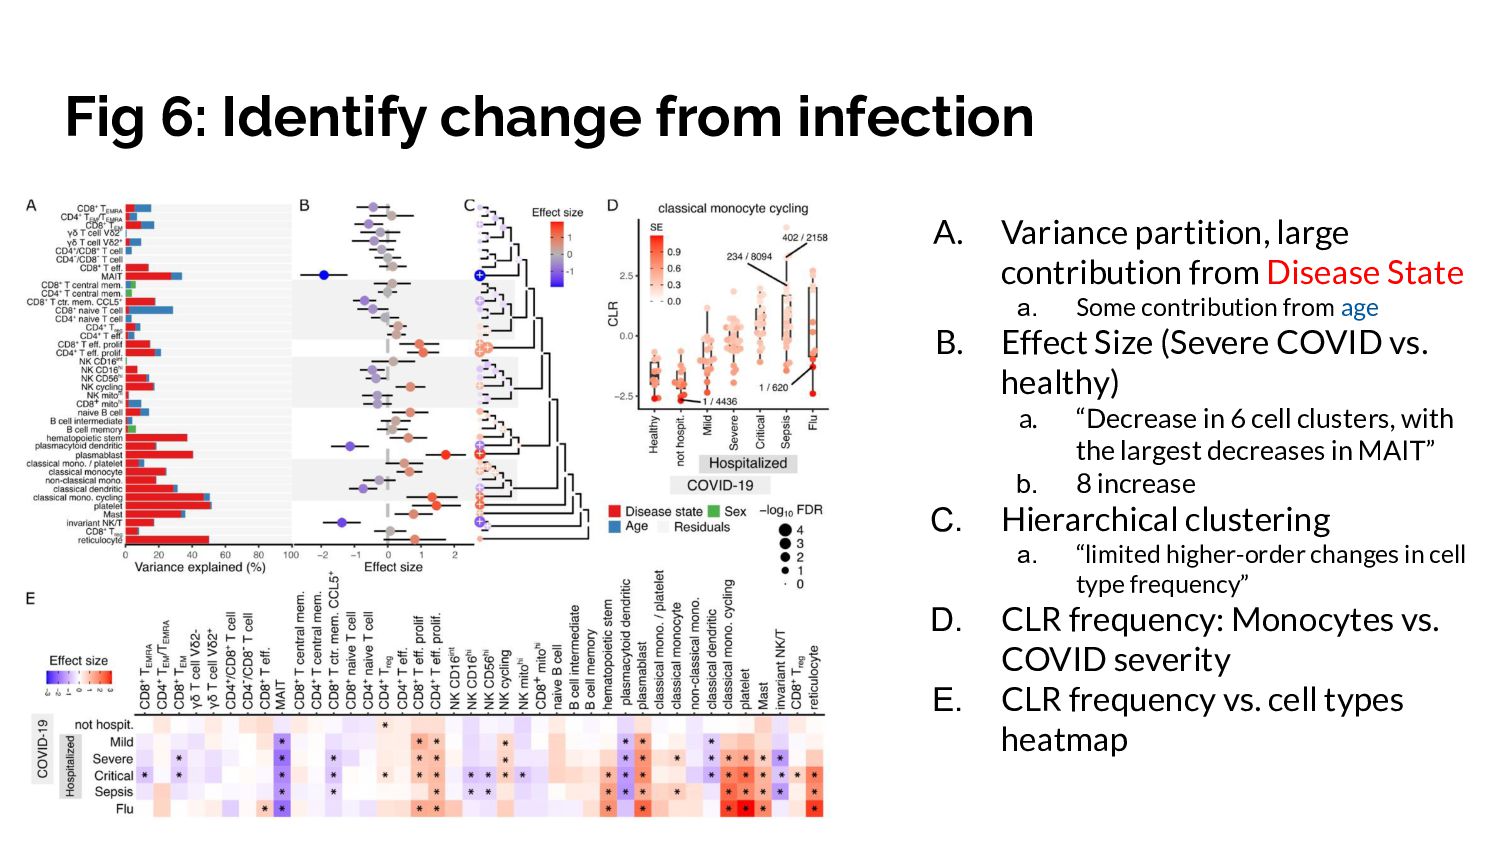
Crumblr is a statistical method for testing differential composition analysis, such as testing for changes in cell type frequency across disease state. The method transforms frequency data with CLR and considers the precision of the cell fraction measurement in the modeling. The software package contains tools for variance partition, and both univariate and multivariate modeling.

Louise Huuki-Myers

February 14, 2025
Tweet

Transcript

  1. Team lcolladotor Journal Club: Fast, flexible analysis of differences in

    cellular composition with crumblr Gabriel E. Hoffman and Panos Roussos bioRxiv Jan, 2025 10.1101/2025.01.29.635498 Presented by: Louise Huuki-Myers, Feb 12, 2025
  2. Problems with Modeling cell fractions • Modeling just the cell

    fraction (1000/5000 = 1/5) loses important info about precision ◦ Center log ratio (CLR) transformation ◦ Binomial models • Models considering precision - don't control false positives ◦ Poisson ◦ Negative binomial ◦ scCODA
  3. count ratio uncertainty modeling based linear regression (crumblr) • Differential

    cellular composition, modeling variation in precision • Models fraction considering precision while controlling false positive rate Method • Transform cell counts w/ center log ratio (CLR) • Dirichlet-multinomial distribution estimates sampling variance • Univariate & multivariate testing Application • Apply crumblr to four single cell datasets
  4. Fig 2. Performance on simulated cellular compositions A. Models not

    including precision have low power a. Poisson & Binomial had high FPR B. Evaluating methods for multivariate testing a. Empirical Lin-Sullivan high-precision recall & low FPR
  5. Fig 3 crumblr identifies compositional changes associated with aging in

    blood A. Variance partition a. High variation from batch/pool b. Small variation from sex c. Age: high variation in some (CD8+ αβ T cells) B. Effect Size (vs. age) a. “strongest decreases in frequency of CD8+ αβ T cells” C. Hierarchical clustering of gene expression a. Show effect size for nodes and leaves b. Point size indicates FDR, and ‘+’ indicates FDR < 5% D. CLR frequency CD8+ αβ T cells vs. age scatter plot a. Color shows error from low n cells b. Quadratic fit with (and without) crumblr measurement precision
  6. Fig 4: crumblr identifies compositional changes associated with tuberculosis infection

    in T cell A. Variance partition, large contribution from age B. Effect Size (vs. TB) a. “CD4+ Th17 cluster as having the strongest estimated effect” C. Hierarchical clustering a. 4 Th1 / Th17 cell clusters together b. parent node of these cell types had significantly decreased frequency D. CLR frequency CD4+ Th17 in TB case/control a. Color shows error from low n cells
  7. Fig 5: composition changes in bone metastases from prostate cancer

    A. Variance partition, large contribution from patient & disease status B. Effect Size (solid vs. involved) a. “Pericytes, osteoblasts and endothelial cells showed the strongest increase” C. Hierarchical clustering a. Pericytes, osteoblasts and endothelial cells: parent node increased b. Monocyte subsets parent node decreased frequency D. CLR frequency: Pericytes vs. disease state a. Color shows error from low n cells
  8. Fig 6: Identify change from infection A. Variance partition, large

    contribution from Disease State a. Some contribution from age B. Effect Size (Severe COVID vs. healthy) a. “Decrease in 6 cell clusters, with the largest decreases in MAIT” b. 8 increase C. Hierarchical clustering a. “limited higher-order changes in cell type frequency” D. CLR frequency: Monocytes vs. COVID severity E. CLR frequency vs. cell types heatmap
  9. Summary • Differential cellular composition testing considering precision & controlling

    False Positive rate • Tools for: ◦ Variance partition ◦ Univariate and multivariate testing over continuous or categorical variables ◦ * integrates with SingleCellExperiment • Useful at LIBD: ◦ case/control snRNA-seq datasets