Upgrade to Pro — share decks privately, control downloads, hide ads and more …

Introduction to d3

Introduction to d3

An introduction to d3 given at the university of edinburgh

Philip Roberts

February 18, 2013
Tweet

More Decks by Philip Roberts

Other Decks in Programming

Transcript

  1. Edinburgh Bus Stops Earthquakes in the last 30 days Nuclear

    War Tech Meetup Demo Sunday, 17 February 13
  2. HTML: <svg> <circle cx='20' cy='50' r='10' fill='purple' /> <rect x='100'

    y='200' width='20' height='10' stroke='green' /> </svg> D3: svg.append('circle') .attr({cx: 20, cy: 50, r: 10, fill: 'purple'}) svg.append('rect') .attr({ x: 100, y: 200, width: 20, height: 10 }) .attr('stroke', 'green') SVG building svg programmatically Sunday, 17 February 13
  3. (cx, cy) r (x1, y1) (x2, y2) (x, y) width

    height <circle /> <line /> <rect /> svg.append('circle') .attr('cx', 10) .attr('cy', 20) .attr('r', 50) svg.append('line') .attr('x1', 10) .attr('y2', 10) .attr('x2', 20) .attr('y2', 20) svg.append('rect') .attr('x', 10) .attr('y', 10) .attr('width', 50) .attr('height', 20) Shapes basic svg elements Sunday, 17 February 13
  4. <text /> svg.append('text') .attr('x', 10) .attr('y', 20) .text('foo') Shapes basic

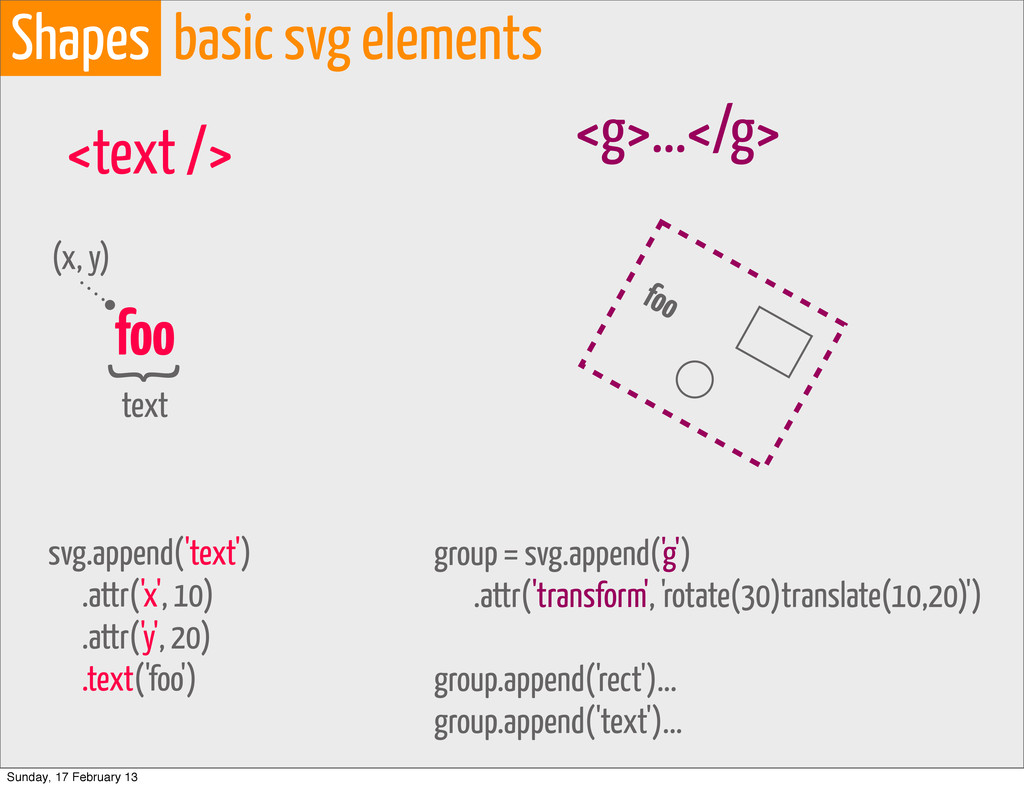
    svg elements foo (x, y) } text <g>...</g> group = svg.append('g') .attr('transform', 'rotate(30)translate(10,20)') group.append('rect')... group.append('text')... foo Sunday, 17 February 13
  5. Scales Data Binding binding data to your visualisation people =

    [ { name: ‘roy’, age: 60 }, { name: ‘jim’, age: 40 }, { name: ‘bob’, age: 25 }, ] roy jim bob Sunday, 17 February 13
  6. Scales Data Binding binding data to your visualisation people =

    [ { name: ‘roy’, age: 60 }, { name: ‘jon’, age: 40 }, { name: ‘bob’, age: 25 }, { name: ‘son’, age: 16 }, ] roy jon bob son Sunday, 17 February 13
  7. Scales Data Binding enter(): new data being added data =

    [ {x: 10, y: 10}, {x: 20, y: 20} ] points = svg.selectAll(‘circle’) .data(data) points.enter().append(‘circle’) .attr(‘cx’, function(p) { return p.x }) .attr(‘cy’, function(p) { return p.y }) .attr(‘r’, 10) Sunday, 17 February 13
  8. Scales Data Binding enter(): new data being added data =

    [ {x: 10, y: 10}, {x: 20, y: 20} ] data.push({x: 30, y: 30}) points = svg.selectAll(‘circle’) .data(data) points.enter().append(‘circle’) .attr(‘cx’, function(p) { return p.x }) .attr(‘cy’, function(p) { return p.y }) .attr(‘r’, 10) Sunday, 17 February 13
  9. Scales Data Binding data being changed data = [ {x:

    10, y: 10}, {x: 20, y: 20}, {x: 30, y: 30} ] data[3].y = 10 points = svg.selectAll(‘circle’) .data(data) points.transition().duration(2000) .attr(‘cy’, function(p) { return p.y }) Sunday, 17 February 13
  10. Scales Data Binding exit(): data being removed data = [

    {x: 10, y: 10}, {x: 20, y: 20}, {x: 30, y: 30} ] data.pop() //removes the last one points = svg.selectAll(‘circle’) .data(data) points.exit().remove() Sunday, 17 February 13
  11. Scales d3.scale.linear() .domain([20, 100]) .range([0, 500]) Utilities scales: converting data

    to pixels I have a list of adult’s ages that I want to draw on my diagram The domain is the extent of their ages, in this case 20 – 100 The range is the extent of the axis on which I want to draw (0 – 500px) <svg> 0px 500px ages = [20, 30, 60, 75, 100] Sunday, 17 February 13
  12. 9% 11% 12% 31% 38% Pie Force Histogram Utilities layouts:

    common visualisations Sunday, 17 February 13
  13. Utilities geo: projections var width = 960, height = 500;

    var projection = d3.geo.orthographic() .scale(245) .clipAngle(90); var path = d3.geo.path() .projection(projection); var svg = d3.select("body").append("svg") .attr("width", width) .attr("height", height); svg.append("path") .datum({type: "Sphere"}) .attr("class", "background") .attr("d", path); svg.append("path") .datum({type: "Sphere"}) .attr("class", "foreground") .attr("d", path); d3.json("/data/world-countries.json", function(error, world) { svg.insert("path", ".graticule") .datum(topojson.object(world, world.objects.land)) .attr("class", "land") .attr("d", path); }); Sunday, 17 February 13