Upgrade to Pro — share decks privately, control downloads, hide ads and more …

Simplifying simulation of single-cell RNA-seq

Luke Zappia
October 31, 2016

Simplifying simulation of single-cell RNA-seq

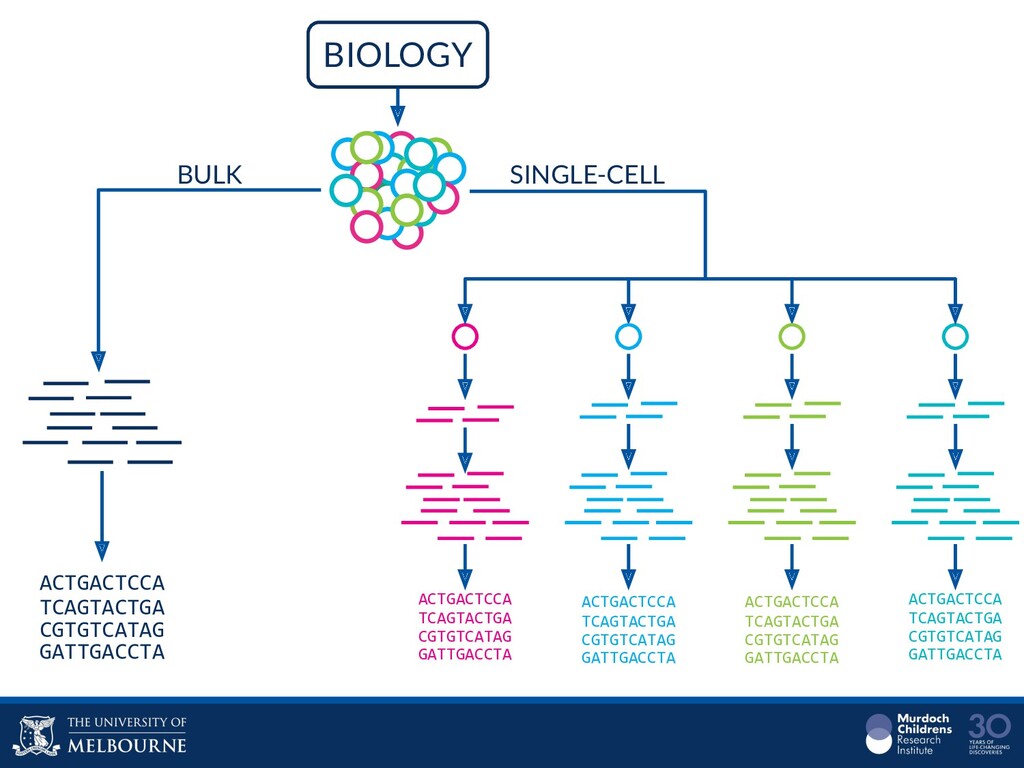
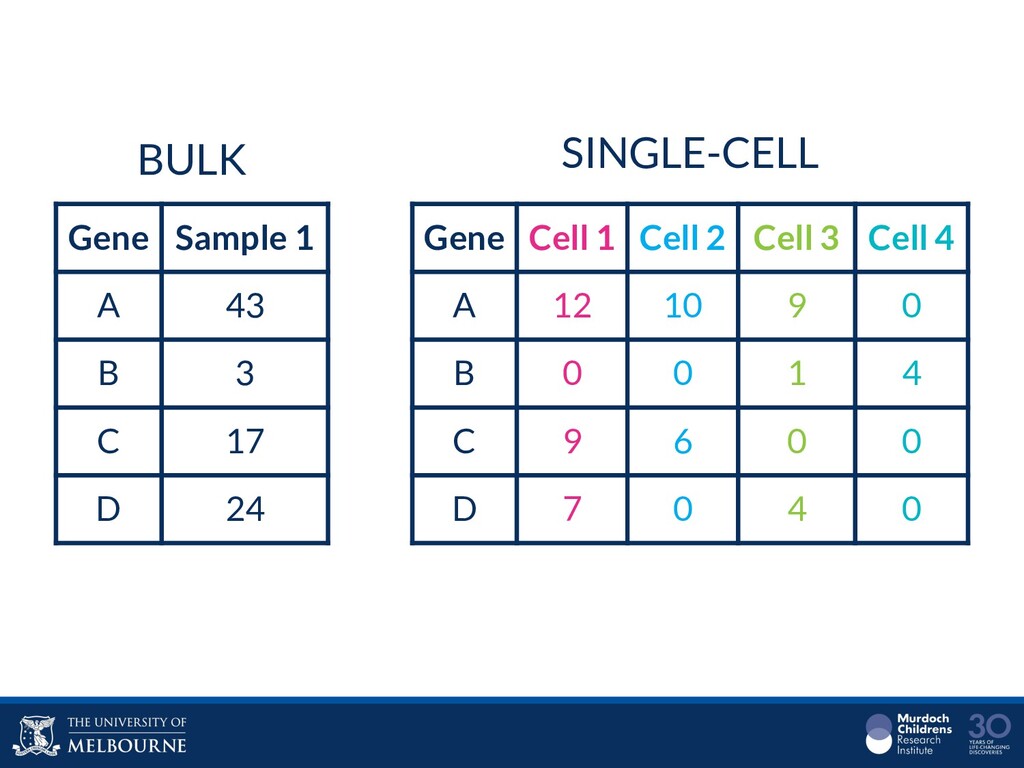
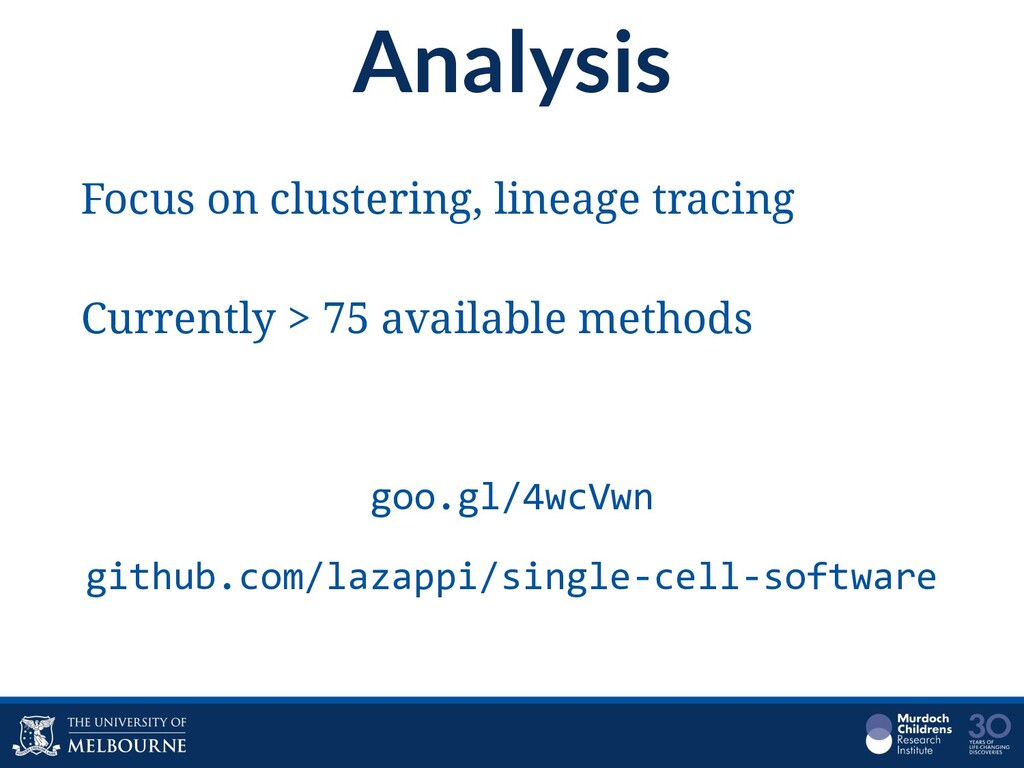
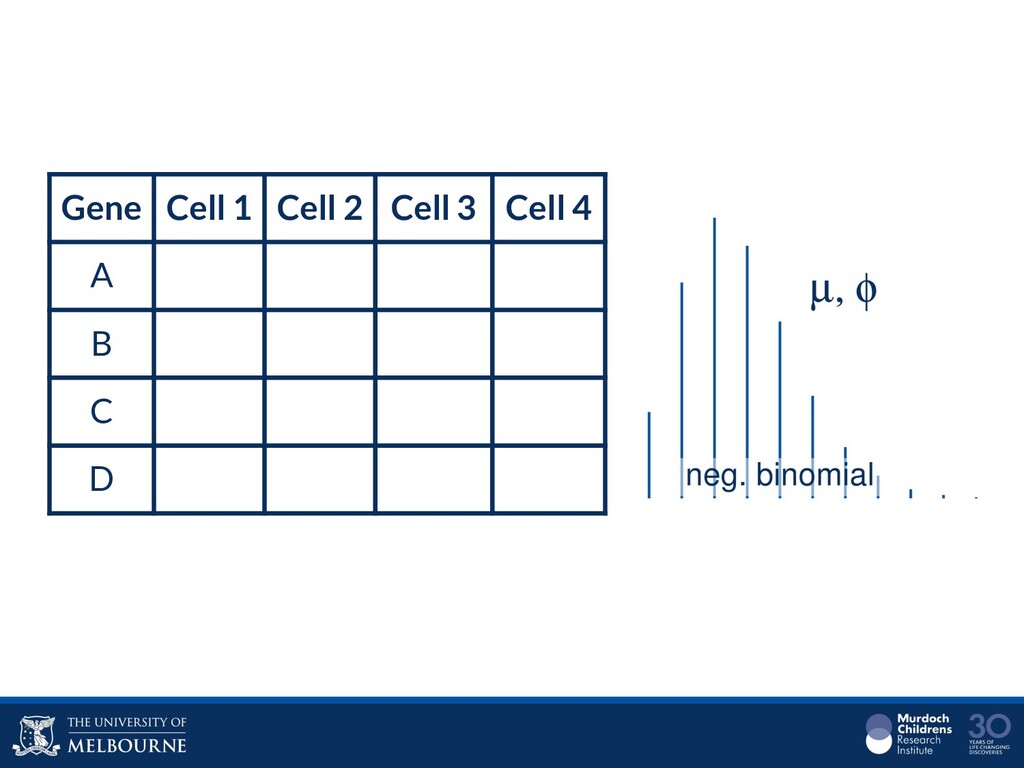
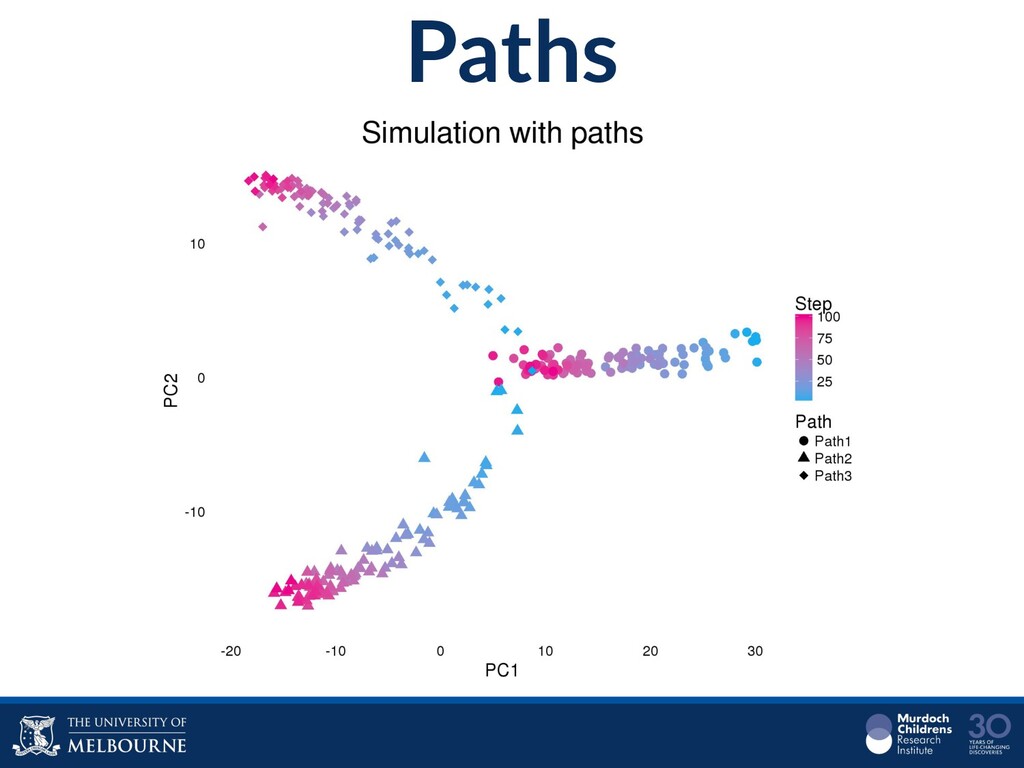
Single-cell RNA sequencing (scRNA-seq) is rapidly becoming a tool of choice for biologists who wish to investigate gene expression, particularly in areas such as development and differentiation. In contrast to traditional bulk RNA-seq experiments, which measure expression averaged across millions of cells, single-cell experiments can be used to observe how genes are expressed in individual cells. Along with the dramatic increase in resolution provided by scRNA-seq comes an array of bioinformatics challenges. Single-cell data is relatively sparse (for both biological and technical reasons), quality control is difficult and it is unclear how to replicate measurements. The focus of analysis is also different, with more emphasis on clustering cells to identify cell types or ordering of cells to understand dynamic processes than traditional tasks such as differential expression testing. Any new bioinformatics method for scRNA-seq analysis should demonstrate two things: 1) it can do what it claims and 2) it helps to produce biological insight. The first is hard to prove on real data where there is often no known truth. Because of this, bioinformaticians turn to simulations. Unfortunately current scRNA-seq simulations are frequently poorly documented, not reproducible and do not demonstrate similarity to real data or experimental designs. Here we discuss some of the problems with simulating scRNA-seq data and provide a simulation framework that addresses these concerns.

Luke Zappia

October 31, 2016
Tweet

More Decks by Luke Zappia

Other Decks in Science

Transcript

  1. Simplifying simulation
    of single-cell RNA-seq
    Luke Zappia
    @_lazappi_

    View Slide

  2. What is
    single-cell?
    Matthew Daniels via The Cell Image Library
    http://www.cellimagelibrary.org/images/38912

    View Slide

  3. ACTGACTCCA
    TCAGTACTGA
    CGTGTCATAG
    GATTGACCTA
    ACTGACTCCA
    TCAGTACTGA
    CGTGTCATAG
    GATTGACCTA
    ACTGACTCCA
    TCAGTACTGA
    CGTGTCATAG
    GATTGACCTA
    ACTGACTCCA
    TCAGTACTGA
    CGTGTCATAG
    GATTGACCTA
    ACTGACTCCA
    TCAGTACTGA
    CGTGTCATAG
    GATTGACCTA
    BULK SINGLE-CELL
    BIOLOGY

    View Slide

  4. Gene Sample 1
    A 43
    B 3
    C 17
    D 24
    BULK SINGLE-CELL
    Gene Cell 1 Cell 2 Cell 3 Cell 4
    A 12 10 9 0
    B 0 0 1 4
    C 9 6 0 0
    D 7 0 4 0

    View Slide

  5. Analysis
    Focus on clustering, lineage tracing
    Currently > 75 available methods
    goo.gl/4wcVwn
    github.com/lazappi/single-cell-software

    View Slide

  6. A new analysis method should...
    1. Show that it can do what it claims
    2. Show that it produces insight

    View Slide

  7. http://www.cellimagelibrary.org/images/40483
    M Uhlen et al. via The Cell Image Library
    Simulations

    View Slide

  8. Gene Cell 1 Cell 2 Cell 3 Cell 4
    A
    B
    C
    D

    View Slide

  9. Simulations
    Provide a known truth
    Allow us to test…
    ● Effectiveness
    ● Assumptions
    ● Relative performance

    View Slide

  10. Current simulations
    Often poorly documented and explained
    Not easily reproducible or reusable
    Don’t demonstrate similarity to real data

    View Slide

  11. View Slide

  12. Splatter
    R package
    Collection of simulation methods
    Consistent, easy to use, interface
    Functions for comparison
    github.com/Oshlack/splatter

    View Slide

  13. The Splat simulation
    Negative binomial
    Expression outliers
    Defined library sizes
    Mean-variance trend
    Dropout

    View Slide

  14. Other simulations
    Simple - Negative binomial
    Lun - NB with cell factors
    Lun ATL, Bach K, Marioni JC. Genome Biology (2016). DOI: 10.1186/s13059-016-0947-7.
    Lun 2 - Sampled NB with batch effects
    Lun ATL, Marioni JC. bioRxiv (2016). DOI: 10.1101/073973.
    scDD - NB with bimodality
    Korthauer KD, et al. bioRxiv (2015). DOI: 10.1101/035501.

    View Slide

  15. Using Splatter
    params1 <- splatEstimate(real.data)
    sim1 <- splatSimulate(params1, ...)
    params2 <- simpleEstimate(real.data)
    sim2 <- simpleSimulate(params2, ...)
    datasets <- list(Real = real.data,
    Splat = sim1,
    Simple = sim2)
    comp <- compareSCESets(datasets)

    View Slide

  16. The
    data
    http://www.cellimagelibrary.org/images/41467
    Jan Schmoranzer via The Cell Image Library

    View Slide

  17. Subset of data from study looking at
    design and batch effects by Tung et al.
    Tung P-Y, et al. bioRxiv (2016). DOI: 10.1101/062919.
    Single HapMap stem cell line
    - 3 batches
    - 221 cells, 13 058 genes
    Real data

    View Slide

  18. Means

    View Slide

  19. Variance

    View Slide

  20. Mean-variance

    View Slide

  21. Library size

    View Slide

  22. Zeros

    View Slide

  23. What
    else?
    http://www.cellimagelibrary.org/images/44701
    Andres J Garcia and Ankur Singh via The Cell Image Library

    View Slide

  24. Groups

    View Slide

  25. Paths

    View Slide

  26. Summary
    Single-cell RNA-seq is an exciting new technology
    - Lots of analysis methods
    Simulations can be used to evaluate methods
    - But often hard to reuse
    Splatter
    - R package for simulation and comparison
    Splat
    - Simulation method for groups or paths

    View Slide

  27. Acknowledgements
    Alicia Oshlack
    Melissa Little
    Belinda Phipson
    MCRI Bioinformatics
    oshalacklab.com

    View Slide

  28. github.com/Oshlack/splatter
    github.com/lazappi/single-cell-software
    @_lazappi_
    oshalacklab.com

    View Slide

  29. Solution?
    http://www.cellimagelibrary.org/images/38804
    Wellcome Images via The Cell Image Library

    View Slide

  30. Library size

    View Slide

  31. Means

    View Slide

  32. Negative binomial

    View Slide