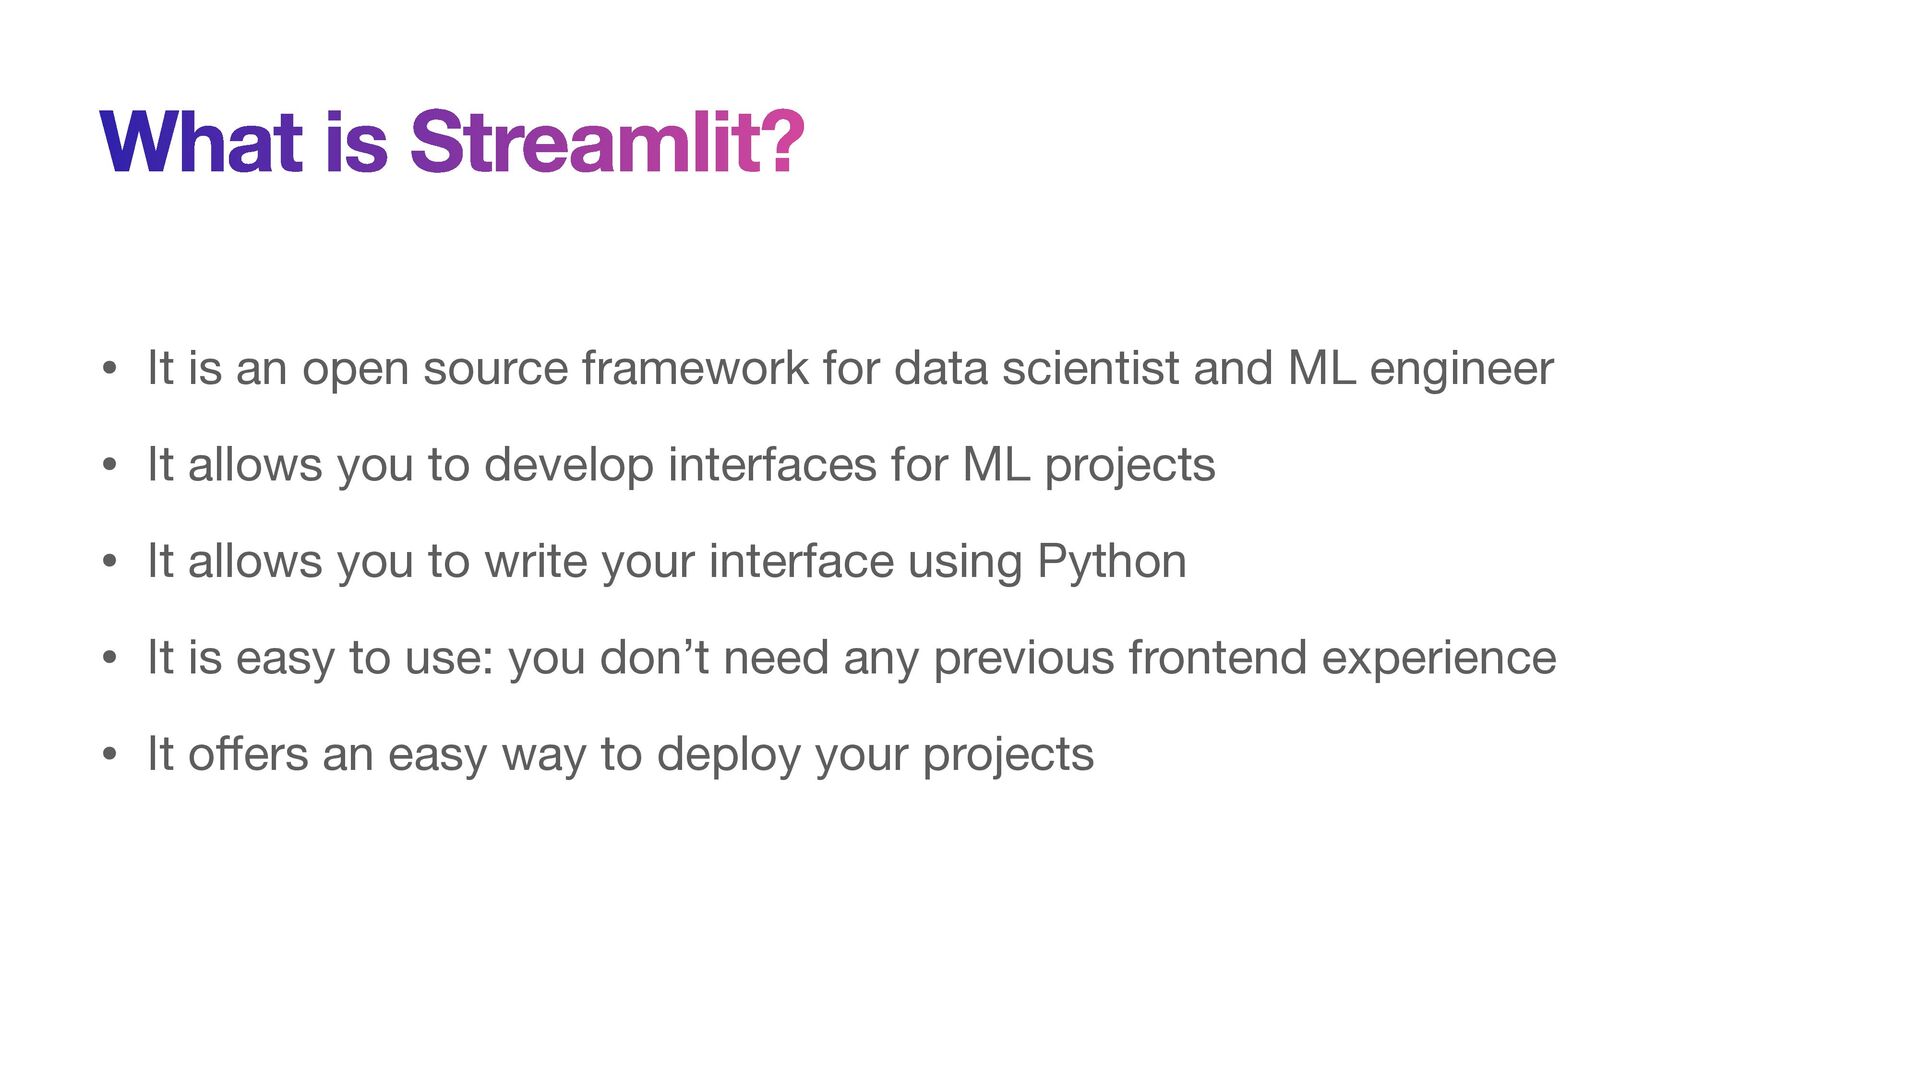
for data scientist and ML engineer • It allows you to develop interfaces for ML projects • It allows you to write your interface using Python • It is easy to use: you don’t need any previous frontend experience • It o ff ers an easy way to deploy your projects
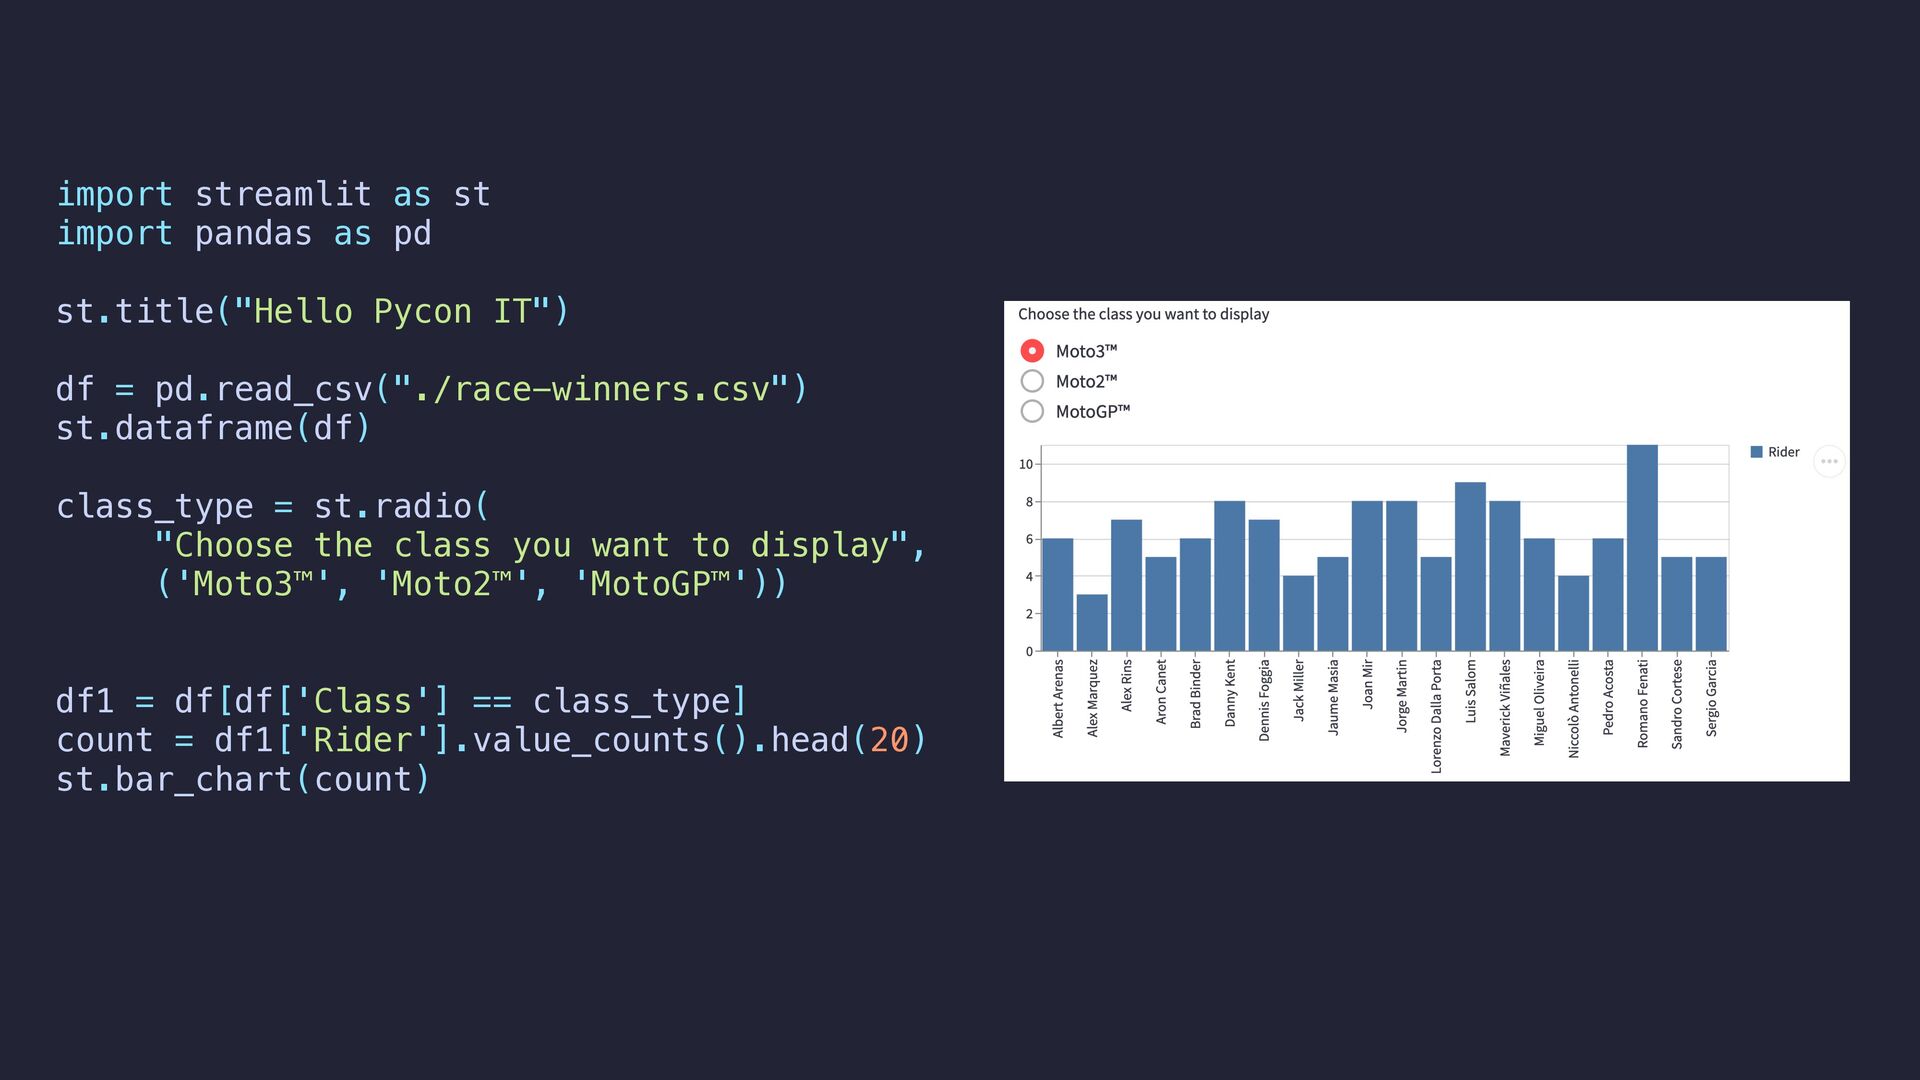
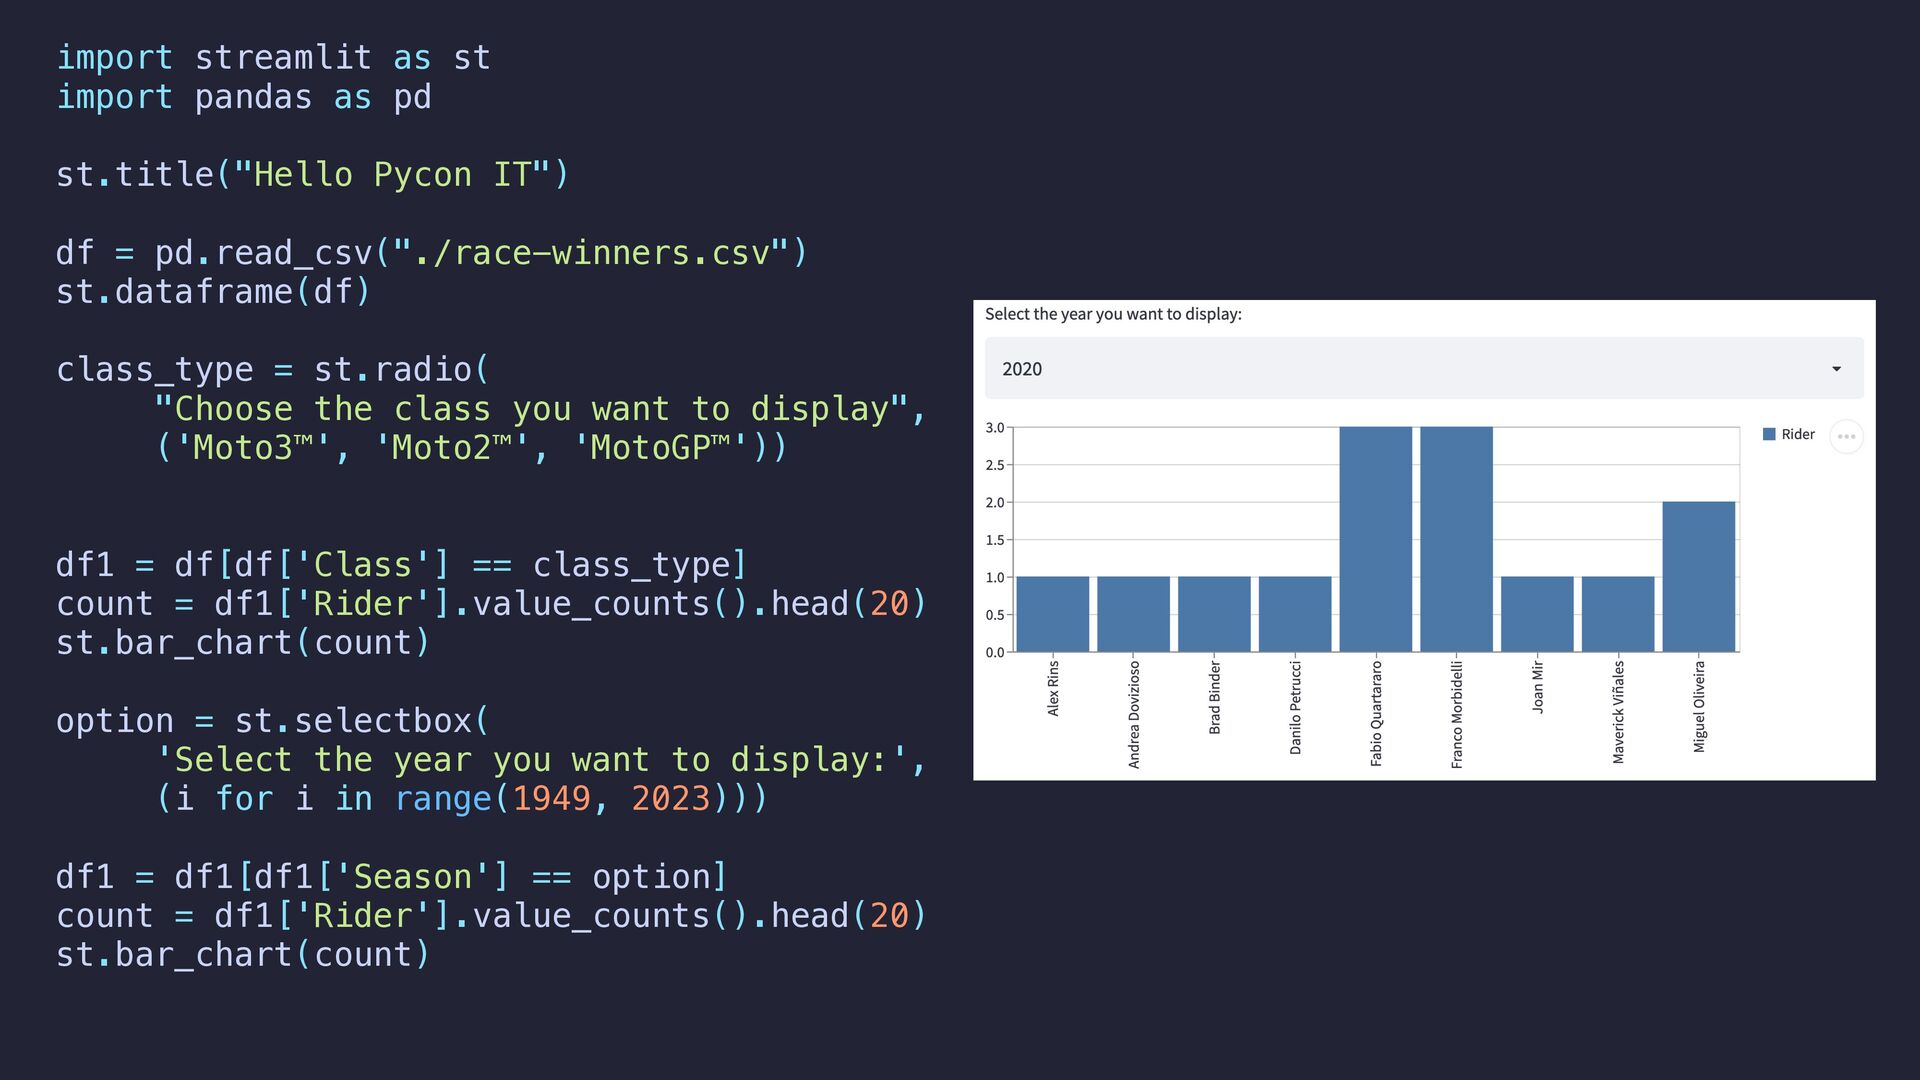
IT") df = pd.read_csv("./race-winners.csv") st.dataframe(df) class_type = st.radio( "Choose the class you want to display", ('Moto3™', 'Moto2™', 'MotoGP™')) df1 = df[df['Class'] == class_type] count = df1['Rider'].value_counts().head(20) st.bar_chart(count) option = st.selectbox( 'Select the year you want to display:', (i for i in range(1949, 2023))) df1 = df1[df1['Season'] == option] count = df1['Rider'].value_counts().head(20) st.bar_chart(count)
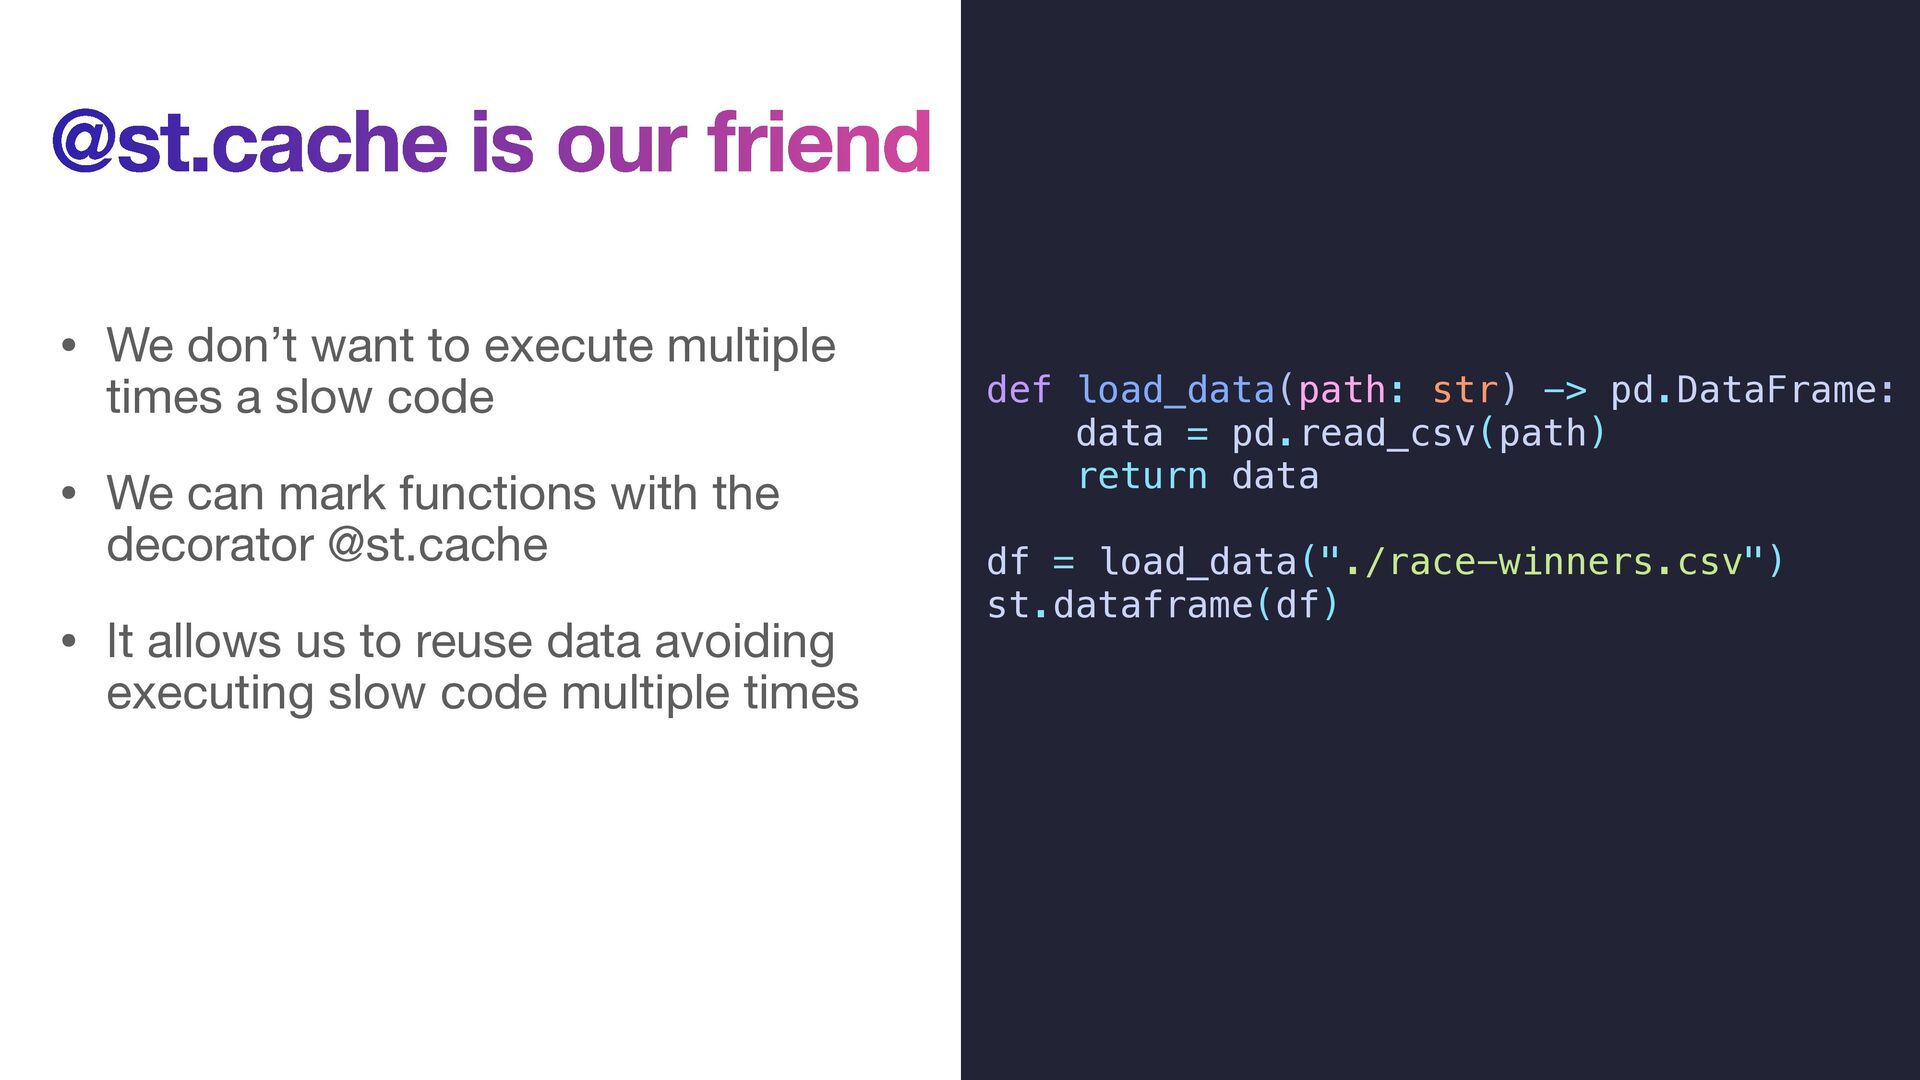
multiple times a slow code • We can mark functions with the decorator @st.cache • It allows us to reuse data avoiding executing slow code multiple times def load_data(path: str) -> pd.DataFrame: data = pd.read_csv(path) return data df = load_data("./race-winners.csv") st.dataframe(df)
multiple times a slow code • We can mark functions with the decorator @st.cache • It allows us to reuse data avoiding executing slow code multiple times @st.cache def load_data(path: str) -> pd.DataFrame: data = pd.read_csv(path) return data df = load_data("./race-winners.csv") st.dataframe(df)
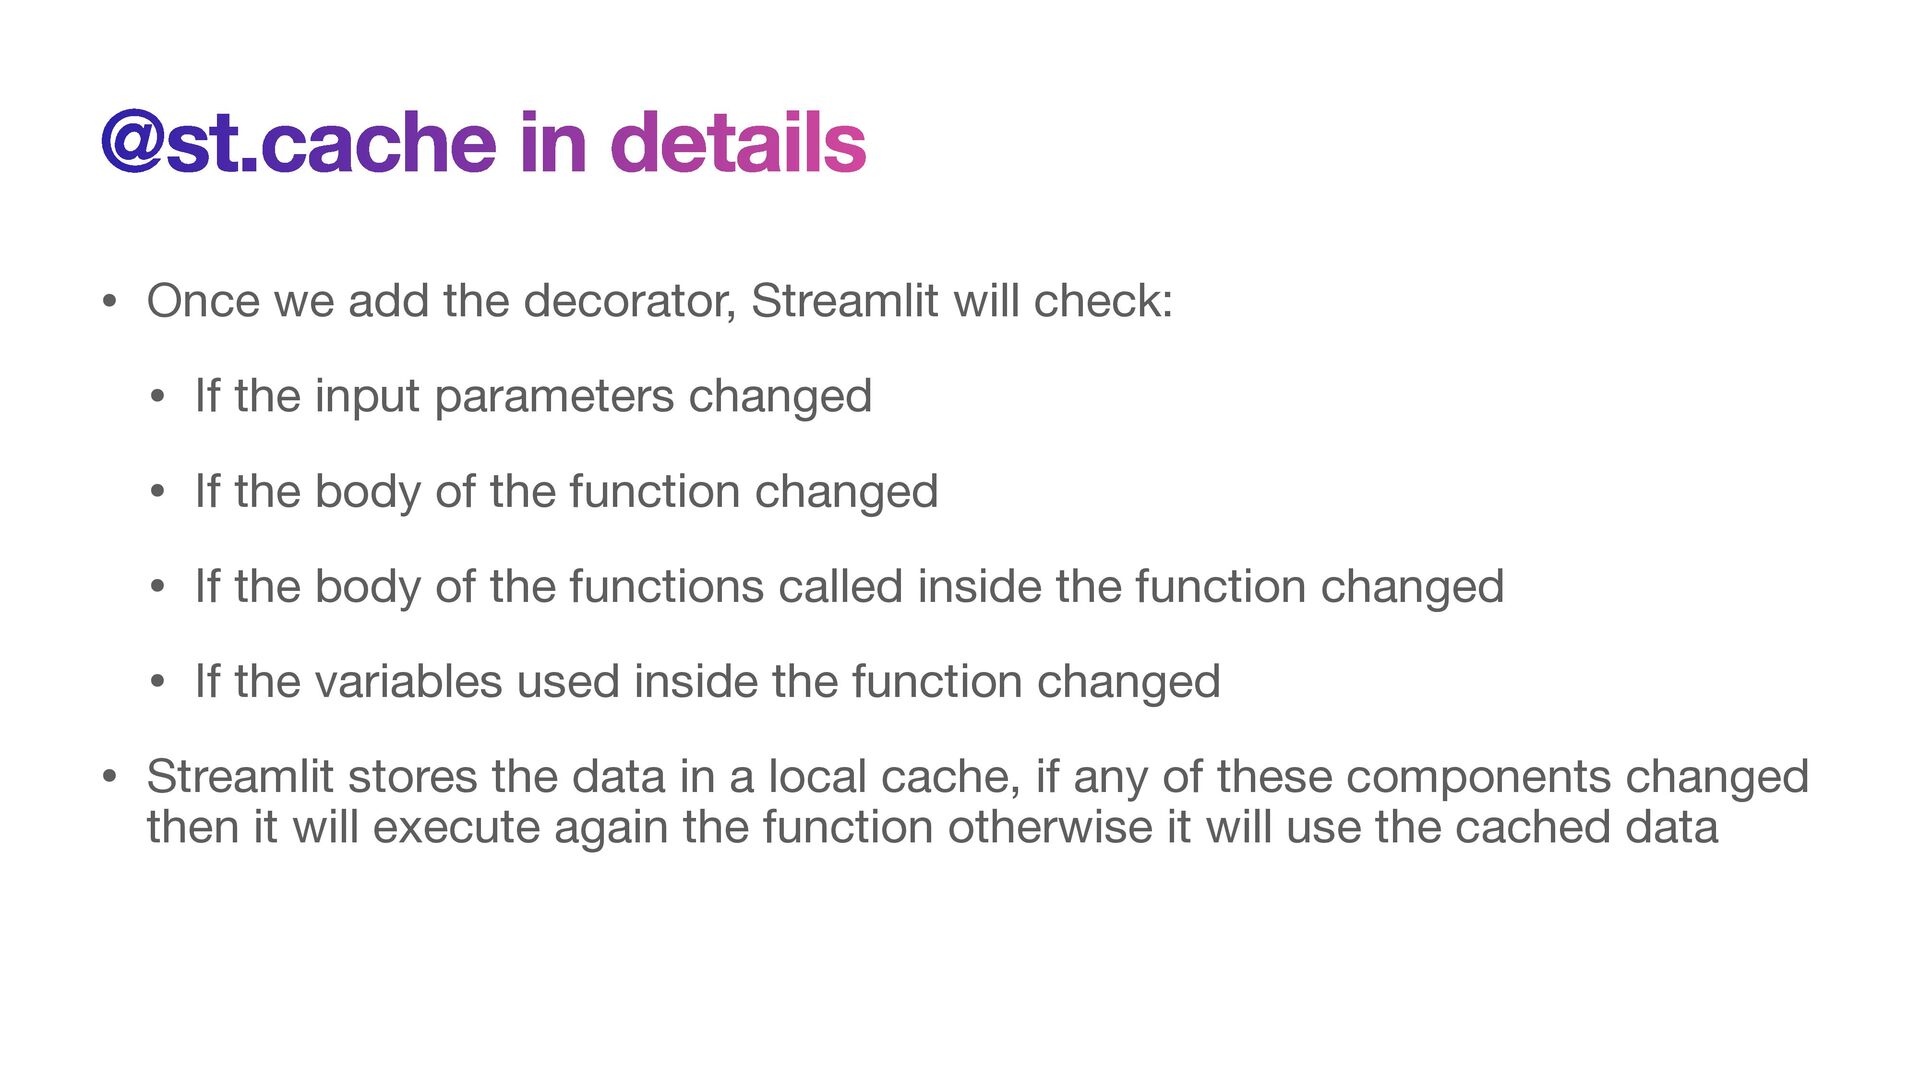
will check: • If the input parameters changed • If the body of the function changed • If the body of the functions called inside the function changed • If the variables used inside the function changed • Streamlit stores the data in a local cache, if any of these components changed then it will execute again the function otherwise it will use the cached data
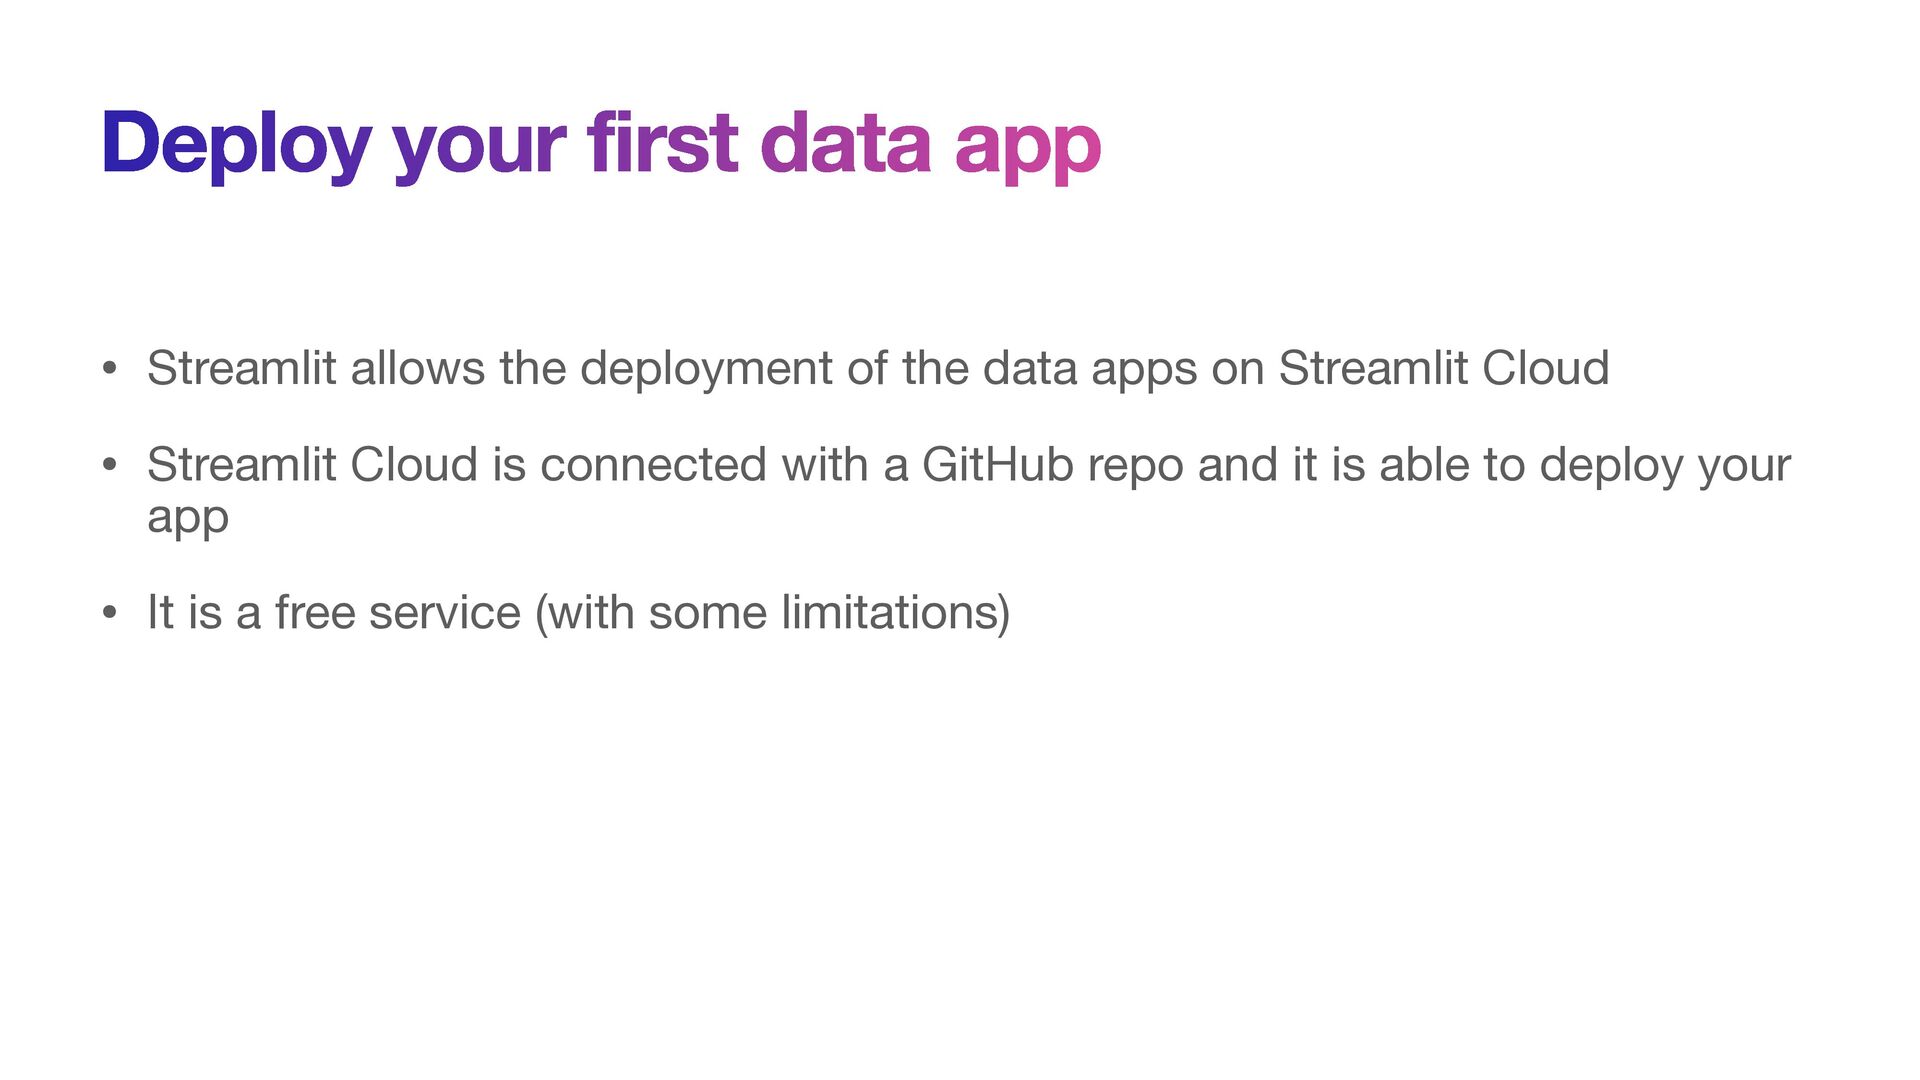
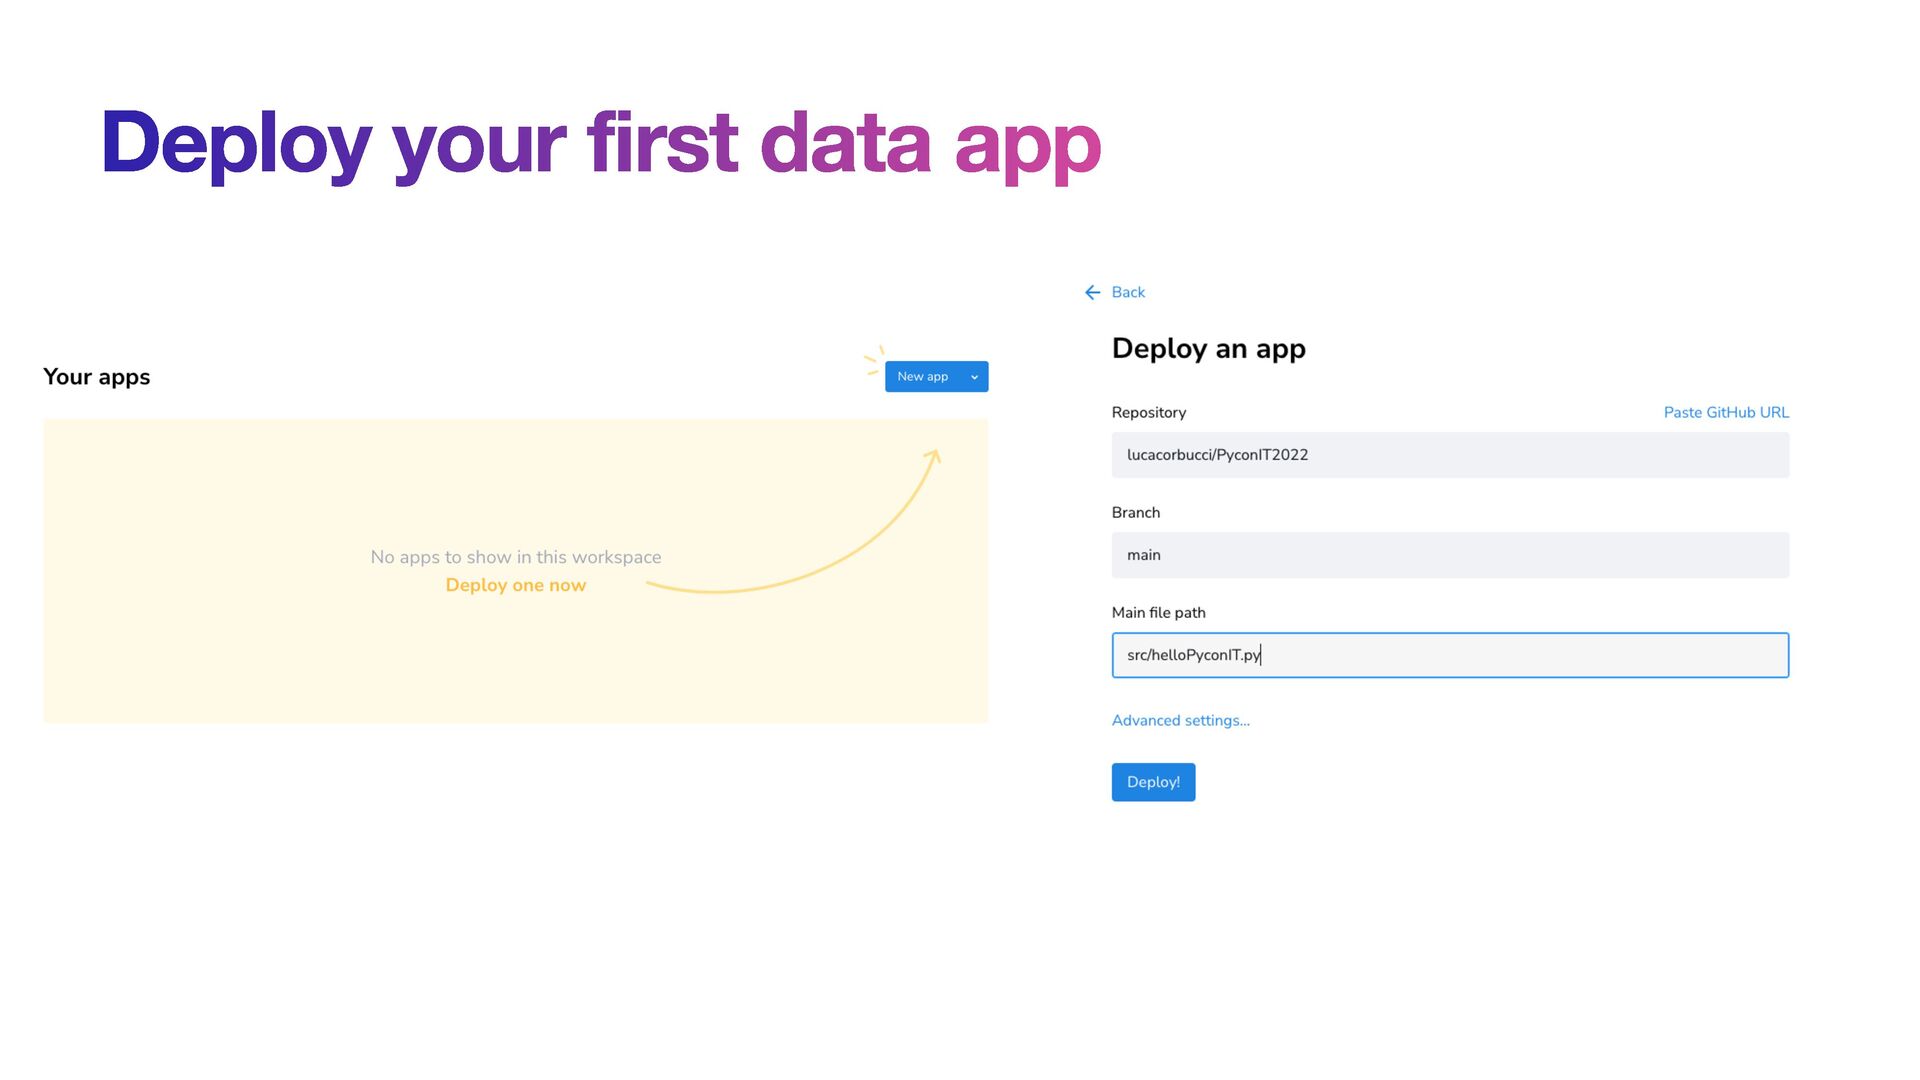
of the data apps on Streamlit Cloud • Streamlit Cloud is connected with a GitHub repo and it is able to deploy your app • It is a free service (with some limitations)
![Thank you @lucacorbucci 🌏 lucacorbucci.me 👨💻 github.com/lucacorbucci/ 📥 [email protected]](https://files.speakerdeck.com/presentations/4d2f8006b89a442caad7803a2799ca62/slide_23.jpg)