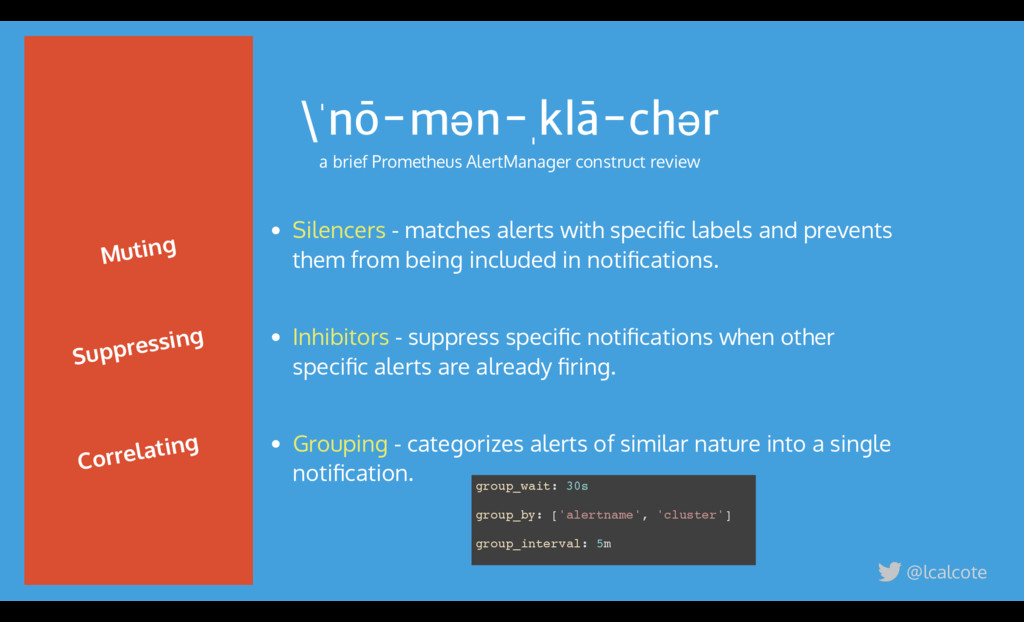
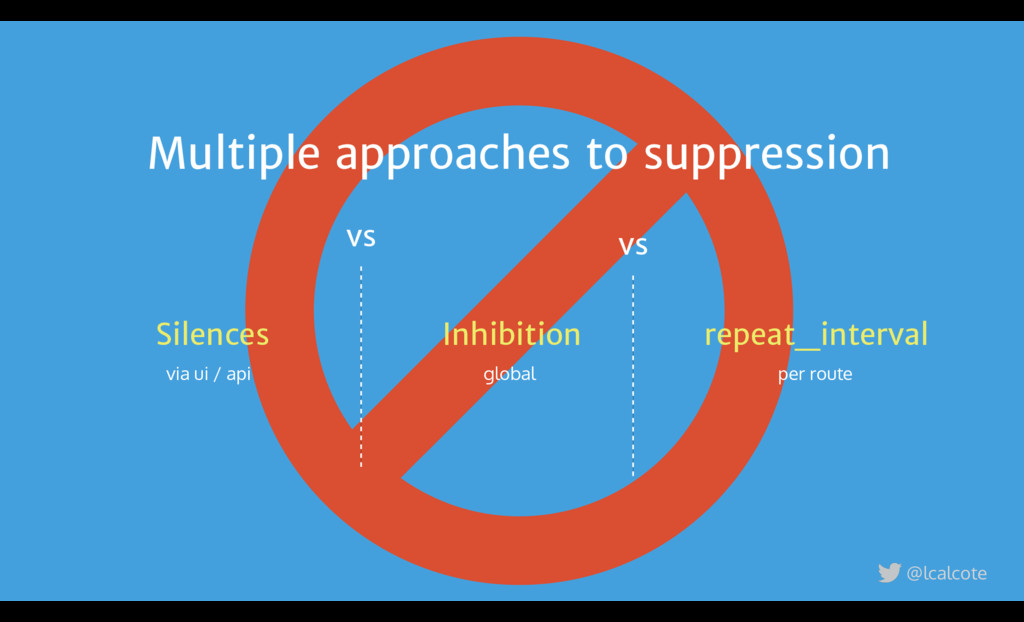
being included in notifications. - suppress specific notifications when other specific alerts are already firing. - categorizes alerts of similar nature into a single notification. Silencers Inhibitors Grouping \ˈnō-mən-ˌklā-chər a brief Prometheus AlertManager construct review Muting Suppressing Correlating group_wait: 30s group_by: ['alertname', 'cluster'] group_interval: 5m @lcalcote
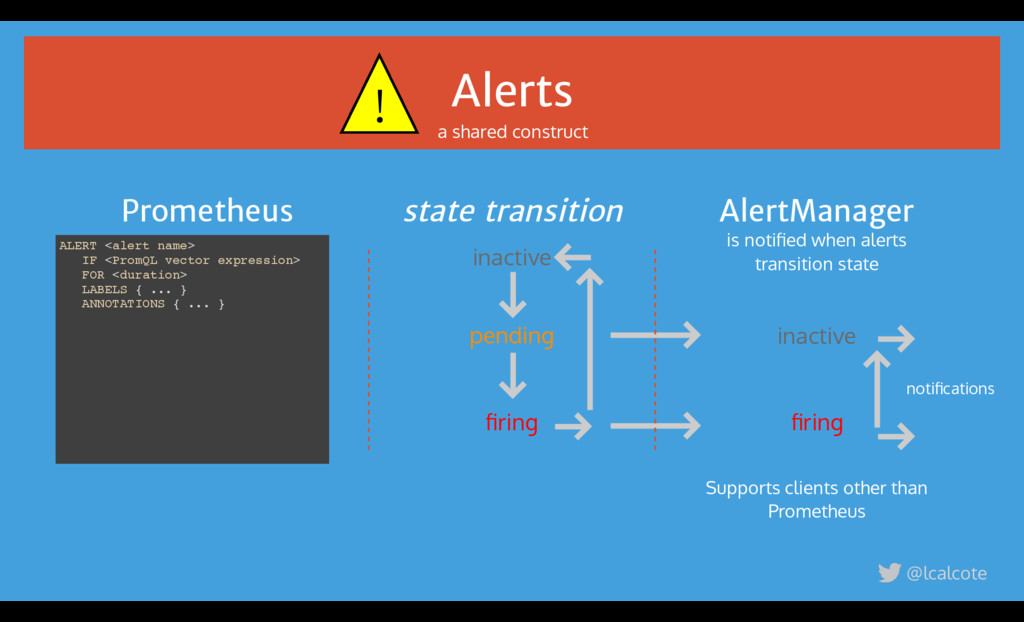
LABELS { ... } ANNOTATIONS { ... } Supports clients other than Prometheus is notified when alerts transition state @lcalcote a shared construct Prometheus AlertManager inactive firing pending state transition inactive firing notifications !
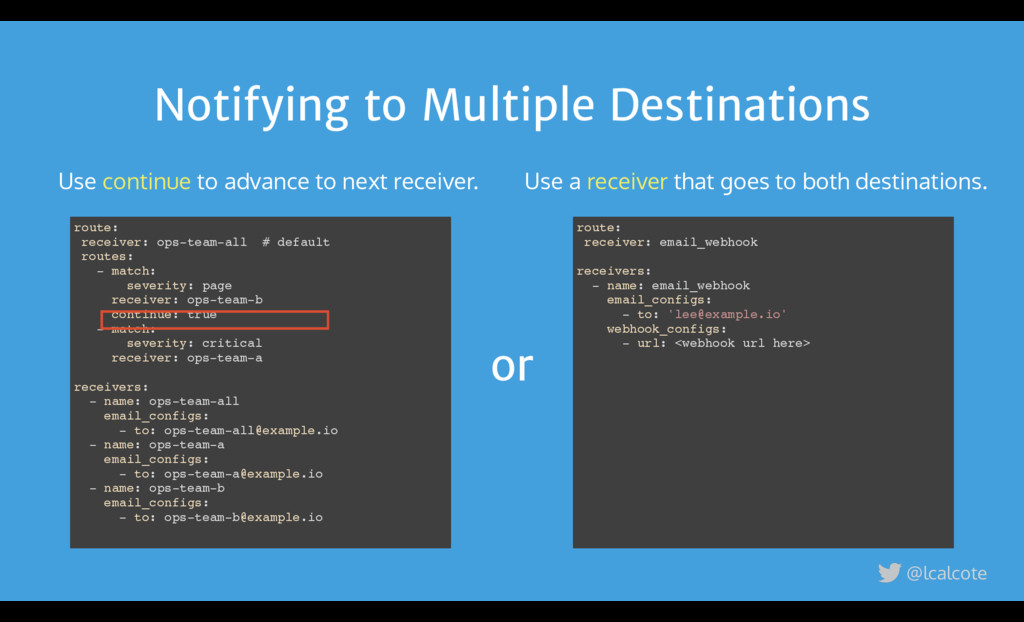
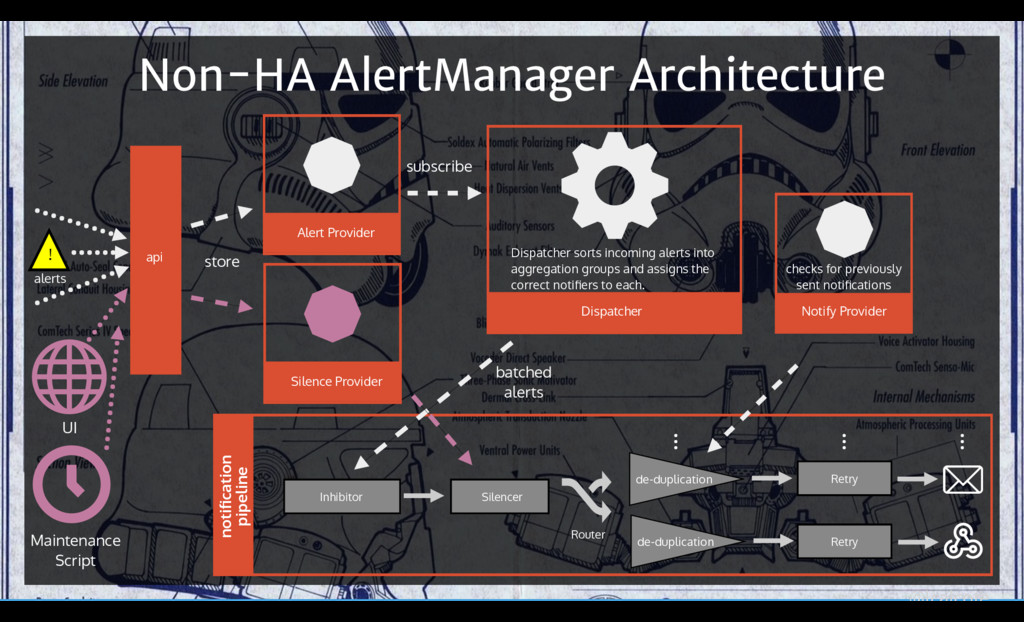
alerts into aggregation groups and assigns the correct notifiers to each. api Alert Provider UI Silence Provider store de-duplication subscribe Router batched alerts notification pipeline Notify Provider checks for previously sent notifications Retry Retry Maintenance Script ! @lcalcote alerts
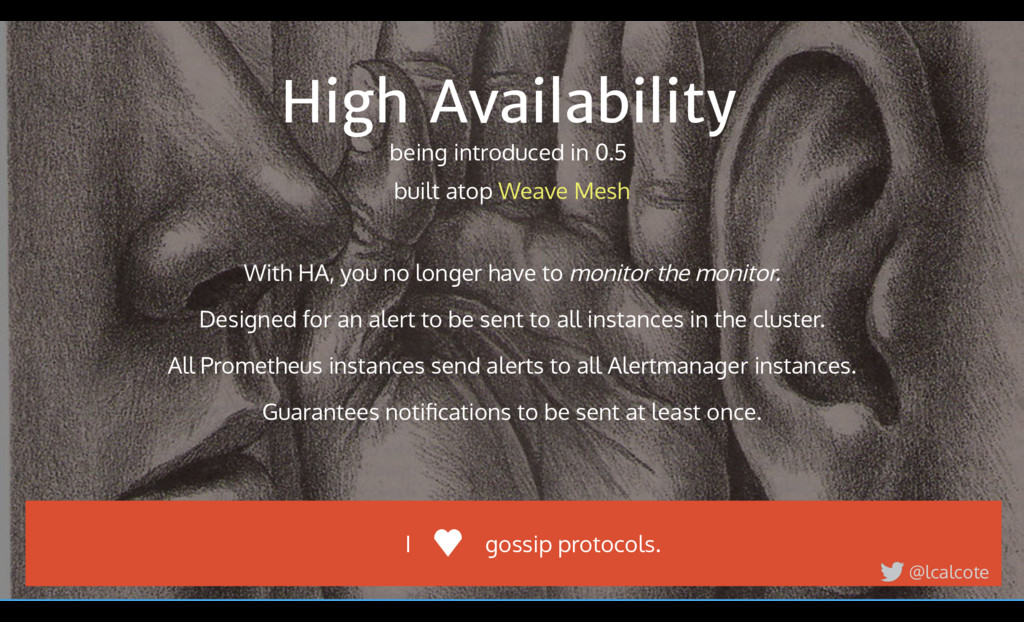
built atop Weave Mesh With HA, you no longer have to monitor the monitor. Designed for an alert to be sent to all instances in the cluster. All Prometheus instances send alerts to all Alertmanager instances. Guarantees notifications to be sent at least once. @lcalcote
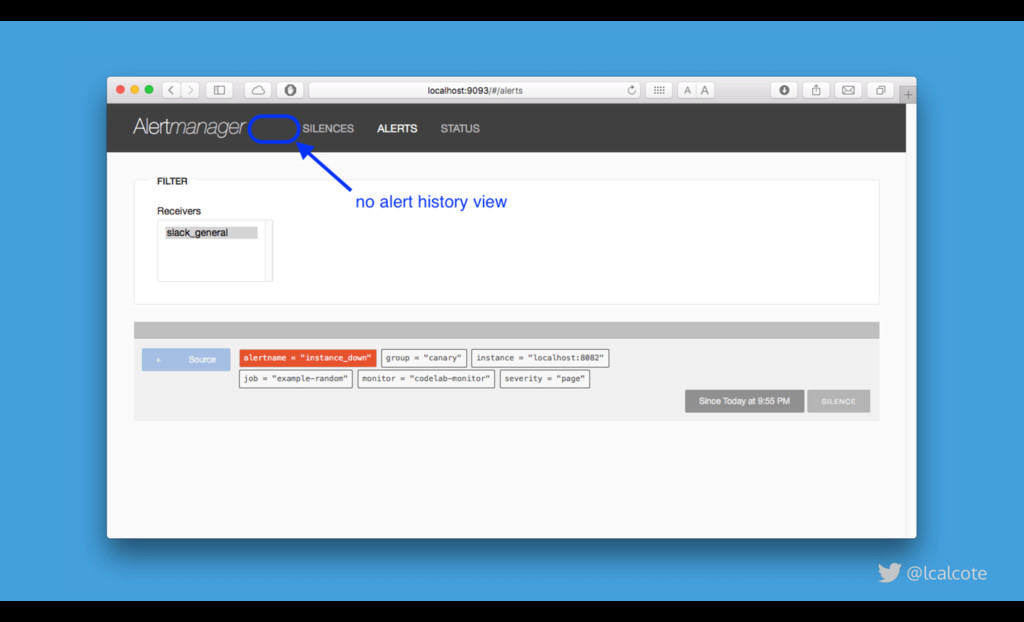
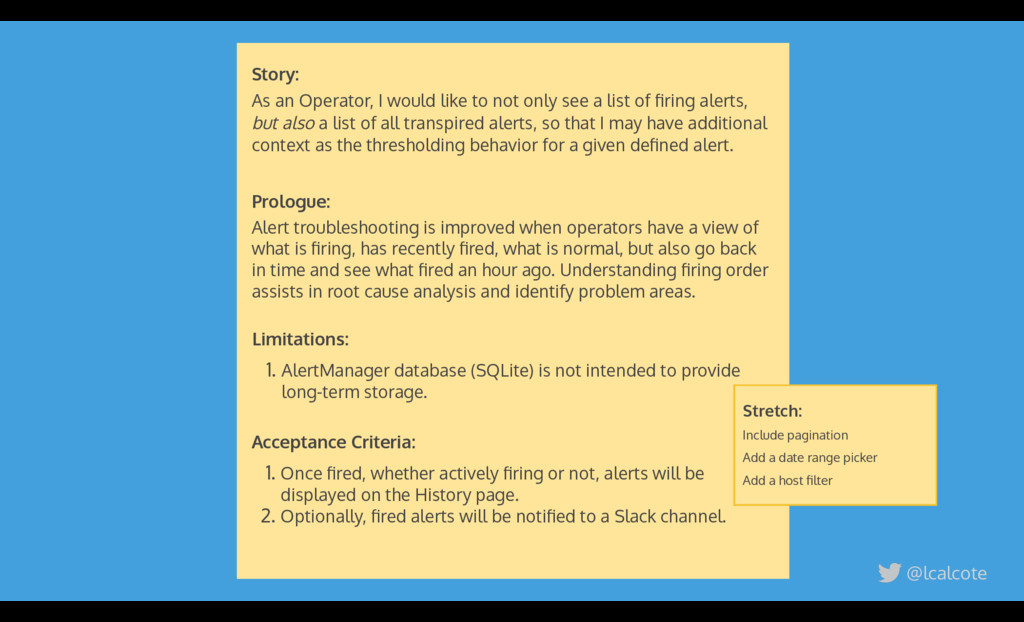
see a list of firing alerts, but also a list of all transpired alerts, so that I may have additional context as the thresholding behavior for a given defined alert. @lcalcote Prologue: Alert troubleshooting is improved when operators have a view of what is firing, has recently fired, what is normal, but also go back in time and see what fired an hour ago. Understanding firing order assists in root cause analysis and identify problem areas. Limitations: 1. AlertManager database (SQLite) is not intended to provide long-term storage. Acceptance Criteria: 1. Once fired, whether actively firing or not, alerts will be displayed on the History page. 2. Optionally, fired alerts will be notified to a Slack channel. Stretch: Include pagination Add a date range picker Add a host filter
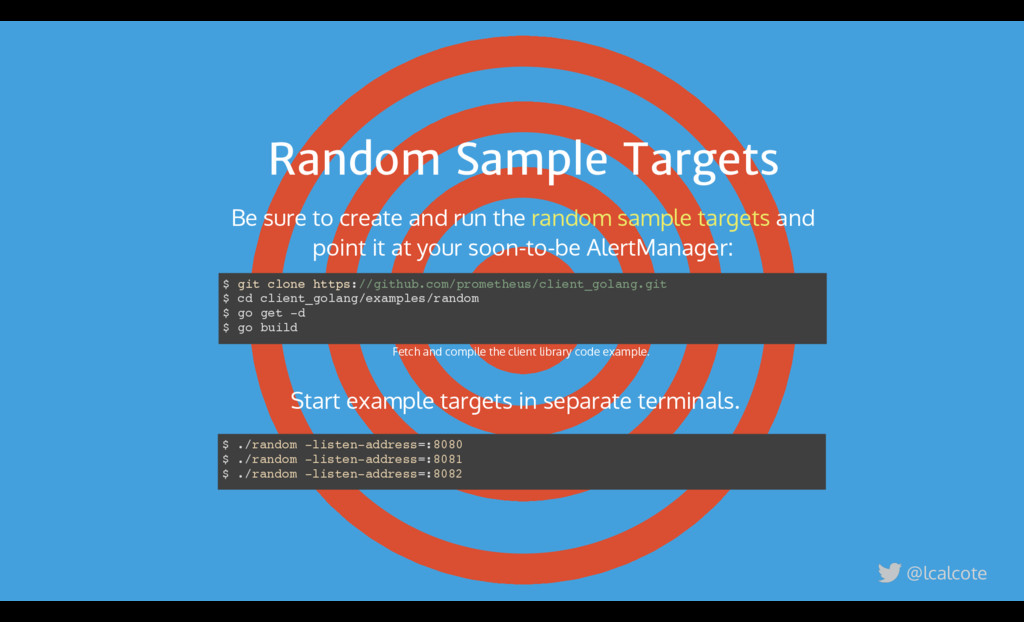
$ go get -d $ go build Fetch and compile the client library code example. Start example targets in separate terminals. $ ./random -listen-address=:8080 $ ./random -listen-address=:8081 $ ./random -listen-address=:8082 Be sure to create and run the and point it at your soon-to-be AlertManager: random sample targets @lcalcote
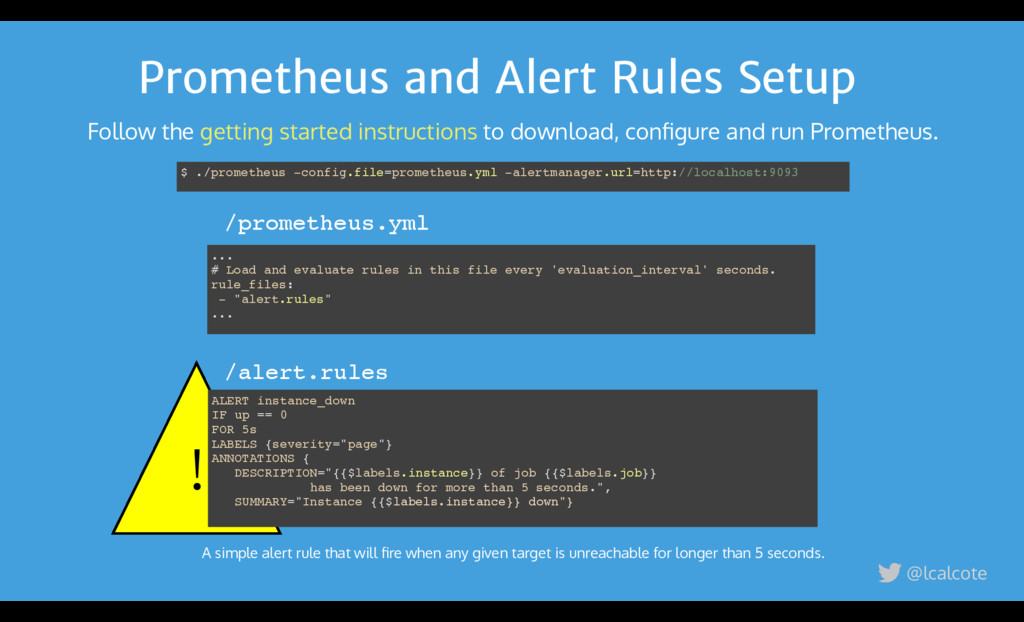
and run Prometheus. getting started instructions $ ./prometheus -config.file=prometheus.yml -alertmanager.url=http://localhost:9093 ALERT instance_down IF up == 0 FOR 5s LABELS {severity="page"} ANNOTATIONS { DESCRIPTION="{{$labels.instance}} of job {{$labels.job}} has been down for more than 5 seconds.", SUMMARY="Instance {{$labels.instance}} down"} /alert.rules A simple alert rule that will fire when any given target is unreachable for longer than 5 seconds. @lcalcote ! ... # Load and evaluate rules in this file every 'evaluation_interval' seconds. rule_files: - "alert.rules" ... /prometheus.yml
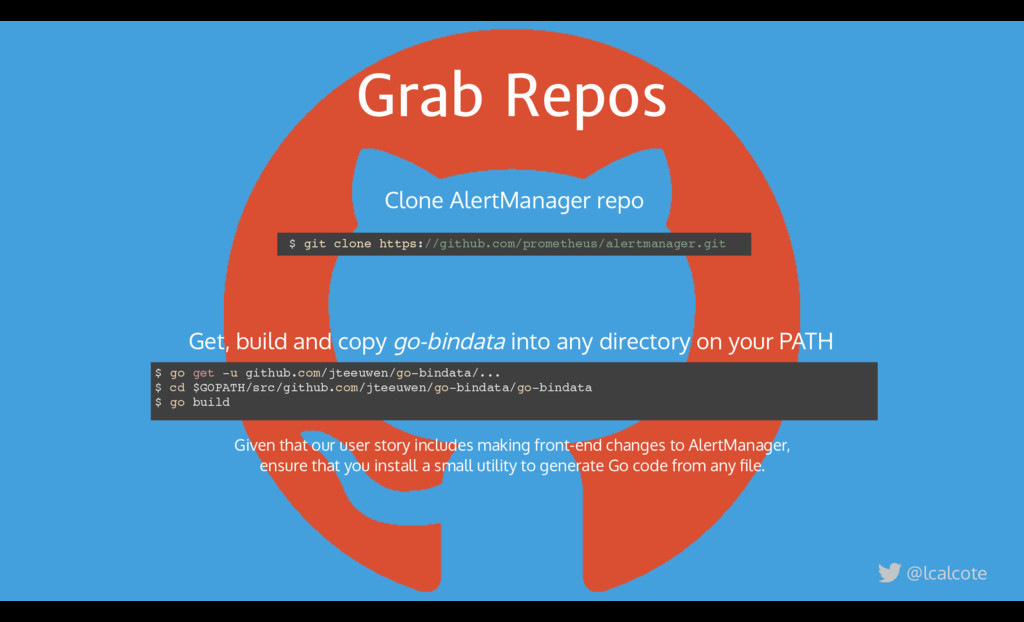
user story includes making front-end changes to AlertManager, ensure that you install a small utility to generate Go code from any file. Clone AlertManager repo Get, build and copy go-bindata into any directory on your PATH $ go get -u github.com/jteeuwen/go-bindata/... $ cd $GOPATH/src/github.com/jteeuwen/go-bindata/go-bindata $ go build
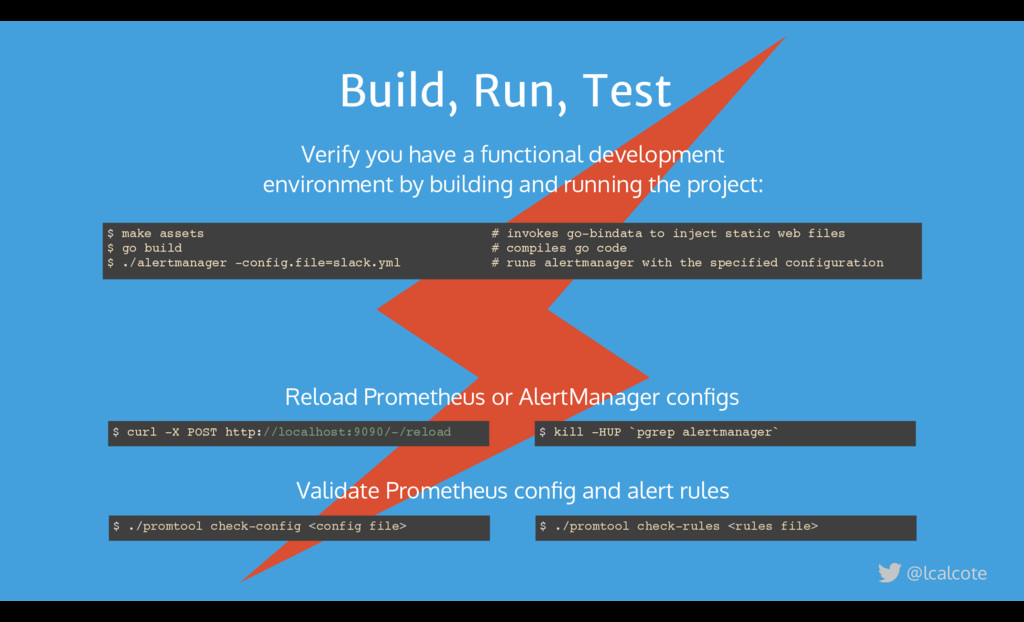
by building and running the project: $ make assets # invokes go-bindata to inject static web files $ go build # compiles go code $ ./alertmanager -config.file=slack.yml # runs alertmanager with the specified configuration @lcalcote $ curl -X POST http://localhost:9090/-/reload $ kill -HUP `pgrep alertmanager` $ ./promtool check-config <config file> $ ./promtool check-rules <rules file> Reload Prometheus or AlertManager configs Validate Prometheus config and alert rules
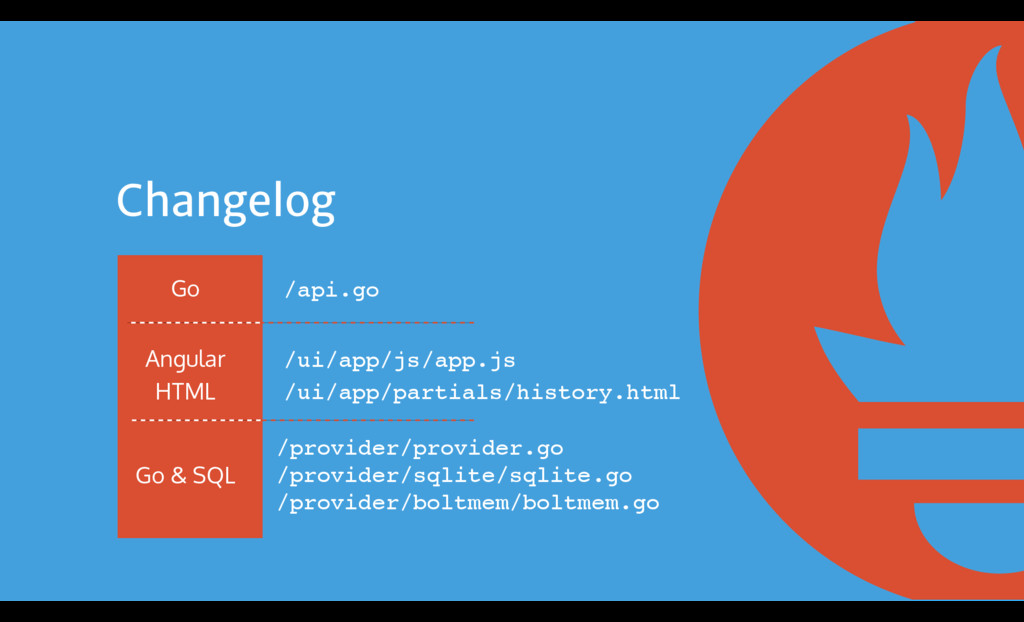
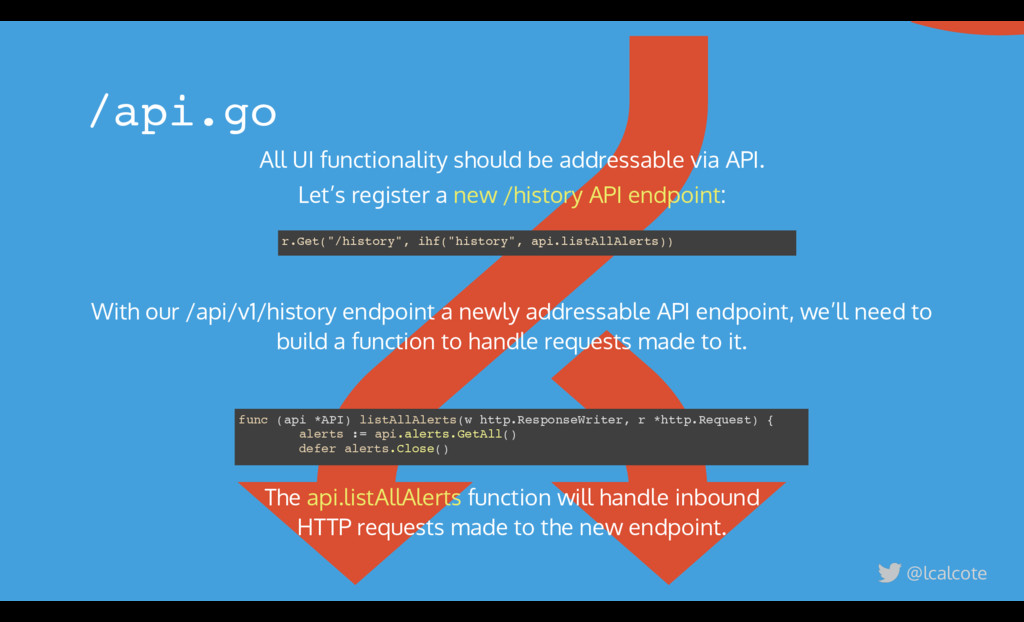
register a : /api.go new /history API endpoint r.Get("/history", ihf("history", api.listAllAlerts)) func (api *API) listAllAlerts(w http.ResponseWriter, r *http.Request) { alerts := api.alerts.GetAll() defer alerts.Close() With our /api/v1/history endpoint a newly addressable API endpoint, we’ll need to build a function to handle requests made to it. The function will handle inbound HTTP requests made to the new endpoint. api.listAllAlerts
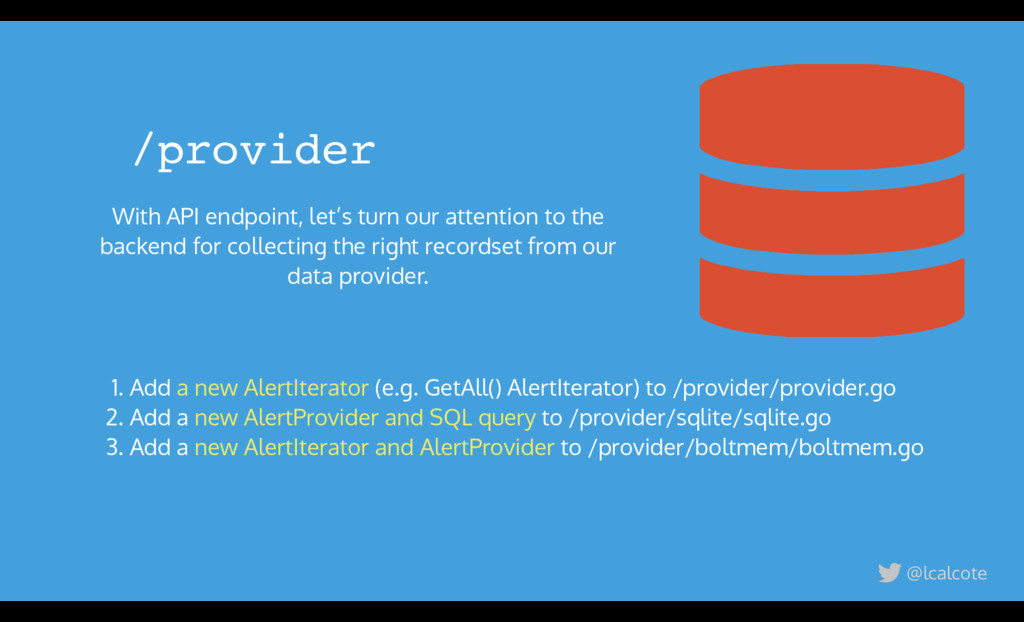
a to /provider/sqlite/sqlite.go 3. Add a to /provider/boltmem/boltmem.go a new AlertIterator new AlertProvider and SQL query new AlertIterator and AlertProvider With API endpoint, let’s turn our attention to the backend for collecting the right recordset from our data provider. /provider
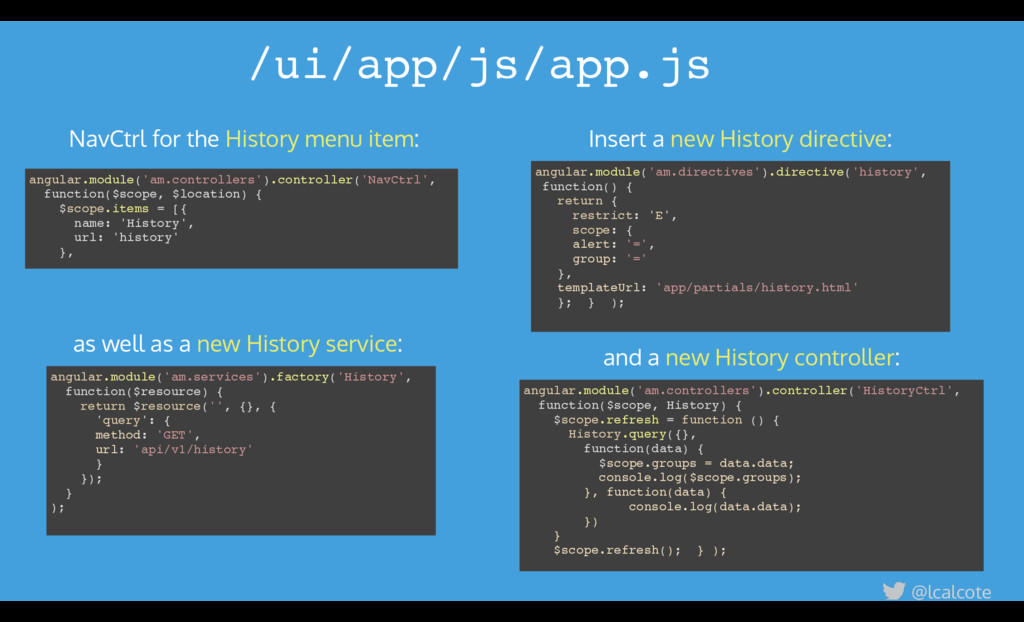
'History', url: 'history' }, angular.module('am.services').factory('History', function($resource) { return $resource('', {}, { 'query': { method: 'GET', url: 'api/v1/history' } }); } ); NavCtrl for the : History menu item as well as a : new History service angular.module('am.controllers').controller('HistoryCtrl', function($scope, History) { $scope.refresh = function () { History.query({}, function(data) { $scope.groups = data.data; console.log($scope.groups); }, function(data) { console.log(data.data); }) } $scope.refresh(); } ); and a : new History controller angular.module('am.directives').directive('history', function() { return { restrict: 'E', scope: { alert: '=', group: '=' }, templateUrl: 'app/partials/history.html' }; } ); Insert a : new History directive
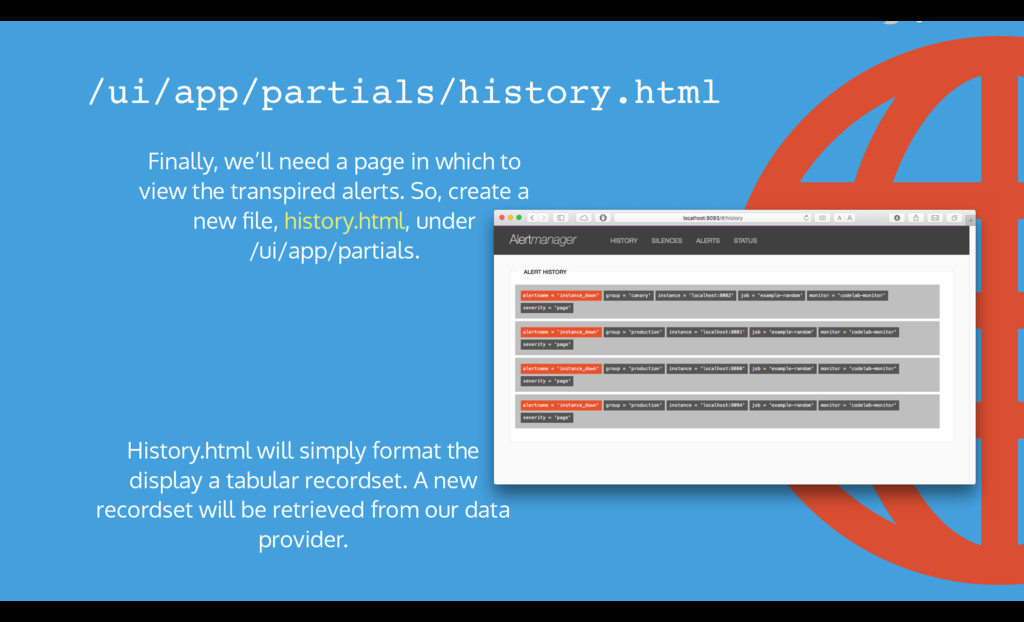
the transpired alerts. So, create a new file, , under /ui/app/partials. history.html History.html will simply format the display a tabular recordset. A new recordset will be retrieved from our data provider. /ui/app/partials/history.html
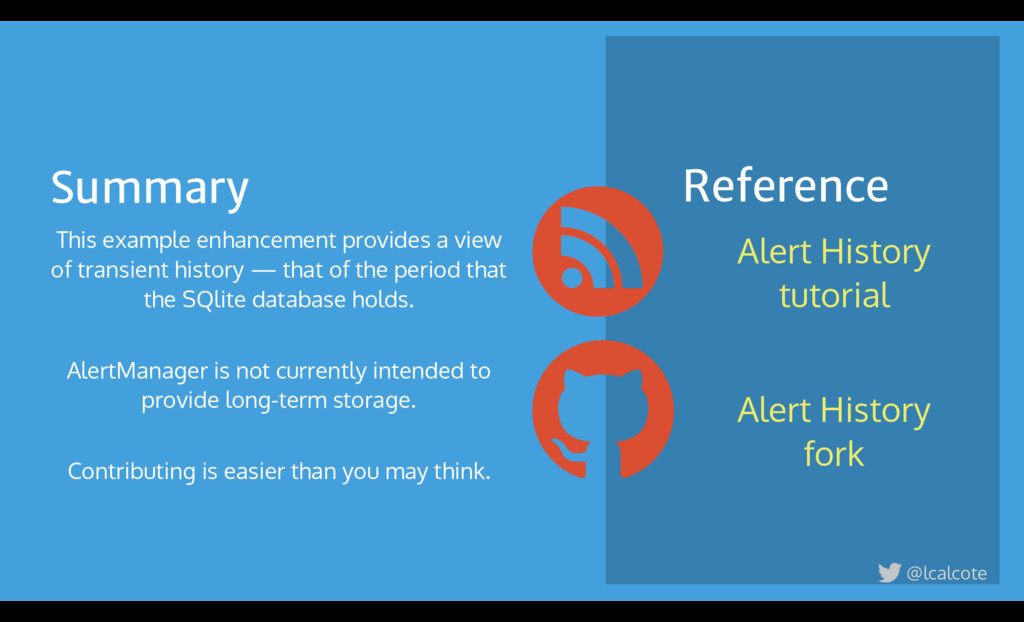
history — that of the period that the SQlite database holds. AlertManager is not currently intended to provide long-term storage. Contributing is easier than you may think. Reference Alert History fork Alert History tutorial
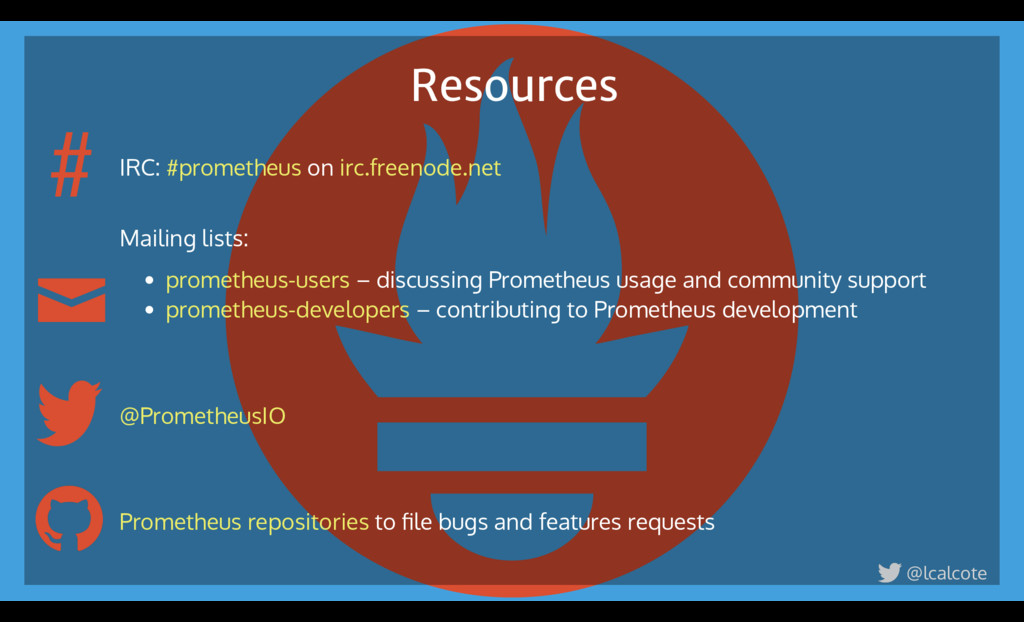
community support – contributing to Prometheus development to file bugs and features requests #prometheus irc.freenode.net prometheus-users prometheus-developers @PrometheusIO Prometheus repositories @lcalcote #
![Lee Calcote linkedin.com/in/leecalcote @lcalcote blog.gingergeek.com [email protected] clouds, containers, infrastructure, applications](https://files.speakerdeck.com/presentations/e46e166a3cf74839a2627912ce4a0a23/slide_1.jpg)
![Notification Integration create an alert notification receiver. route: group_by: [cluster]](https://files.speakerdeck.com/presentations/e46e166a3cf74839a2627912ce4a0a23/slide_22.jpg)