Share
Embed
Secure Management/Use of Location to Improve User Experience
Shoji Morikawa
LINE LINE Planning Team2 Product Manager
https://linedevday.linecorp.com/2020/ja/sessions/4644
https://linedevday.linecorp.com/2020/en/sessions/4644
LINE DevDay 2020
November 25, 2020
Transcript
34 slides
-
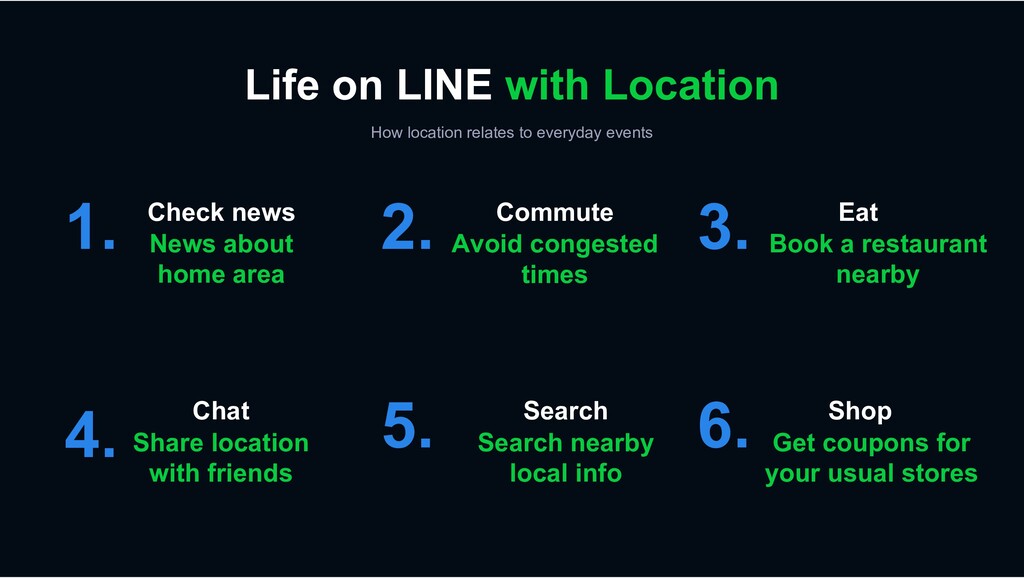
Life on LINE with Location How location relates to everyday
events 1. 2. 3. 4. 5. 6. Check news News about home area Commute Avoid congested times Eat Book a restaurant nearby Chat Share location with friends Search Search nearby local info Shop Get coupons for your usual stores -
Scope of Location Platform Role Data Analysis Understand users and
geography Governance Security Secure data management Delivery Search Deliver content at the right moment -
Security How location data is securely managed in LINE User
Agreement Platform Environment Operations / Policy -
Platform Environment User data anonymization Location Process Location Deletion Process
Analysis / Applications Over 1 billion reports / day Refresh every day (small data size) Hadoop Hadoop Report Latitude, Longitude Location Data (with Anonymized ID) Anonymized ID – User ID Mapping Location Deletion Request Delete User Mapping -
Subtitle Operation / Policy Service Implementation Request Access Grant Access
• Check use case • Approve access • Grant permission via authentication server • Check data deletion process • Check opt-out user data process -
Location Stats – Countrywide Distribution Statistics for Japan LINE Account
Hokkaido 4.0% Tohoku 6.0% Kanto 35.1% Chubu 17.0% Kinki 18.5% Chugoku 5.4% Shikoku 2.7% Kyushu/ Okinawa 11.3% Source: LINE Location DB, Oct 2020 -
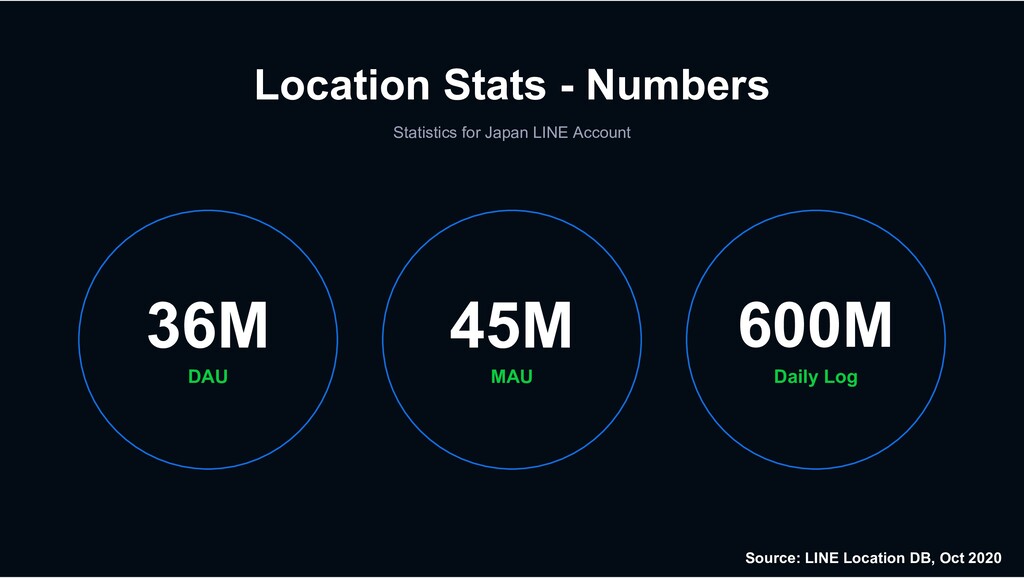
Location Stats - Numbers Statistics for Japan LINE Account DAU
36M Daily Log 600M MAU 45M Source: LINE Location DB, Oct 2020 -
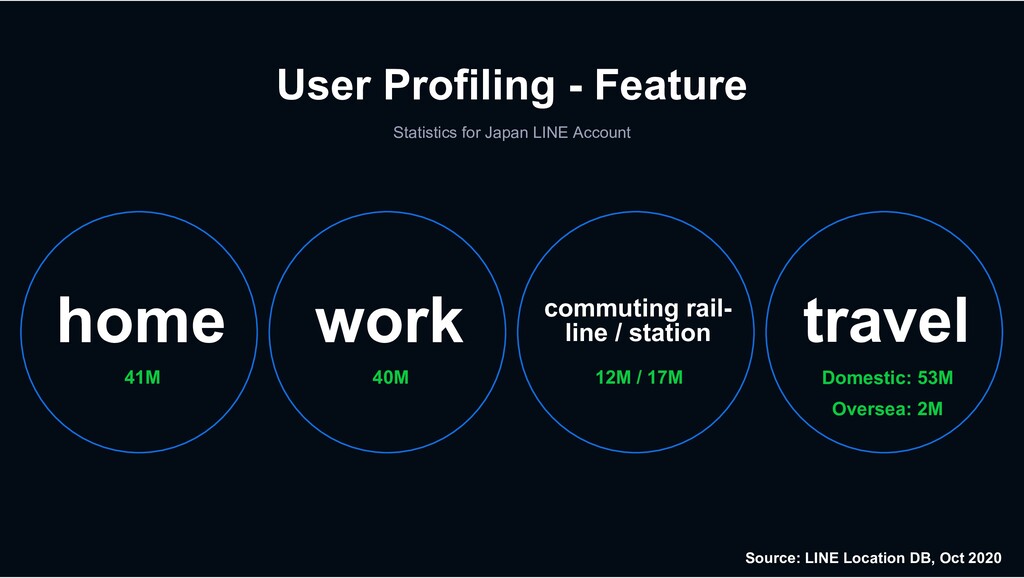
User Profiling - Feature Statistics for Japan LINE Account 41M
home 12M / 17M commuting rail- line / station 40M work Domestic: 53M Oversea: 2M travel Source: LINE Location DB, Oct 2020 -
User Profiling – Feature Expand volume using IP 41M home
39M work 62M 58M IP Address:Location User's IP User's Location Location Data -
Estimation of Commuting Rail Line Quiz: Here are the location
logs for two users. Which rail lines do they use? ? ? -
Estimation of Commuting Rail Line Quiz: Here are the location
logs for two users. Which rail lines do they use? Sobu Line Mita Line -
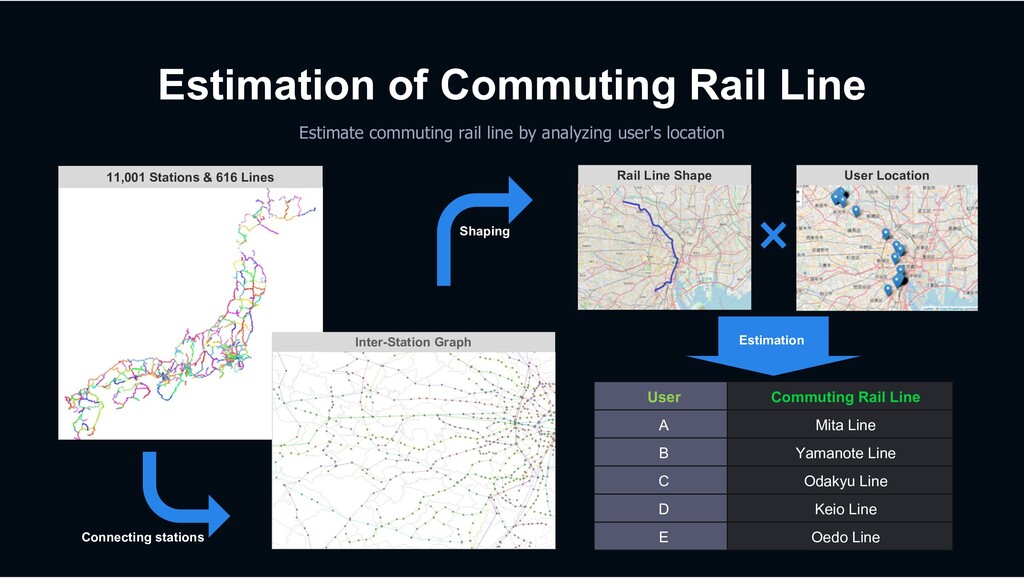
Shaping Estimation of Commuting Rail Line Estimate commuting rail line
by analyzing user's location Estimation Rail Line Shape User Location 11,001 Stations & 616 Lines Inter-Station Graph Connecting stations User Commuting Rail Line A Mita Line B Yamanote Line C Odakyu Line D Keio Line E Oedo Line -
Case Study – Population Change over Time Population density in
the city center changes drastically depending on the time of day The population density in the city center is high in the daytime, and the population density in the suburbs is high at night. -
Search How location data is securely managed in LINE Filtering
x Find Users API Geo Fencing Case Study -
Area Filtering Subtitle User Home Geo Hash (Level 7) User
Profile (Home / Work) Polygon Circle -
Time / Last Location Filtering Subtitle 17:00 15:00 13:00 16:00
14:00 12:00 Time between 13:00 ~ 15:00 Only the last reported location -
Find Users API Extract users with multiple filtering options in
real-time MASTER CODE CIRCLE POLYGON INTERSECTION GEO HASH (Level 8) / User Profiling (Home / Work) GEO HASH (Level 7) CIRCLE POLYGON UNION CIRCLE HOLE -
Geo Fencing Detect fence cross events in real-time ENTER EXIT
STAY 2. Set Fence LINE Service Server 1. Fence Registration 3. Callback -
Case Study – Disaster Notification Area targeted yet mass scale
message delivery Provide content to whom related to the area based on user location -
Disaster Notification Delay Challenge As many as 20M people to
notify as quickly as possible Delivery in under 1min done using only existing infra Elapsed Seconds Users Count User / Sec Area Categories 22.5 sec 14M 612K Tokyo, Kanagawa, Chiba, Saitama, Shizuoka Home 40 sec 18M 437K Last 59 sec 22M 371K Last, Home, Work -
Case Study – LINE Ad Geo Targeting Advertiser can set
a target audience who live in or visited some place by administrative area or radius. CMS for Performance Display Ads 100M~150M daily ad impressions using geo targeting in JP - 15~20% of total ad impressions More advertisers using geo targeting since the release of radius targeting -
Roadmap of Location Platform POI data and Geodemography Analysis Geodemography
Discover regional clusters Data POI POI location and contents -
POI – User x POI What are POIs? Category Retail
store Name Lawson Shiba Koen 4 Cho-me Address Tokyo, Minato-ku, Shiba Koen 4-X-X Tel 03-XXXX-YYYY Coordinates Latitude, Longitude Convenience Store Category Tourist facilities Name Tokyo Tower Address Tokyo, Minato-ku, Shiba Koen 4-X-X Tel 03-XXXX-YYYY Coordinates Latitude, Longitude Tokyo Tower POI (Point of Interest) For example, landmarks and shops that exists in coordinates are converted into data in order to give meaning to specific coordinates on the map. POI DB (6 Million POIs) Example POI Data -
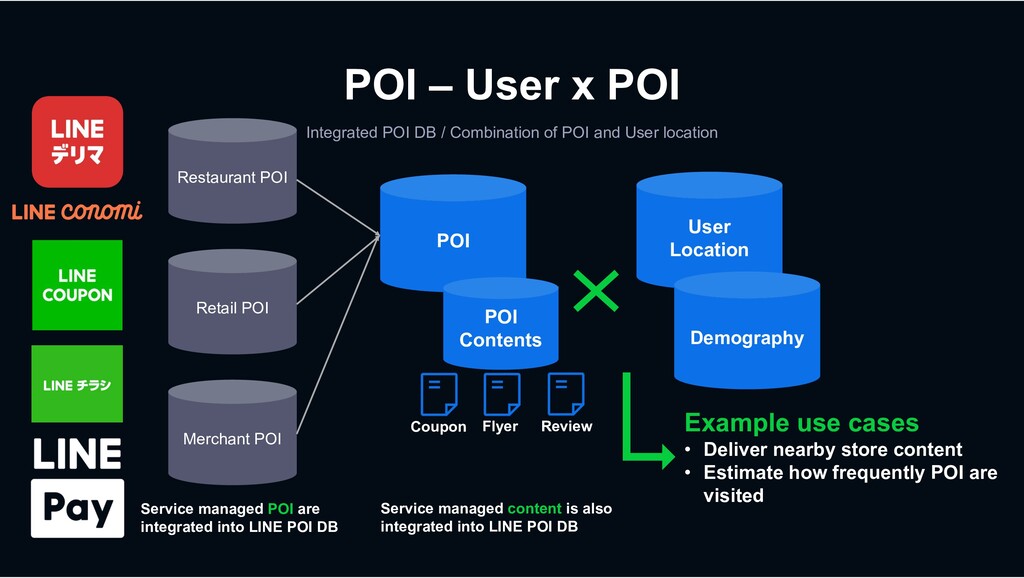
POI – User x POI Integrated POI DB / Combination
of POI and User location Restaurant POI Retail POI Merchant POI POI POI Contents User Location Coupon Flyer Review Demography Service managed POI are integrated into LINE POI DB Example use cases • Deliver nearby store content • Estimate how frequently POI are visited Service managed content is also integrated into LINE POI DB -
POI Traffic Provide traffic stats to avoid congestion at POI
10:00 11:00 12:00 13:00 14:00 15:00 16:00 17:00 18:00 Hourly average for the past few weeks Current real-time number of users Compare traffic by time to avoid busy hours Compare traffic by past average traffic and current traffic -
Geodemography Study of user based on where they live Demography
Behavior Geography Gender Age Income Occupation Nationality Urbanicity Average household income Language Climate Culture Location of home, work Book / Review restaurant Pay at store Online action