Upgrade to Pro — share decks privately, control downloads, hide ads and more …

Using Prometheus to Provide Large Scale Server Monitoring

Using Prometheus to Provide Large Scale Server Monitoring

LINE DevDay 2020

November 25, 2020
Tweet

More Decks by LINE DevDay 2020

Other Decks in Technology

Transcript

  1. › Grew up near Raleigh, North Carolina › Previously worked

    in San Francisco, California › LINE Fukuoka ~4 years › Primarily focused on Monitoring as a Service › Dabbles in Swift and iOS development Introduction - Paul Traylor
  2. Agenda › Overview of Prometheus › Using Promgen to manage

    Prometheus › Alerts and Routing › Supporting Tenants › Scaling for Long Term Storage
  3. https://prometheus.io/docs/introduction/overview/ › Pull based monitoring system › Flexible alerting rules

    › Default support in Grafana › CNCF Graduated Project › Currently undergoing standardization https://openmetrics.io/ What is Prometheus?
  4. Why did we build Promgen? › Developers do not want

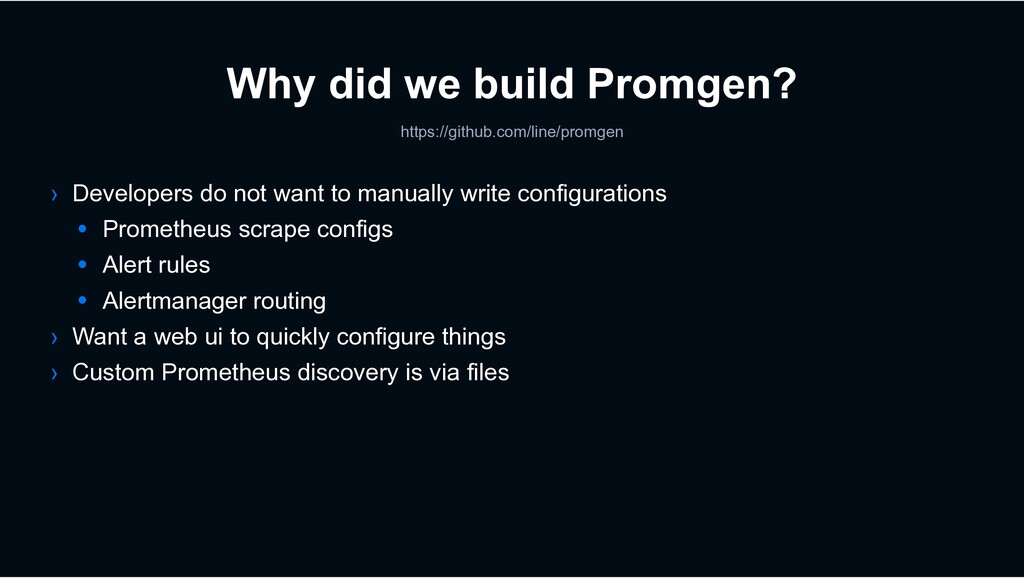
    to manually write configurations • Prometheus scrape configs • Alert rules • Alertmanager routing › Want a web ui to quickly configure things › Custom Prometheus discovery is via files https://github.com/line/promgen
  5. › 46,000,000+ time series (15 second scrape interval) › 34,000+

    targets › 9+ shards › 2M~8M time series per server › 2 weeks ~ 10 weeks data per server Prometheus at LINE
  6. Prometheus as a Service LINE Scale - Challenges › Reliability

    (Sharding) › Performance (Alerting) › Multi-tenancy › Long term storage
  7. Clusters - Prometheus › Alpha Cluster • Testing and development

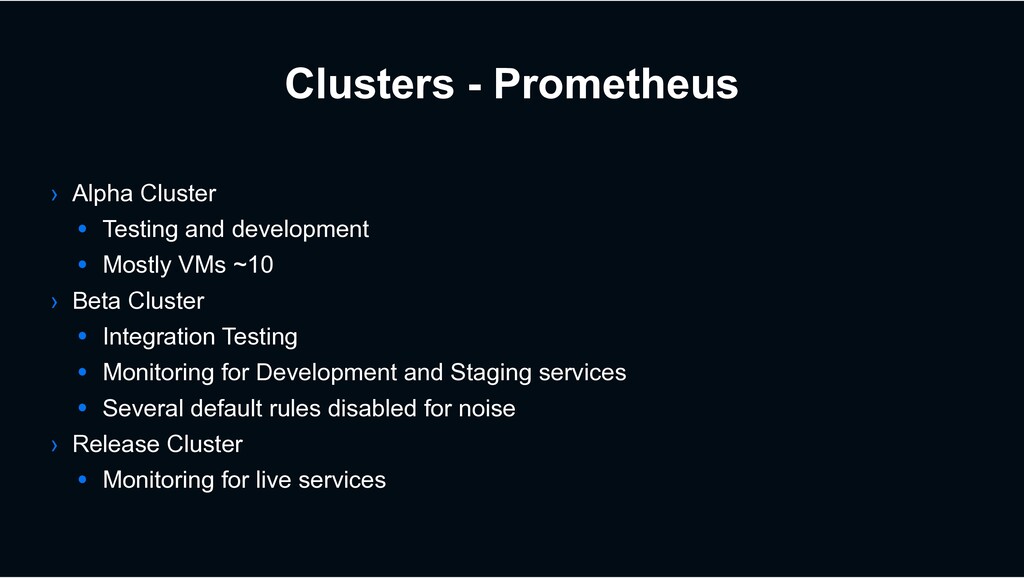
    • Mostly VMs ~10 › Beta Cluster • Integration Testing • Monitoring for Development and Staging services • Several default rules disabled for noise › Release Cluster • Monitoring for live services
  8. Release Cluster - Run everything in Pairs Sharding - Prometheus

    › 20 Prometheus Servers (Physical Servers) • 20 CPU / 256GB Memory / 10G Network / SAS 2400 GB • 2 Prometheus servers per Shard (for HA) › 2 Web Servers • Nginx / Grafana / Promgen / Thanos Query › 4 blackbox_exporter probes • 2 monitoring inside private cloud (Verda) • 2 monitoring from external cloud (AWS)
  9. Sharding - Prometheus › 4 General purpose shards • Free

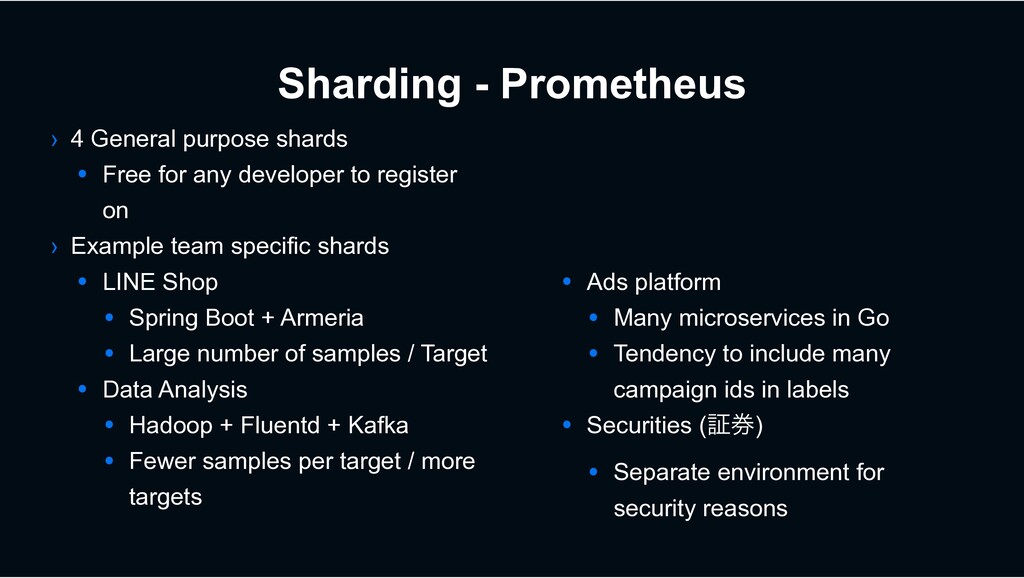
    for any developer to register on › Example team specific shards • LINE Shop • Spring Boot + Armeria • Large number of samples / Target • Data Analysis • Hadoop + Fluentd + Kafka • Fewer samples per target / more targets • Ads platform • Many microservices in Go • Tendency to include many campaign ids in labels • Securities (ূ݊) • Separate environment for security reasons
  10. Alerts - Routing › Promgen uses "service" and "project" to

    route notifications › Easy to accidentally erase them using "sum()" and "count()"
  11. Alerts - Routing sum(some_metric) {} 2 sum(some_metric) by (service, project)

    {service=“A”, project=“A1”} 1 {service=“B”, project=“B1”} 1 some_metric {service="A", project="A1", instance="aaa001.example.com"} 1 {service="A", project="A1", instance="aaa002.example.com"} 1
  12. Alerts - Global Alert Rules vs Custom › Want to

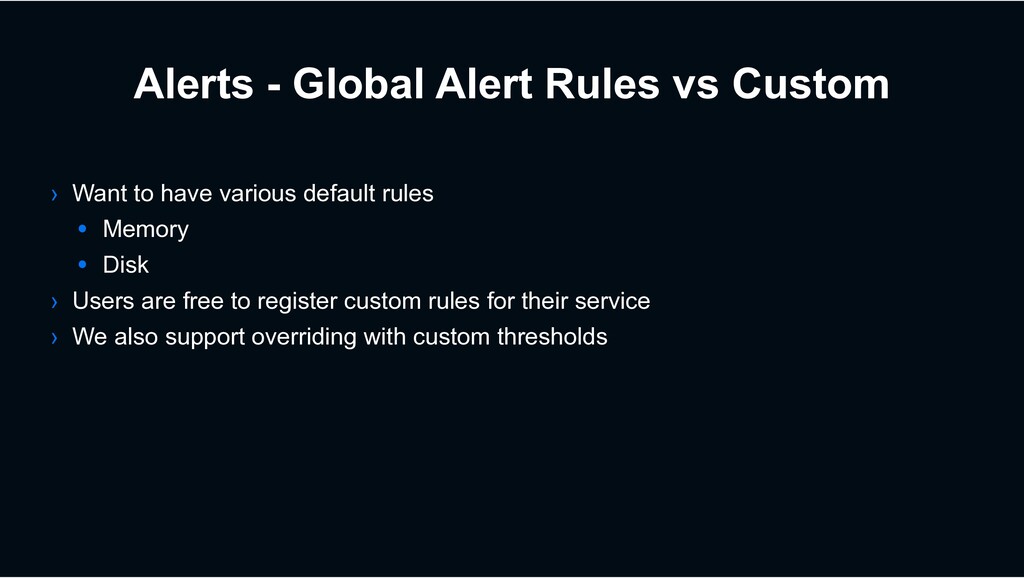
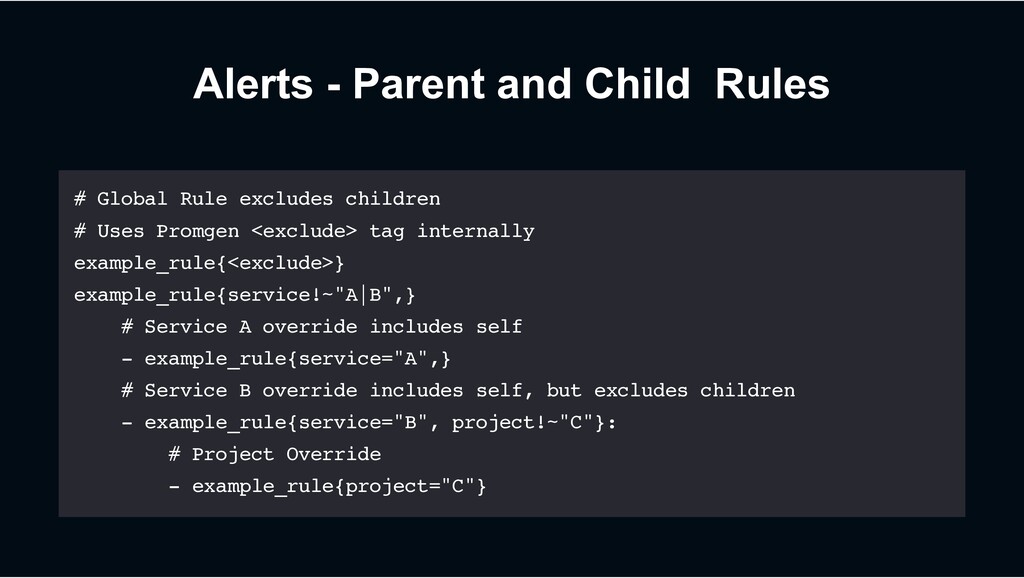
    have various default rules • Memory • Disk › Users are free to register custom rules for their service › We also support overriding with custom thresholds
  13. Alerts - Parent and Child Rules # Global Rule excludes

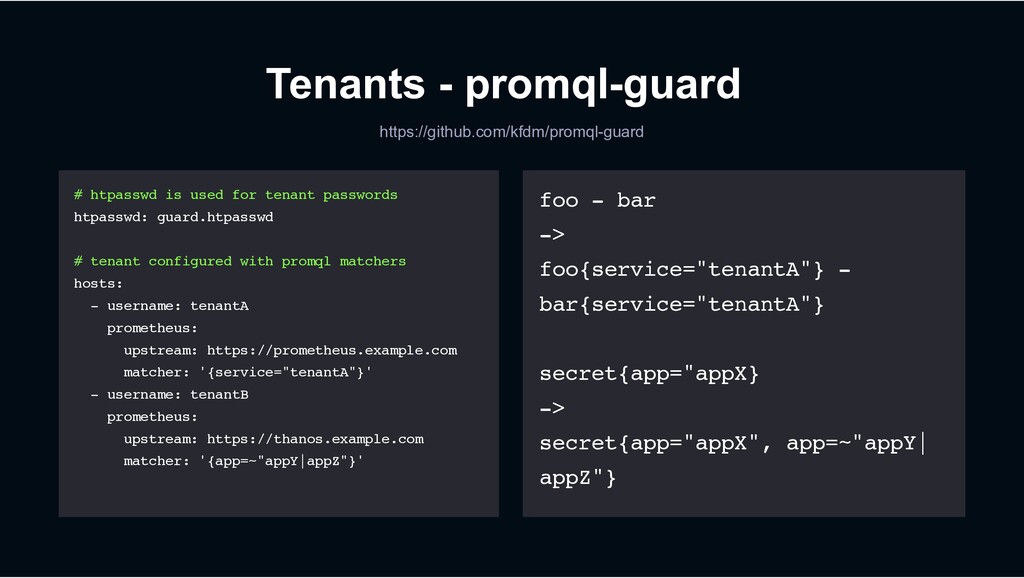
    children # Uses Promgen <exclude> tag internally example_rule{<exclude>} example_rule{service!~"A|B",} # Service A override includes self - example_rule{service="A",} # Service B override includes self, but excludes children - example_rule{service="B", project!~"C"}: # Project Override - example_rule{project="C"}
  14. Alerts - Global PromgenLargeMetricsIncrease meta:samples:sum = sum by(service, project, job)

    (scrape_samples_scraped) meta:samples:sum > 2 * meta:samples:sum offset 1w > 100000 ExcessivelyLargeScrape scrape_samples_scraped > 100000 SSLCertificateExpireSoon probe_ssl_earliest_cert_expiry - time() < 60 * 60 * 24 * 14
  15. Alerts - Internal AlertDeliveryError rate(alertmanager_notifications_failed_total[5m]) > 0 PrometheusNotificationDelivery rate(prometheus_notifications_errors_total[5m]) >

    0 PrometheusConfigSync max(prometheus_config_last_reload_success_timestamp_seconds) BY (project,service) - min(prometheus_config_last_reload_success_timestamp_seconds) BY (project,service) > 120
  16. Main Grafana Instance Tenants - Grafana › Shared across most

    teams • ~400 Active Users • ~50 Organizations • ~1300 Dashboards Created
  17. Tenants - Grafana › Shared organization • group permissions •

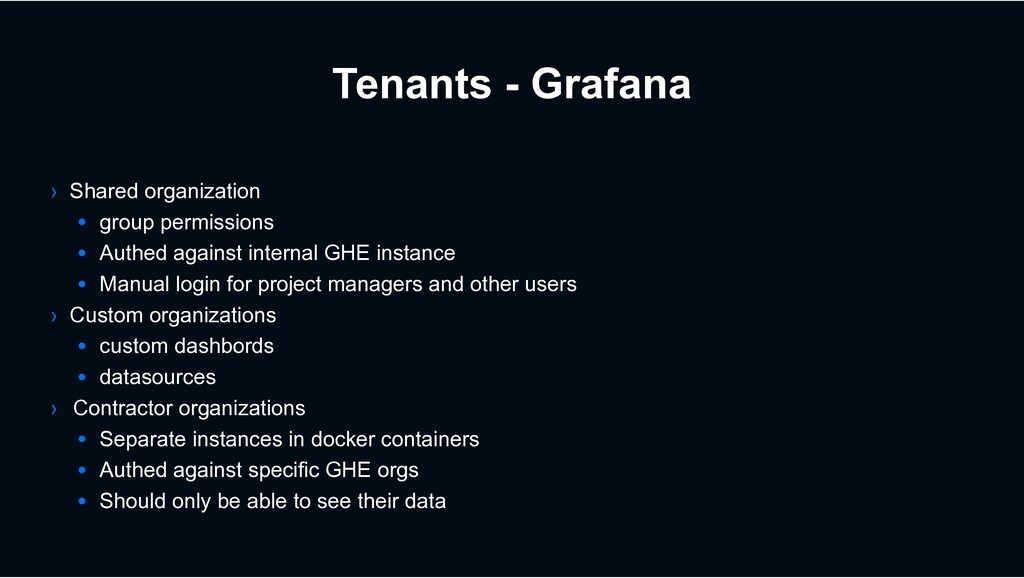
    Authed against internal GHE instance • Manual login for project managers and other users › Custom organizations • custom dashbords • datasources › Contractor organizations • Separate instances in docker containers • Authed against specific GHE orgs • Should only be able to see their data
  18. # htpasswd is used for tenant passwords htpasswd: guard.htpasswd #

    tenant configured with promql matchers hosts: - username: tenantA prometheus: upstream: https://prometheus.example.com matcher: '{service="tenantA"}' - username: tenantB prometheus: upstream: https://thanos.example.com matcher: '{app=~"appY|appZ"}' foo - bar -> foo{service="tenantA"} - bar{service="tenantA"} secret{app="appX} -> secret{app="appX", app=~"appY| appZ"} Tenants - promql-guard https://github.com/kfdm/promql-guard
  19. Scaling - Long Term Storage › Prometheus does a good

    job showing recent metrics › Sometimes users want to know what happend 6+ months ago › Need to use something else to store historical data
  20. Scaling - Thanos Data Model › Uses object storage (ex.

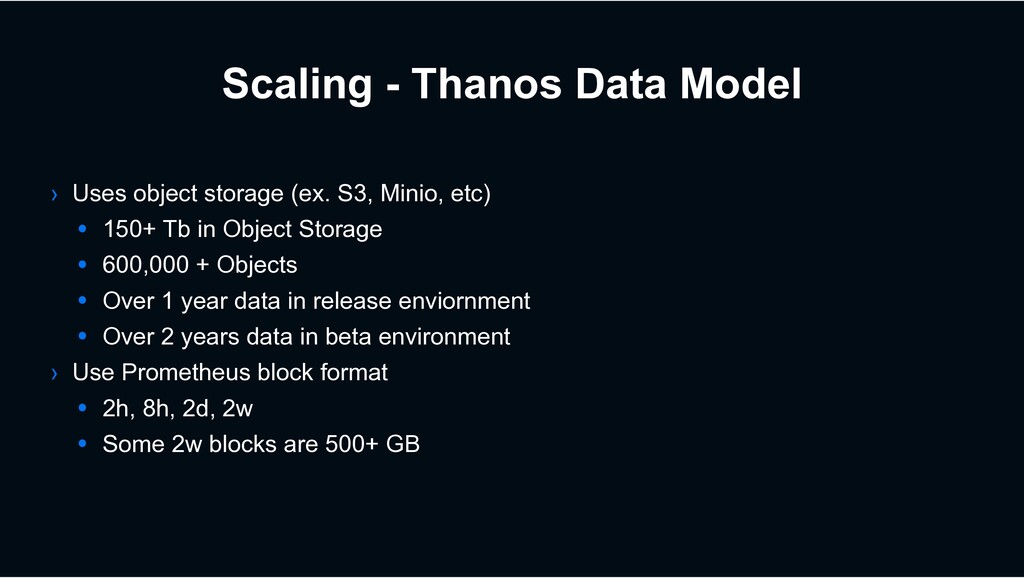
    S3, Minio, etc) • 150+ Tb in Object Storage • 600,000 + Objects • Over 1 year data in release enviornment • Over 2 years data in beta environment › Use Prometheus block format • 2h, 8h, 2d, 2w • Some 2w blocks are 500+ GB
  21. Scaling - Thanos at LINE › 9 thanos-compact nodes •

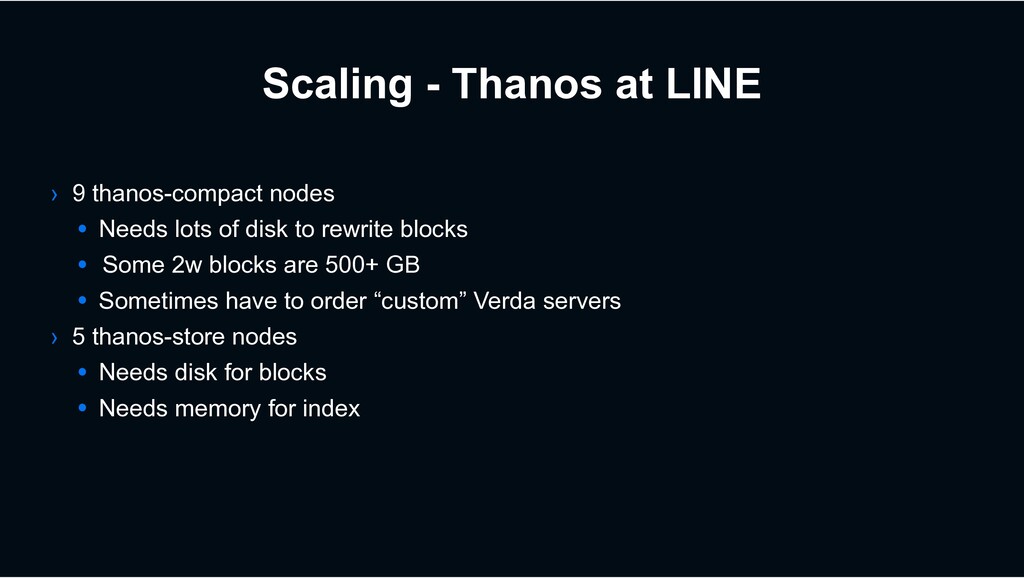
    Needs lots of disk to rewrite blocks • Some 2w blocks are 500+ GB • Sometimes have to order “custom” Verda servers › 5 thanos-store nodes • Needs disk for blocks • Needs memory for index
  22. › Currently storing in a single, large bucket › assigning

    time buckets • --min-time • --max-time › spliting up label set • --selector.relabel-config-file • --selector.relabel-config Scaling - thanos-store
  23. › 9 match numbers shard • take serial make it

    parallel --debug.max-compaction-level --selector.relabel-config-file --selector.relabel-config Scaling - thanos-compact
  24. Summary › A single Prometheus server can scale pretty well

    › Careful sharding can scale further › Pay attention to rule query › Be aware of sharing data › Tools like Thanos can make Prometheus scale further