• Introduction to oslo.metric s • Why oslo.metrics ? • What is oslo.metrics ? • Architectur e • How is oslo.metrics Used ? • Metrics visualizatio n • Troubleshootin g • Metrics trend monitorin g • Upstream Effort s • Demo 3
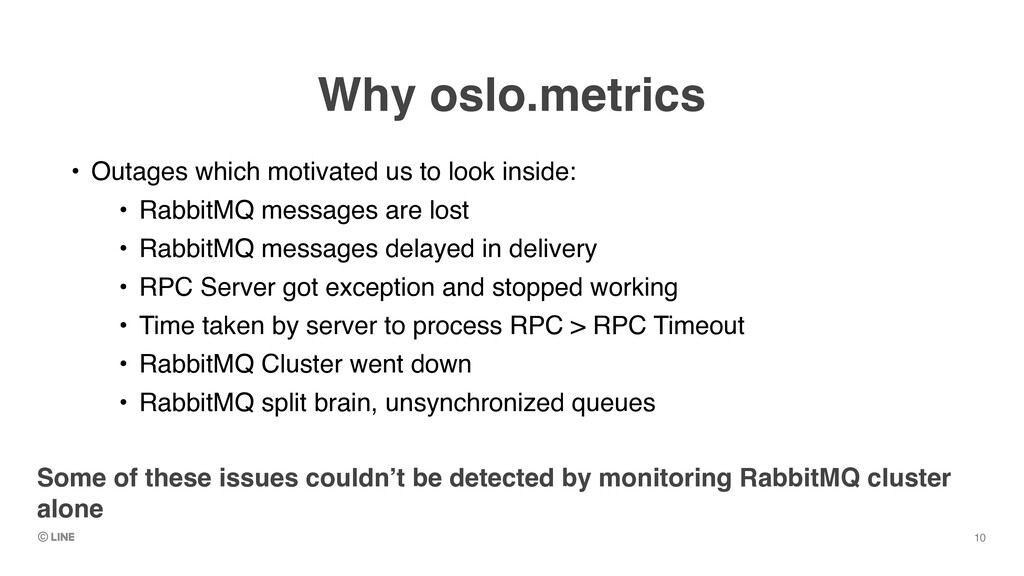
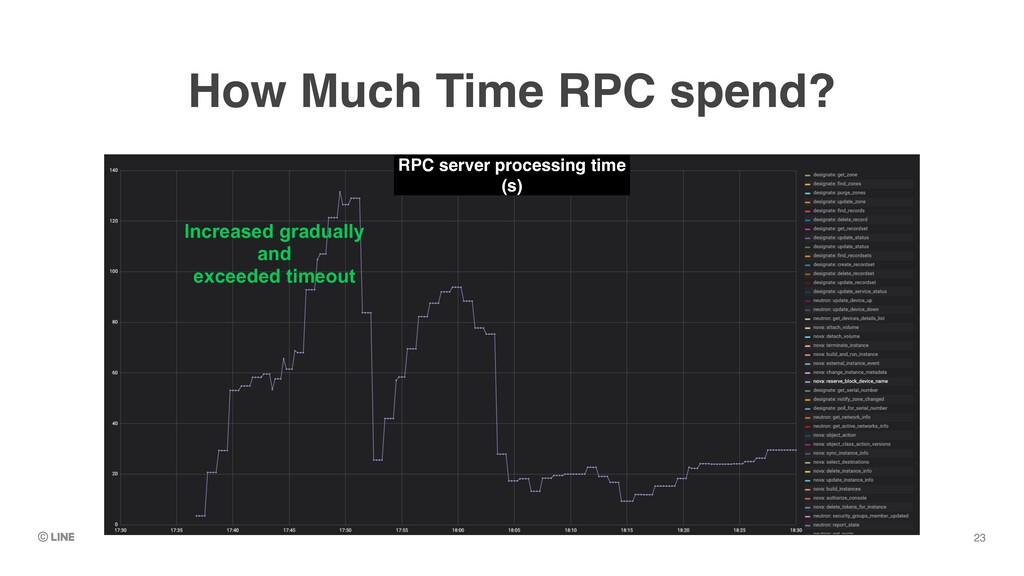
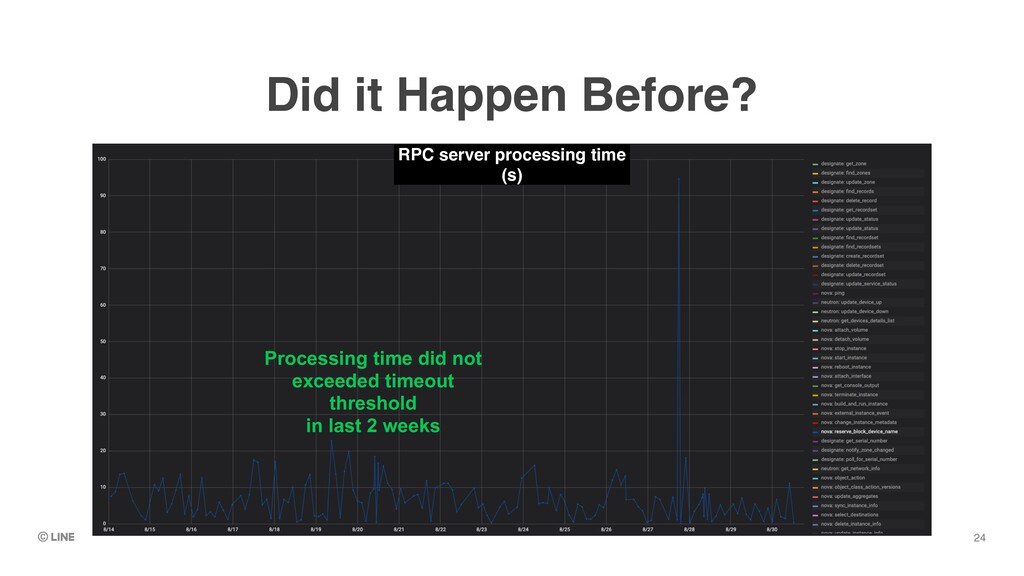
: • RabbitMQ messages are los t • RabbitMQ messages delayed in deliver y • RPC Server got exception and stopped workin g • Time taken by server to process RPC > RPC Timeou t • RabbitMQ Cluster went dow n • RabbitMQ split brain, unsynchronized queues 10 Some of these issues couldn’t be detected by monitoring RabbitMQ cluster alone
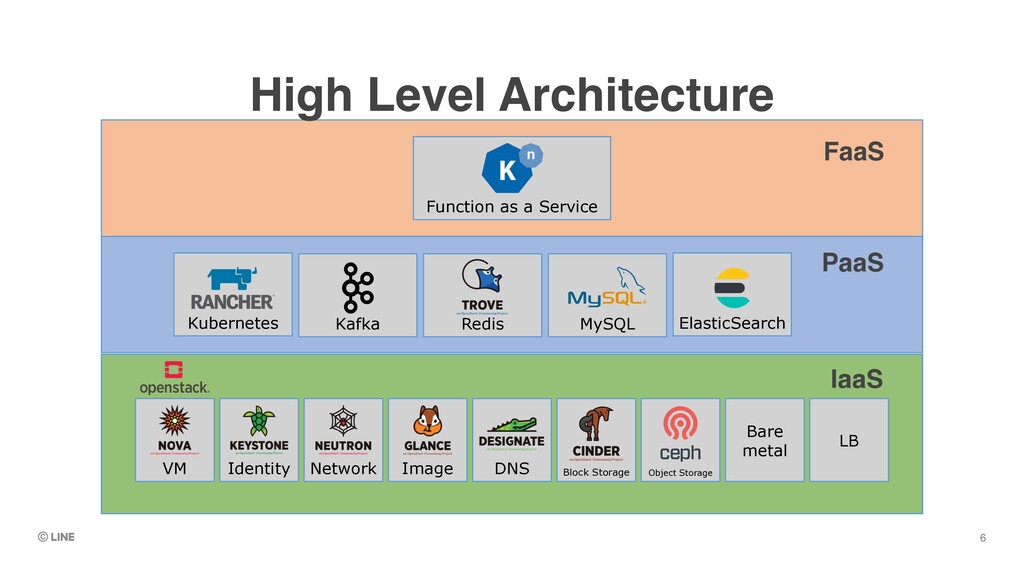
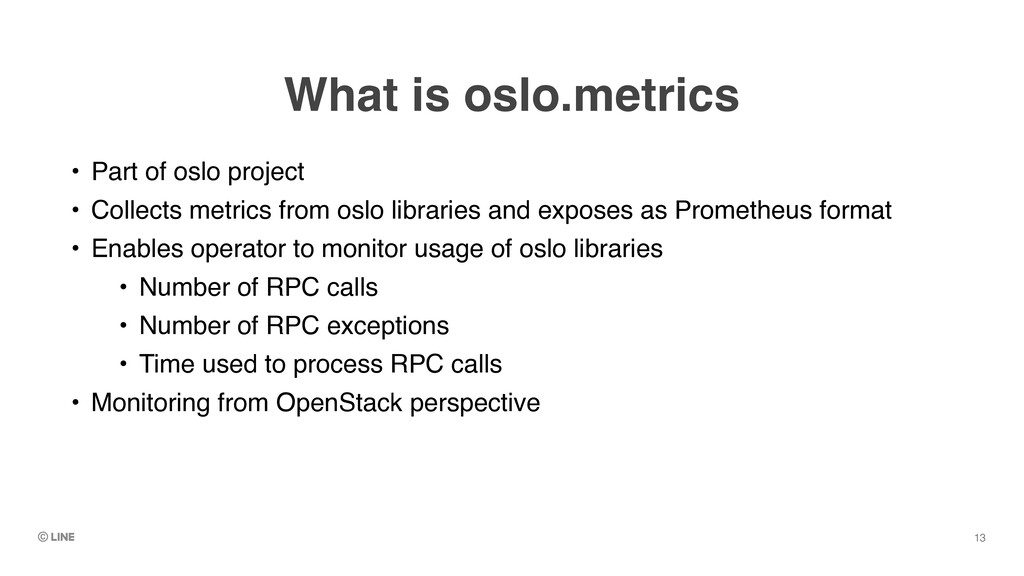
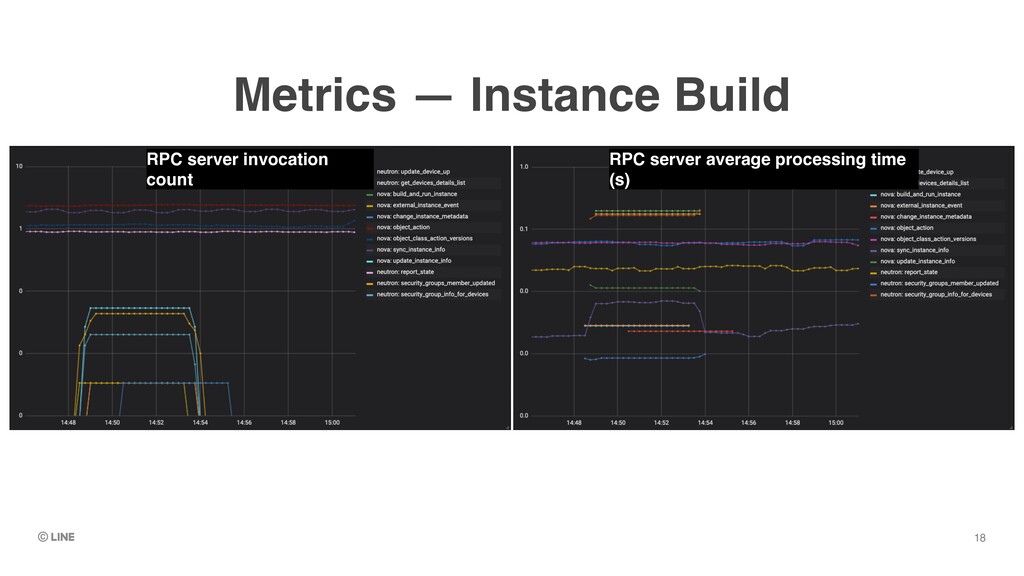
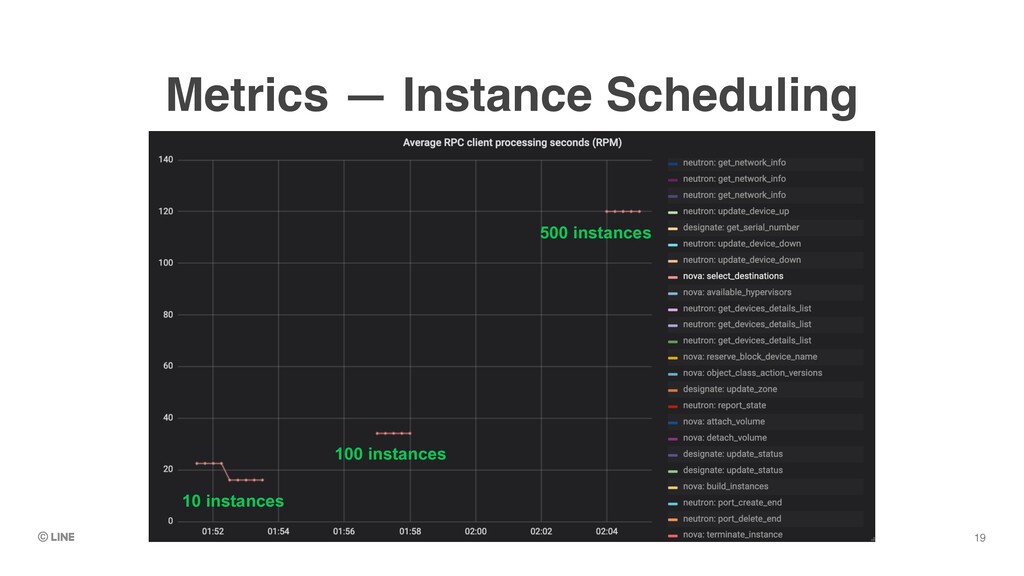
Collects metrics from oslo libraries and exposes as Prometheus forma t • Enables operator to monitor usage of oslo libraries • Number of RPC call s • Number of RPC exception s • Time used to process RPC call s • Monitoring from OpenStack perspective 13
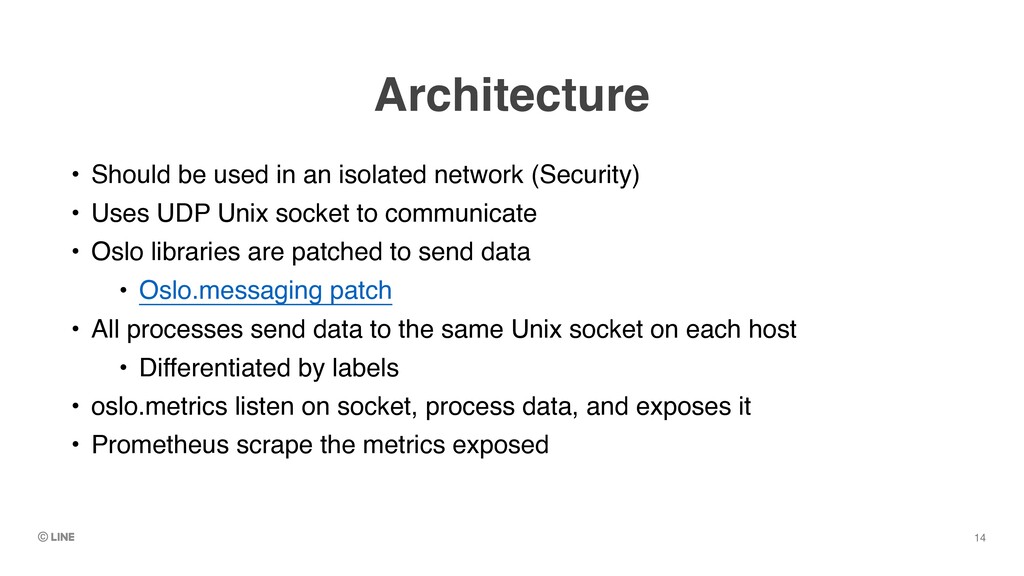
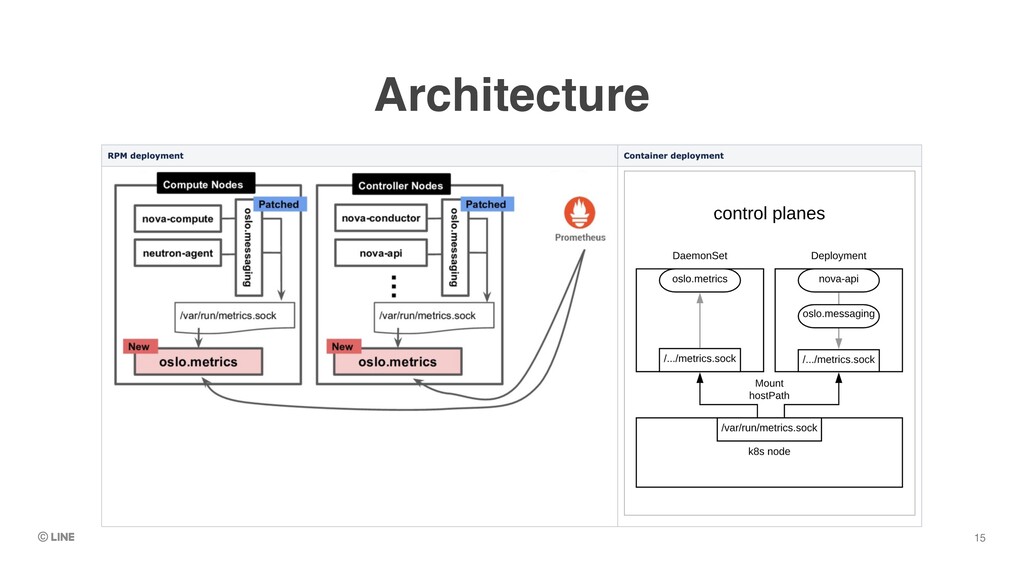
) • Uses UDP Unix socket to communicat e • Oslo libraries are patched to send dat a • Oslo.messaging patch • All processes send data to the same Unix socket on each hos t • Differentiated by label s • oslo.metrics listen on socket, process data, and exposes i t • Prometheus scrape the metrics exposed 14
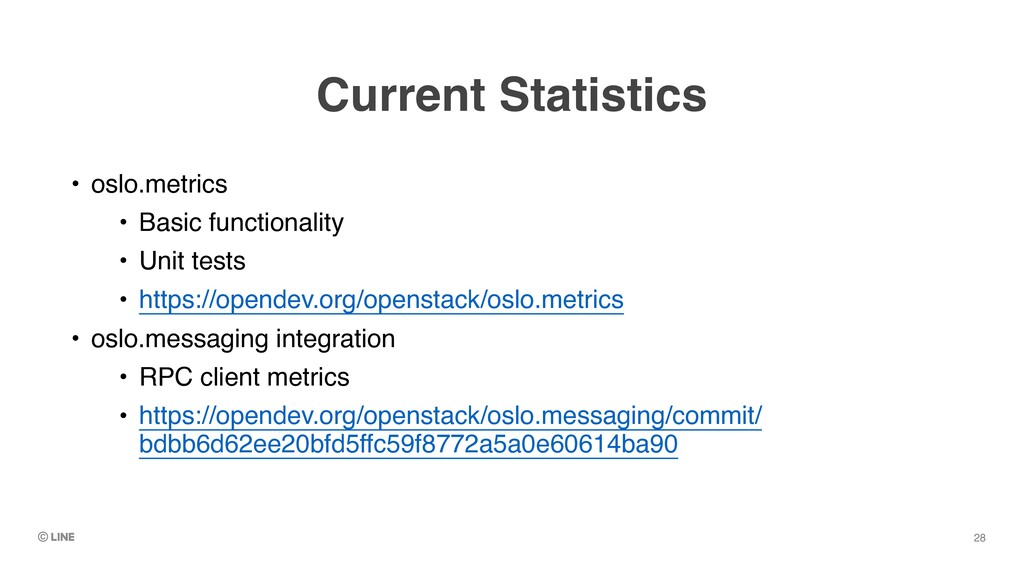
Unit test s • https://opendev.org/openstack/oslo.metrics • oslo.messaging integratio n • RPC client metrics • https://opendev.org/openstack/oslo.messaging/commit/ bdbb6d62ee20bfd5ffc59f8772a5a0e60614ba90 28
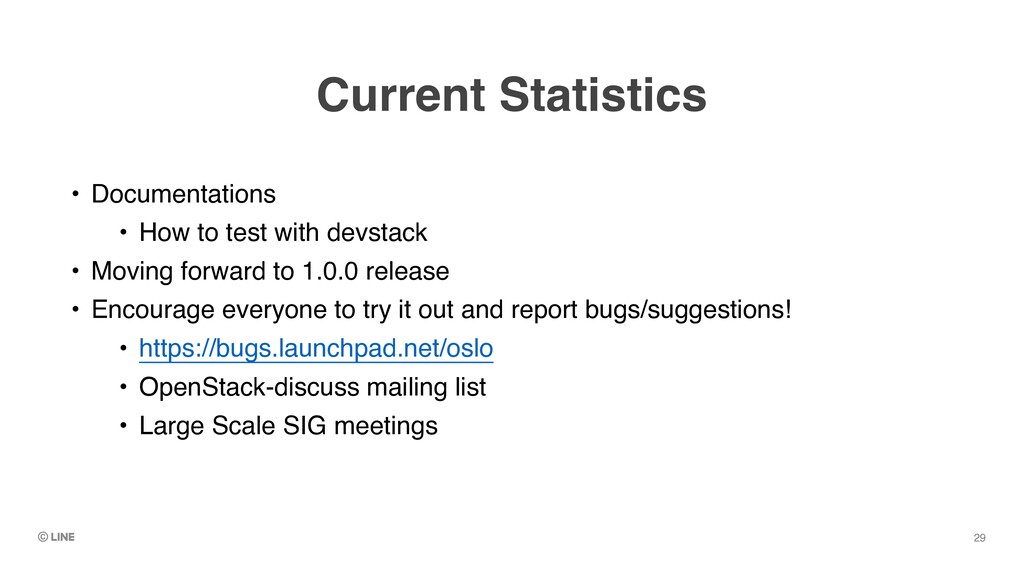
devstac k • Moving forward to 1.0.0 releas e • Encourage everyone to try it out and report bugs/suggestions ! • https://bugs.launchpad.net/oslo • OpenStack-discuss mailing lis t • Large Scale SIG meetings 29
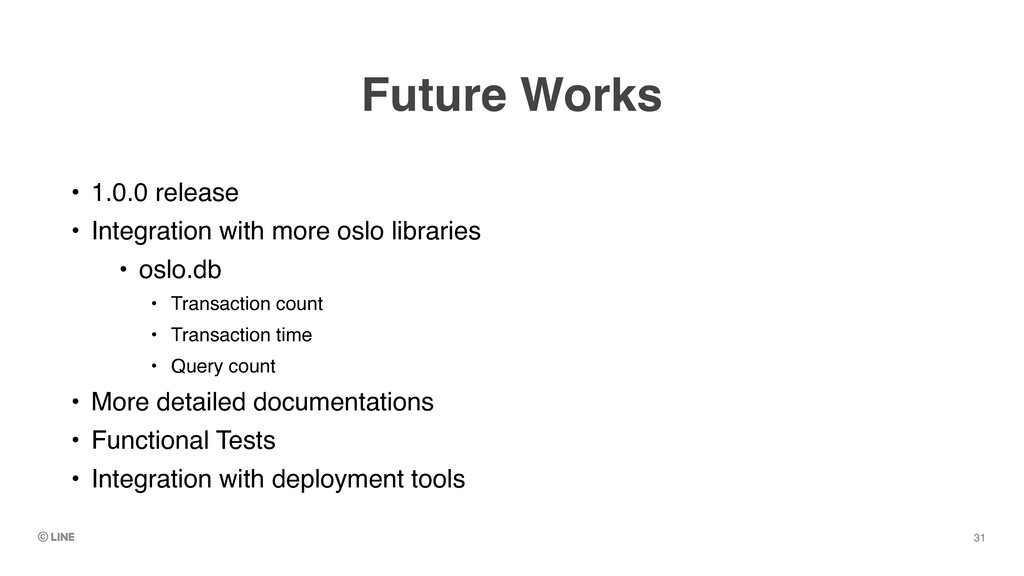
oslo librarie s • oslo.d b • Transaction coun t • Transaction tim e • Query coun t • More detailed documentation s • Functional Test s • Integration with deployment tools 31