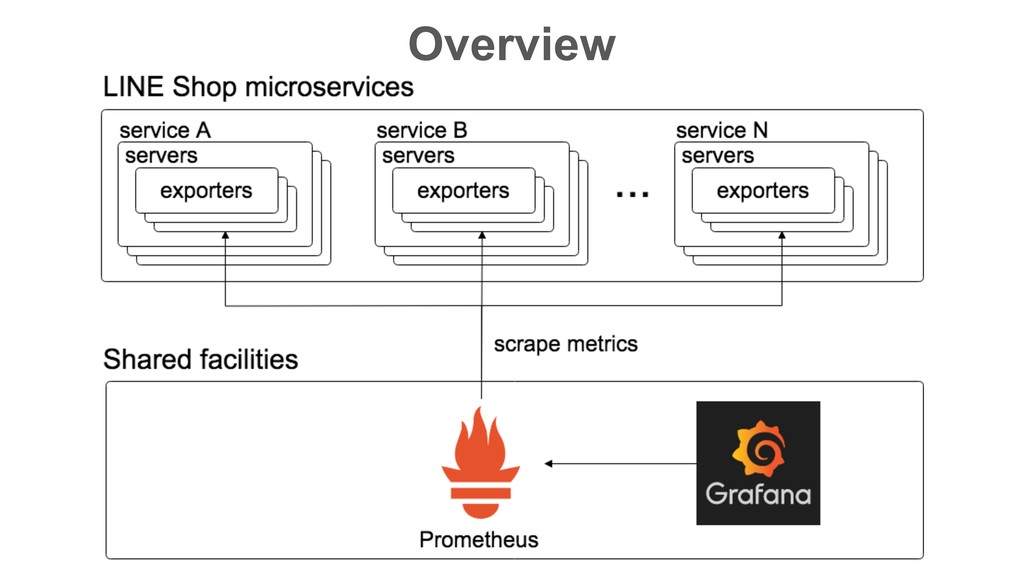
LINE ShopチームでのPrometheus/Grafana/Zipkin/Elasticsearch/Kibanaを使ったサービスモニタリング / Service monitoring with Prometheus,Grafana,Zipkin,Elasticsearch,Kibana at LINE Shop team
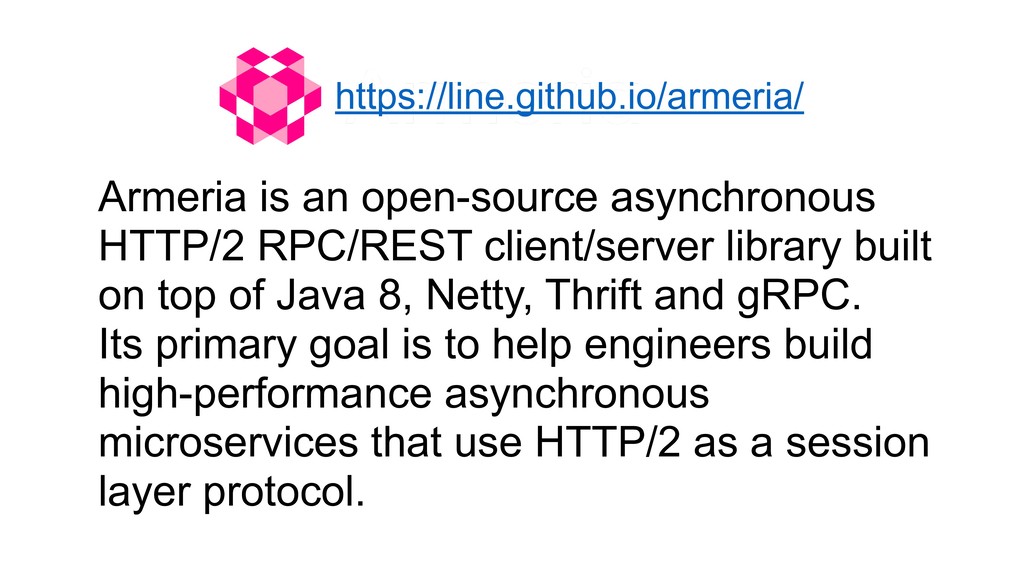
on top of Java 8, Netty, Thrift and gRPC. Its primary goal is to help engineers build high-performance asynchronous microservices that use HTTP/2 as a session layer protocol. https://line.github.io/armeria/
{ final Tracing tracing = TracingFactory.create("frontend"); final HttpClient backendClient = new HttpClientBuilder("http://localhost:9000/") .decorator(HttpTracingClient.newDecorator(tracing, "backend")) .build(); final Server server = new ServerBuilder() .http(8081) .service("/", (ctx, res) -> backendClient.get("/api")) .decorator(HttpTracingService.newDecorator(tracing)) .decorator(LoggingService.newDecorator()) .build(); server.start().join(); } } https://github.com/openzipkin-contrib/zipkin-armeria-example/blob/master/src/main/java/armeria/Frontend.java Sample code from zipkin-armeria-example
{ final Tracing tracing = TracingFactory.create("backend"); final Server server = new ServerBuilder() .http(9000) .service("/api", (ctx, res) -> HttpResponse.of(new Date().toString())) .decorator(HttpTracingService.newDecorator(tracing)) .decorator(LoggingService.newDecorator()) .build(); server.start().join(); } } https://github.com/openzipkin-contrib/zipkin-armeria-example/blob/master/src/main/java/armeria/Backend.java Sample code from zipkin-armeria-example
![public final class Frontend { public static void main(String[] args)](https://files.speakerdeck.com/presentations/448b47add22040418a16253b35efd6f7/slide_15.jpg)
![public final class Backend { public static void main(String[] args)](https://files.speakerdeck.com/presentations/448b47add22040418a16253b35efd6f7/slide_16.jpg)