A look at the result of our latest large-scale study about Docker usage in real environment. Analyze and see the impact for operations and monitoring.
Reference: https://www.datadoghq.com/docker-adoption/
• Software Engineer @ Datadog • Joined Datadog 3 years ago • Worked on Datadog’s integration with Docker and its ecosystem Benjamin Fernandes @LotharSee
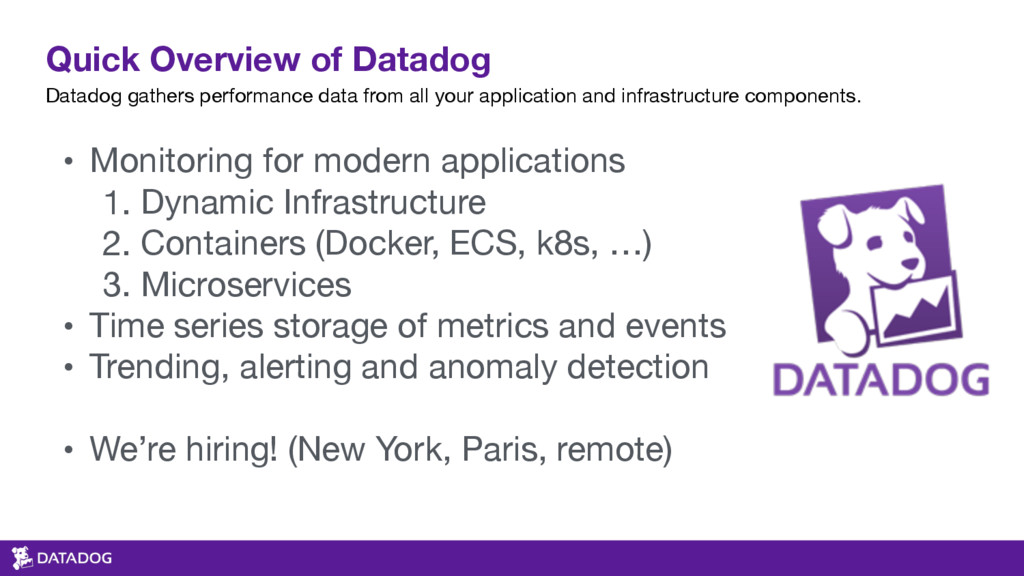
your application and infrastructure components. • Monitoring for modern applications 1. Dynamic Infrastructure 2. Containers (Docker, ECS, k8s, …) 3. Microservices • Time series storage of metrics and events • Trending, alerting and anomaly detection • We’re hiring! (New York, Paris, remote)
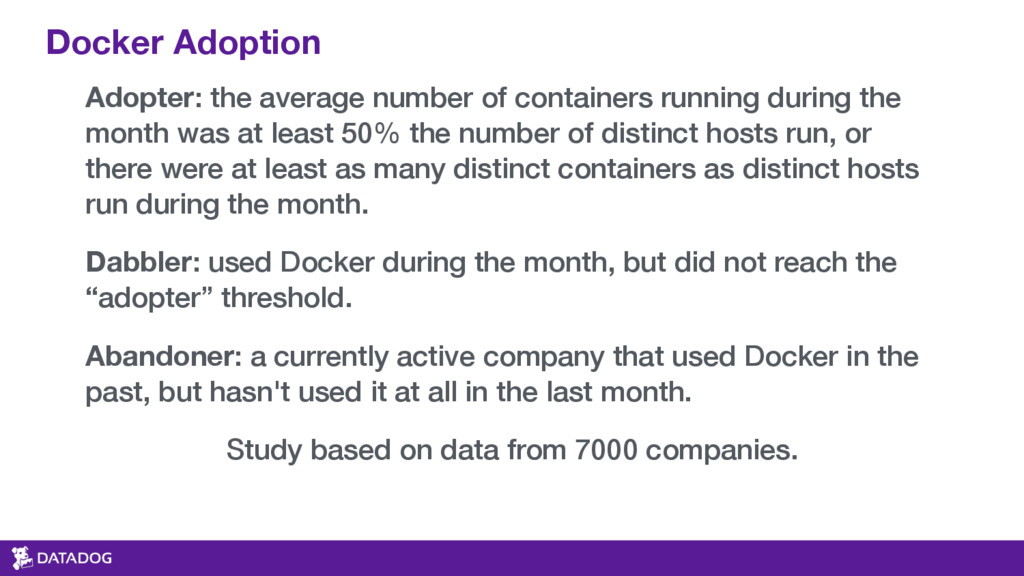
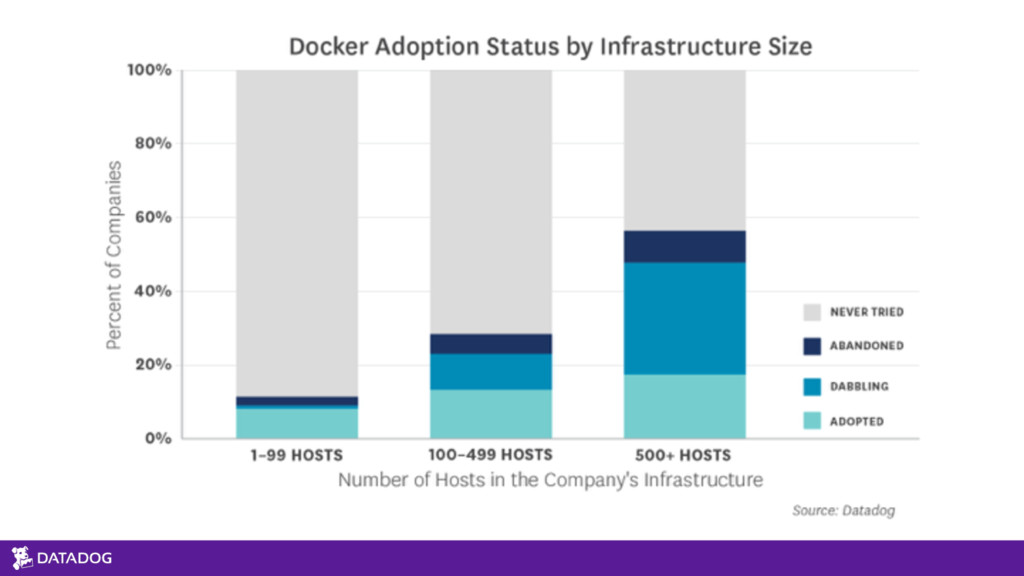
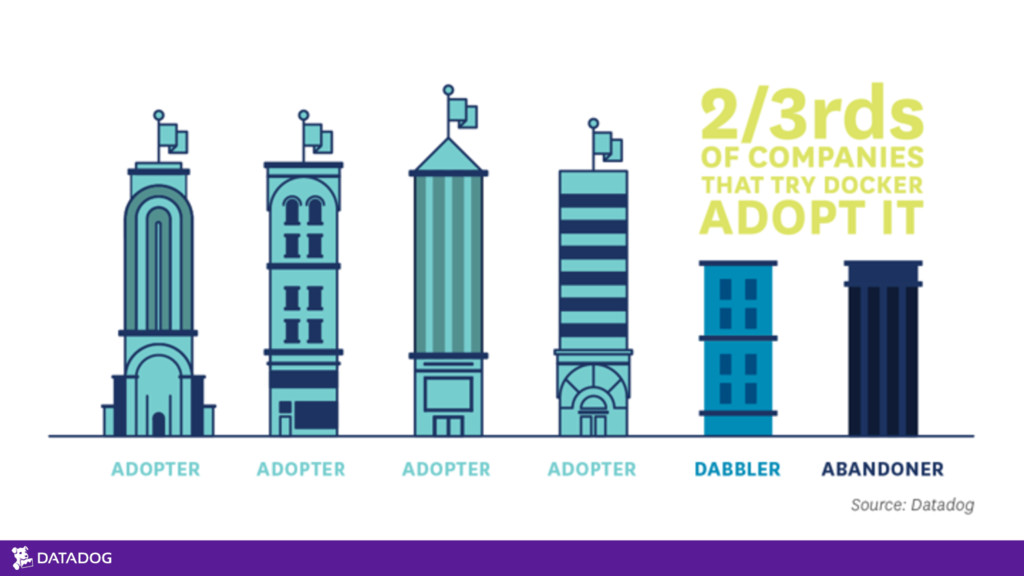
was at least 50% the number of distinct hosts run, or there were at least as many distinct containers as distinct hosts run during the month. Dabbler: used Docker during the month, but did not reach the “adopter” threshold. Abandoner: a currently active company that used Docker in the past, but hasn't used it at all in the last month. Study based on data from 7000 companies. Docker Adoption
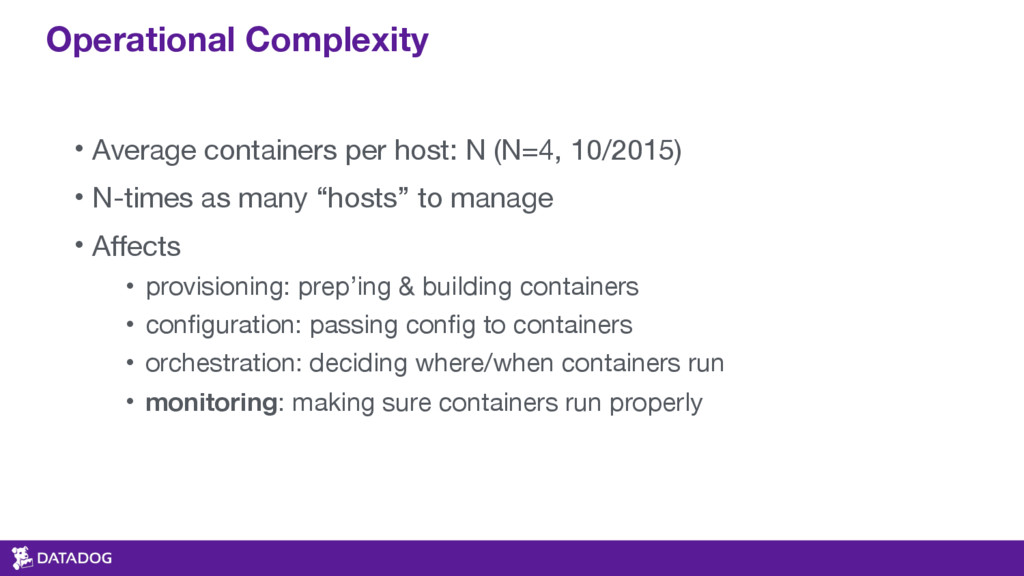
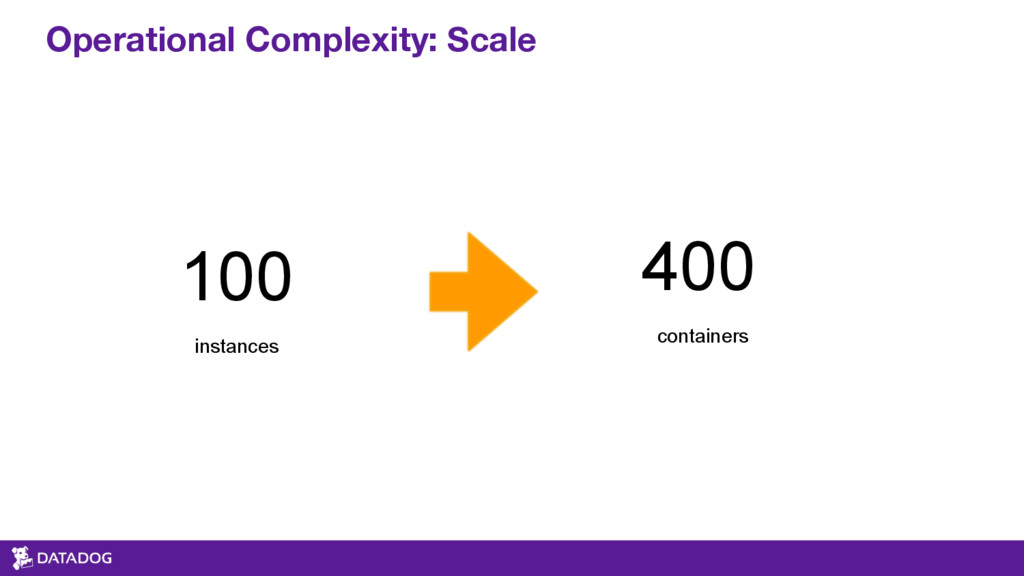
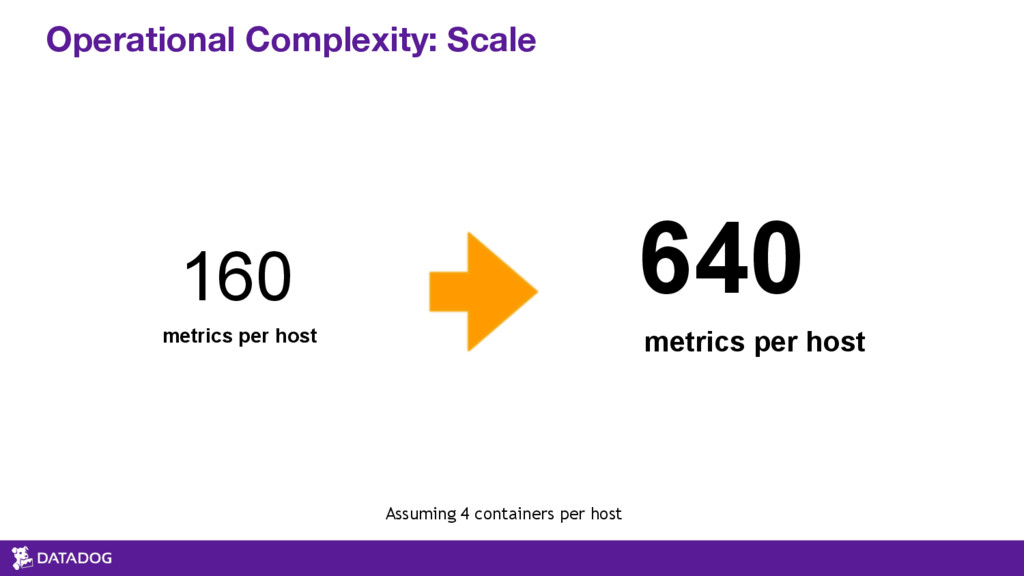
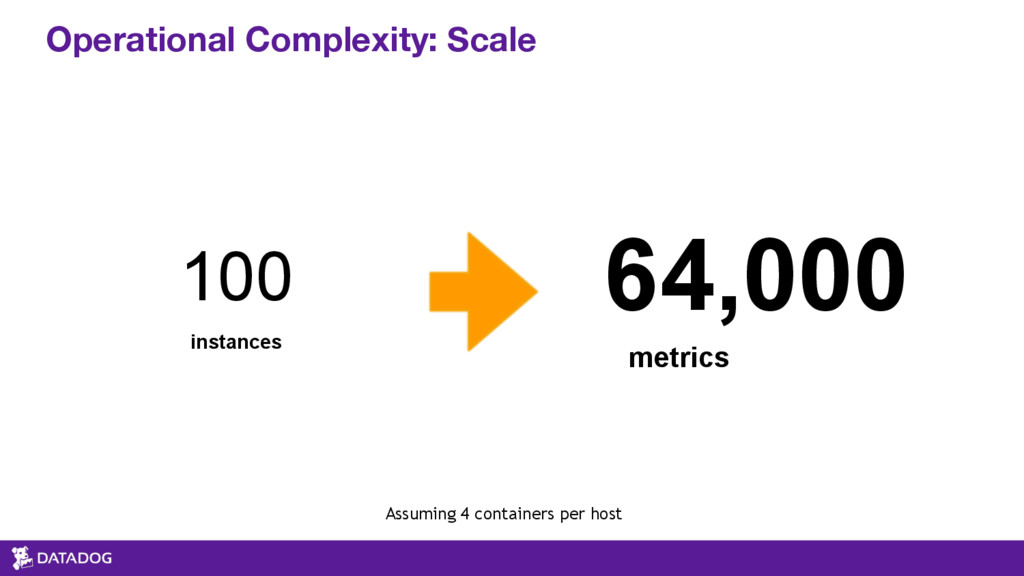
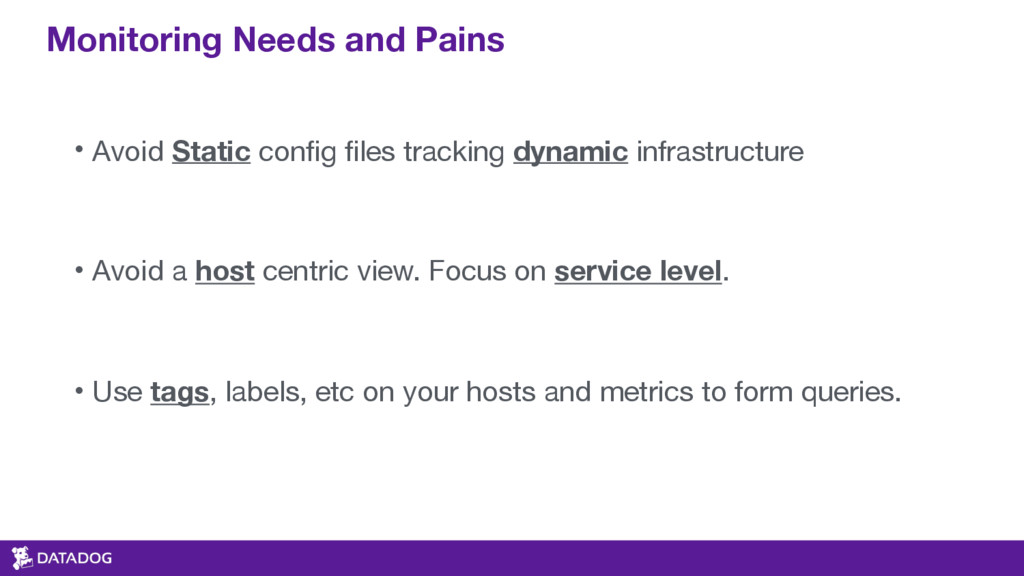
• N-times as many “hosts” to manage • Affects • provisioning: prep’ing & building containers • configuration: passing config to containers • orchestration: deciding where/when containers run • monitoring: making sure containers run properly
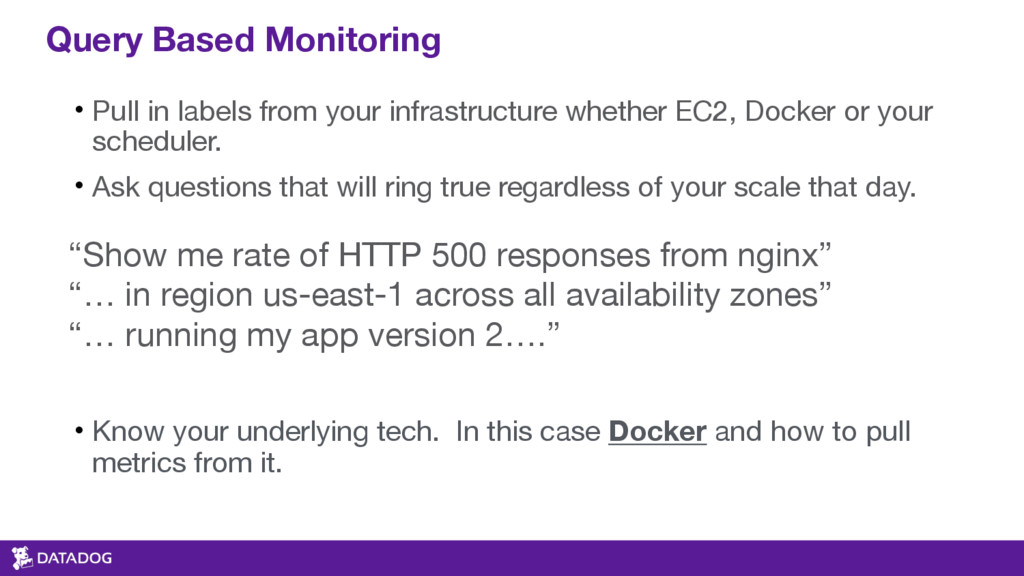
from nginx” “… in region us-east-1 across all availability zones” “… running my app version 2….” • Pull in labels from your infrastructure whether EC2, Docker or your scheduler. • Ask questions that will ring true regardless of your scale that day. • Know your underlying tech. In this case Docker and how to pull metrics from it.
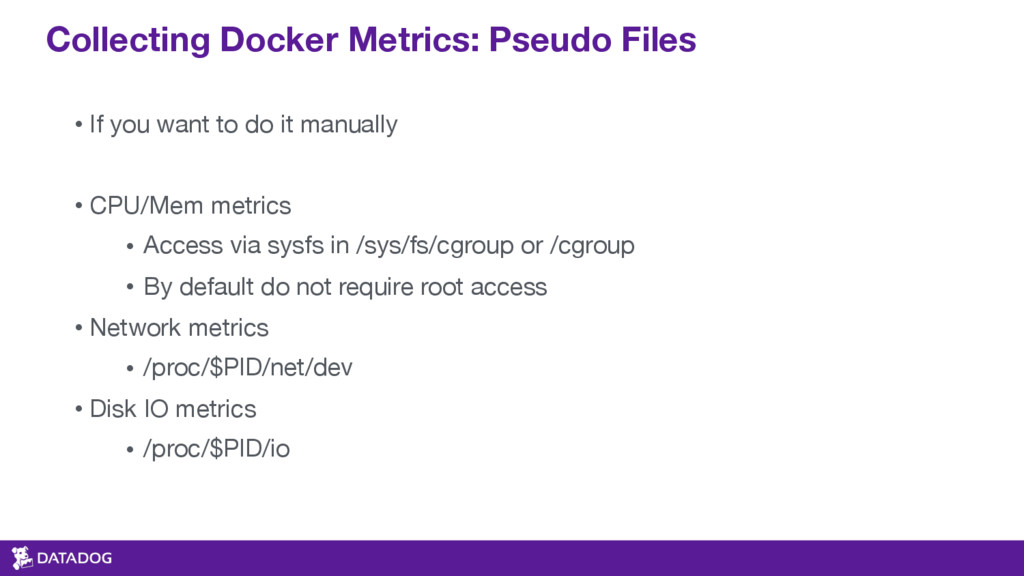
do it manually • CPU/Mem metrics • Access via sysfs in /sys/fs/cgroup or /cgroup • By default do not require root access • Network metrics • /proc/$PID/net/dev • Disk IO metrics • /proc/$PID/io