Upgrade to Pro — share decks privately, control downloads, hide ads and more …

Monitoring 101 — How To Monitor at Scale

Monitoring 101 — How To Monitor at Scale

Short introduction to the key concepts of monitoring at scale.
Lightning talk for dotScale 2016. http://dotscale.io

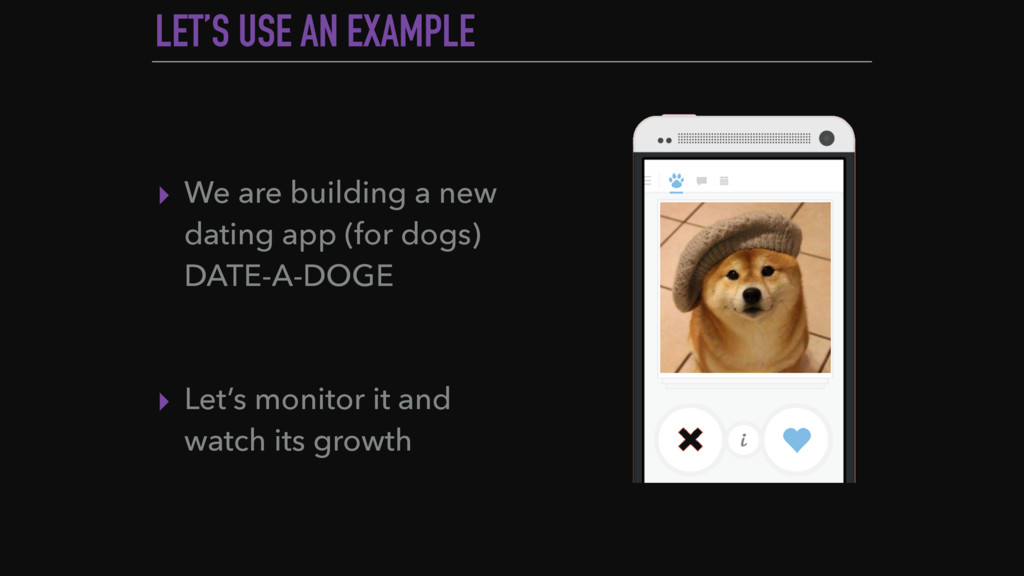
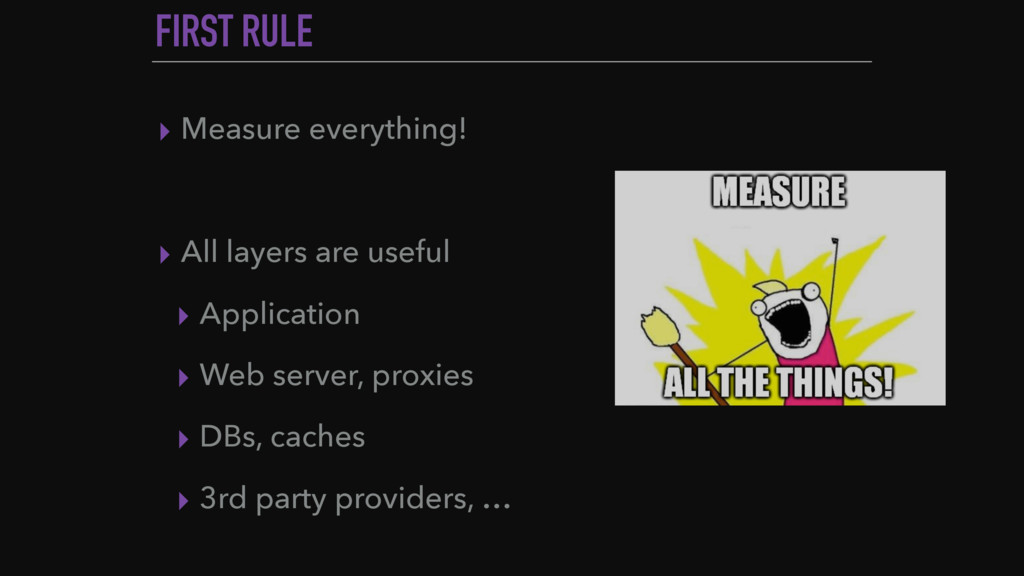
System monitoring is a wide topic, with hundred ways of doing it and tons of metrics to look at. Look at a growing web-application to illustrate the important monitoring concepts. Present what to look at first, how to exploit the data and what are the good practices at large scale.

Benjamin Fernandes

April 25, 2016
Tweet

More Decks by Benjamin Fernandes

Other Decks in Technology

Transcript

  1. LET’S USE AN EXAMPLE ▸ We are building a new

    dating app (for dogs)
 DATE-A-DOGE ▸ Let’s monitor it and watch its growth
  2. FIRST RULE ▸ Measure everything! ▸ All layers are useful

    ▸ Application ▸ Web server, proxies ▸ DBs, caches ▸ 3rd party providers, …
  3. WATCH YOUR WORK METRICS FIRST ▸ Top-level health of your

    system by measuring its useful output ▸ Throughput ▸ Success ▸ Error ▸ Performance
  4. A FEW EXAMPLES ▸ web.latency ▸ web.errors ▸ api.calls ▸

    downloads ▸ dog.swipes ▸ system.load ▸ disk.used ▸ db.queries ▸ cache.latency ▸ net.sent ▸ new release ▸ commits ▸ 3rd party down ▸ tweets WORK RESOURCE EVENTS
  5. ALERTS BEFORE IT IS TOO LATE ▸ Create alerts on

    key metrics ▸ Do it on work metrics first ▸ Record, notify or page depending on the severity
  6. USE TAGS, EVERYWHERE ▸ Graph and alert on tags ▸

    To scope and to aggregate ▸ Web latency per region < 50 ms on prod
  7. TAG WITH ANYTHING USEFUL ▸ Service ▸ Version ▸ Environment

    ▸ User ID ▸ API endpoint ▸ Dog breed
  8. METRIC CARDINALITY ▸ Don’t get lost ▸ Keep using tags,

    everywhere ▸ Stay focus on work metrics ▸ Monitoring gets sharper with experience
  9. METRIC AGGREGATION ▸ Watch min/avg/max ▸ Watch percentiles and outliers

    ▸ How fast is my app for the 95th percentile?