Upgrade to Pro — share decks privately, control downloads, hide ads and more …

Building a social network analysis dashboard w...

Sponsored · Your Podcast. Everywhere. Effortlessly. Share. Educate. Inspire. Entertain. You do you. We'll handle the rest.

Building a social network analysis dashboard with python

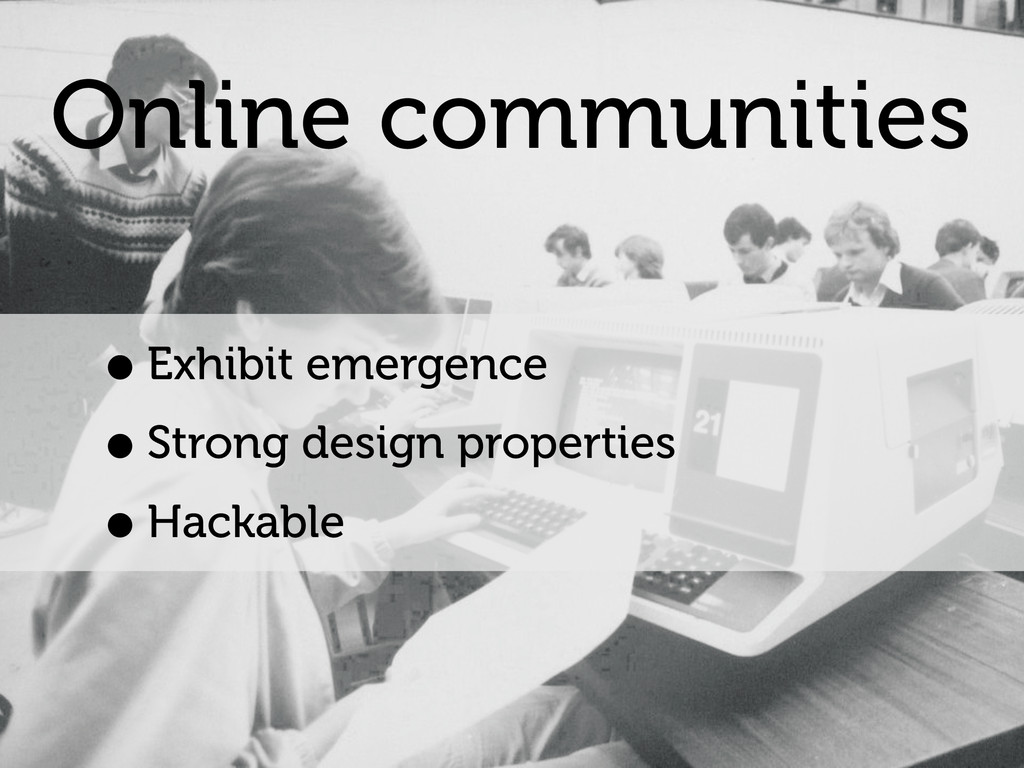
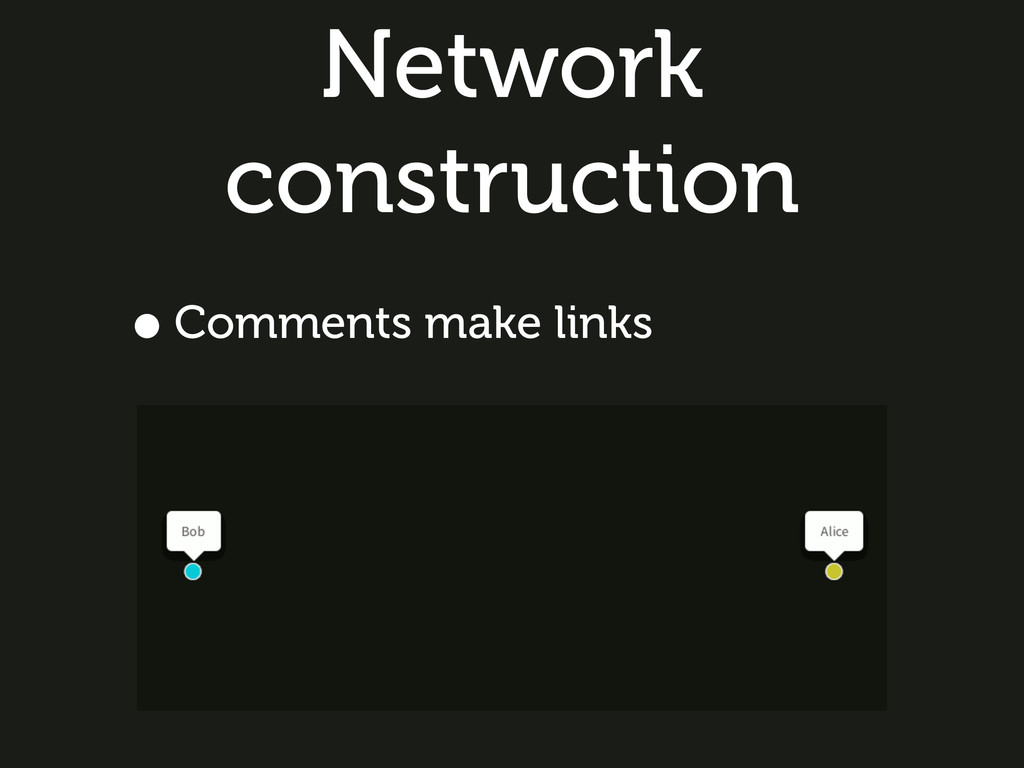
Every conversation has a structure. The network formed by the persons who interact in the conversations inside an online community can thus be analysed with the tools of the network science to understand their characteristics. Enriching online conversations with social network analysis we hope to be able to give community moderators tools that could help them to build better communities and guide the collective intelligence processes inside them. The great vision in this is to be able to contribute to building the engines that could help us to build effective platforms for participatory democracy

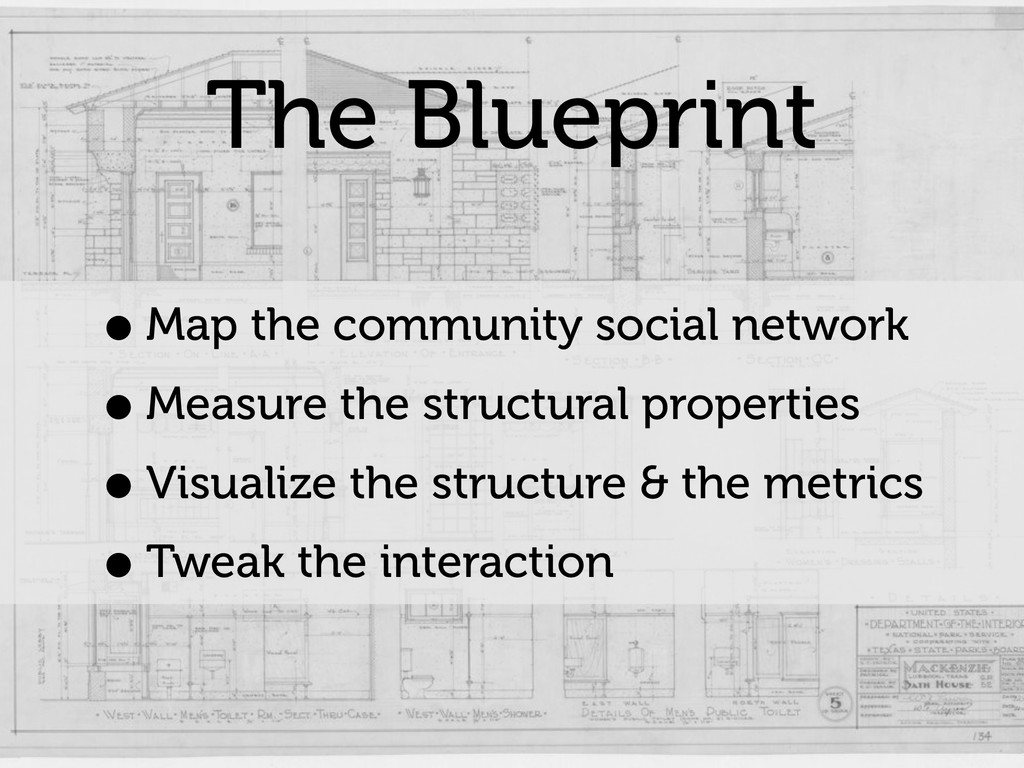
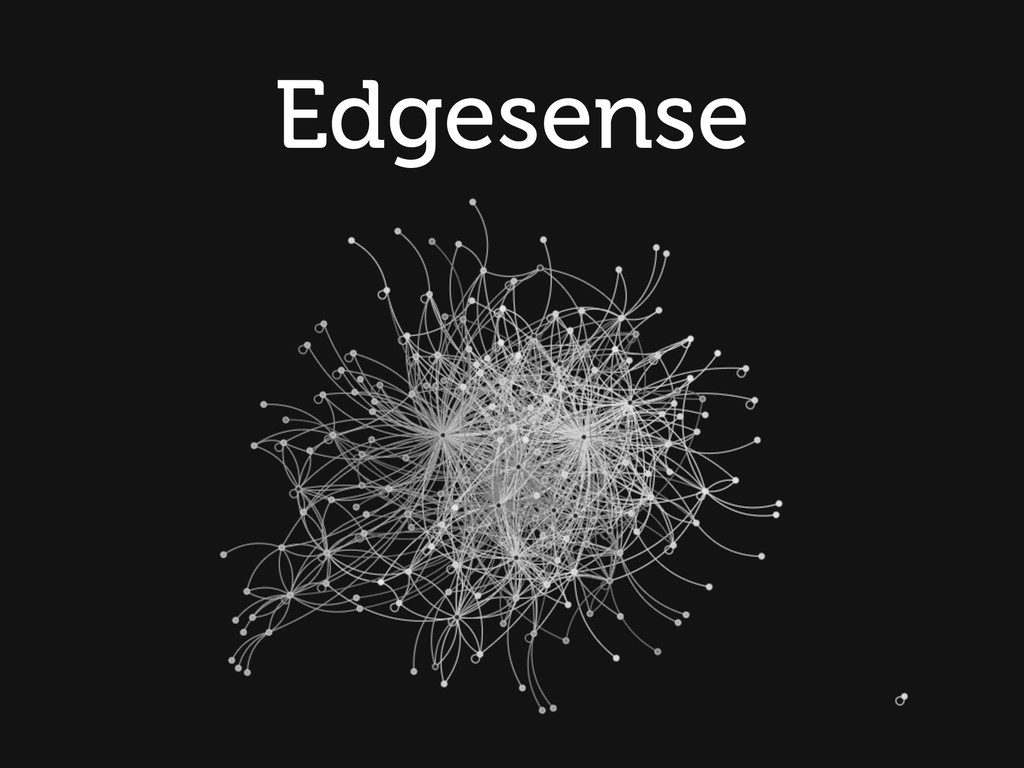
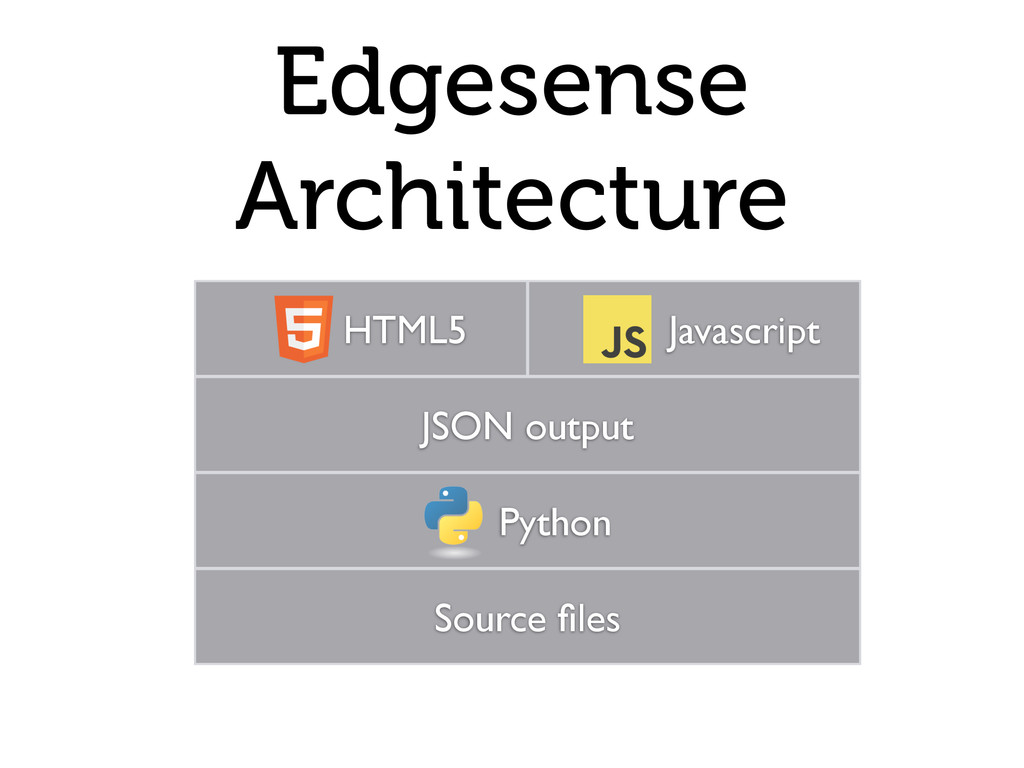
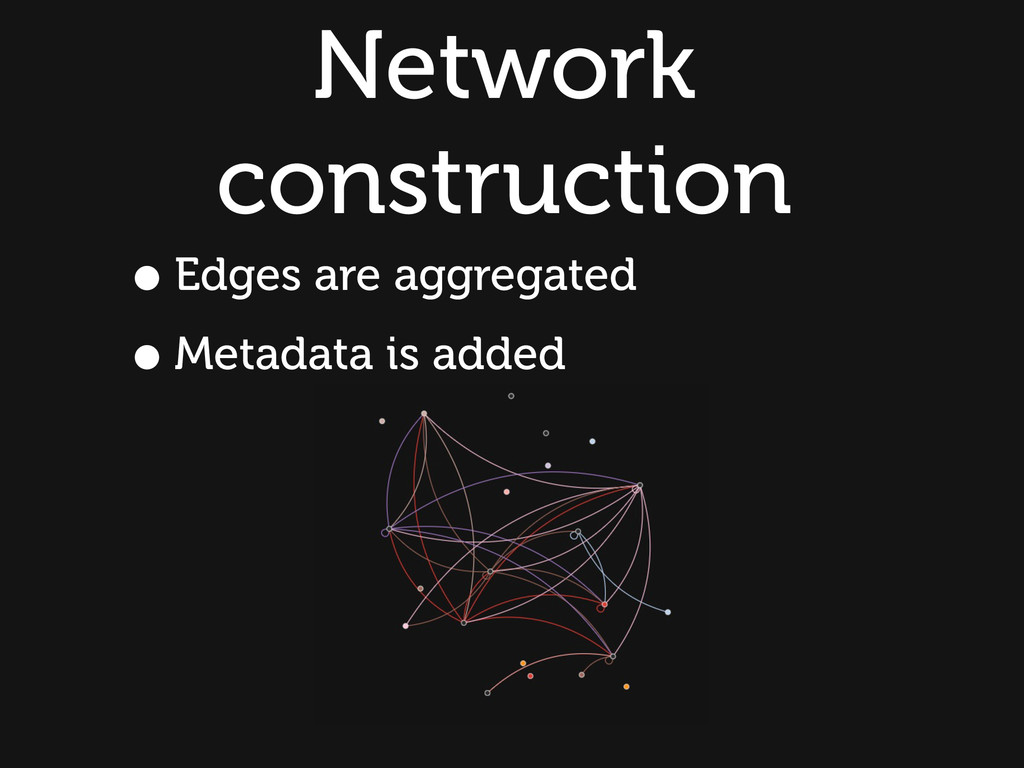
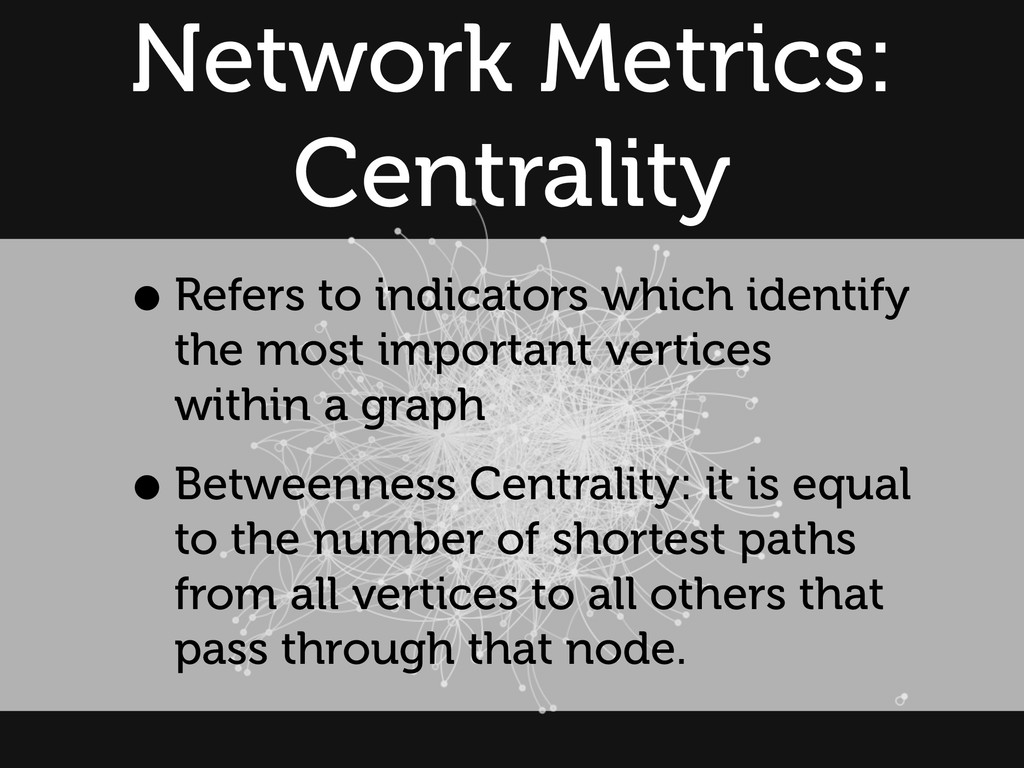
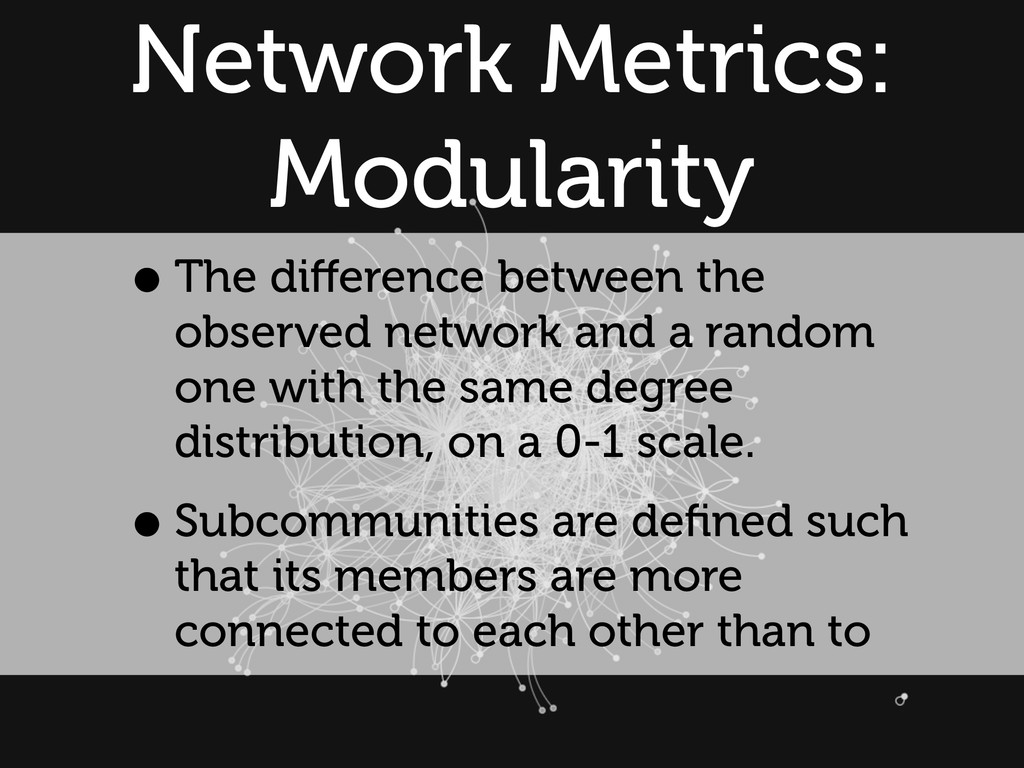
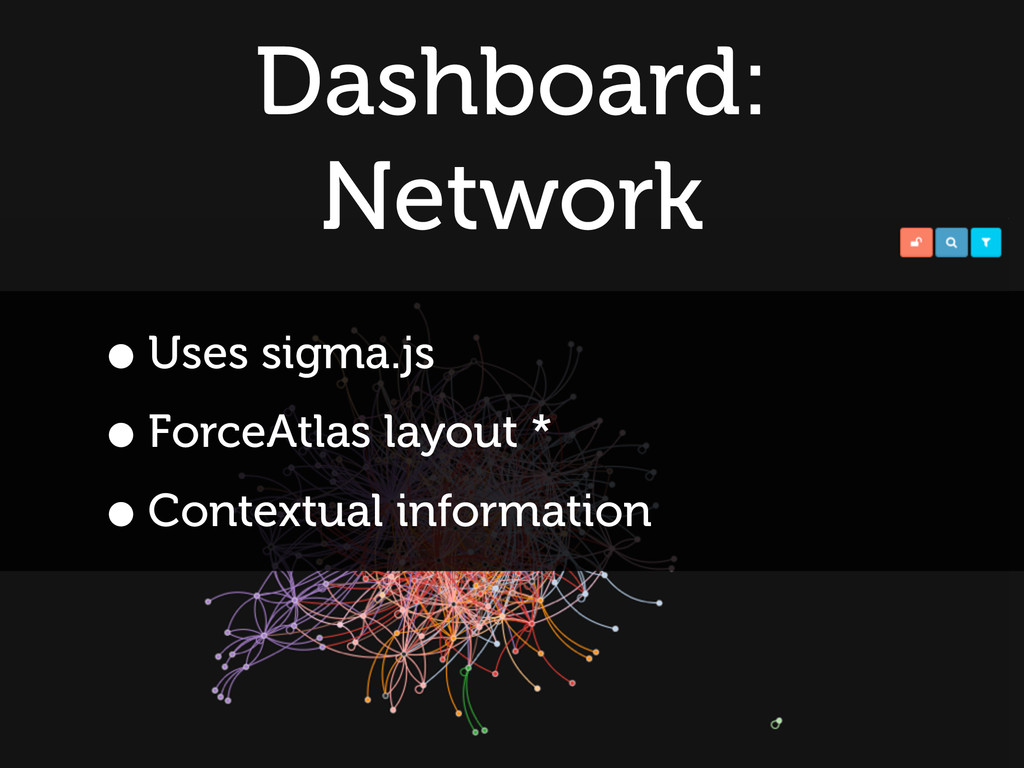
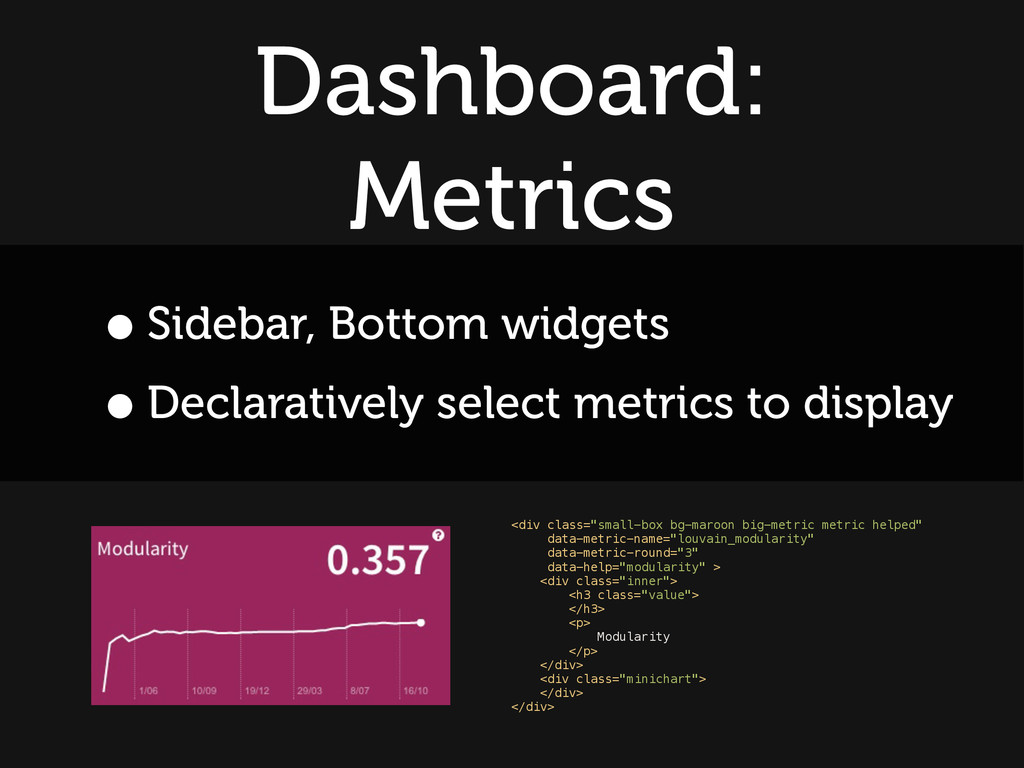
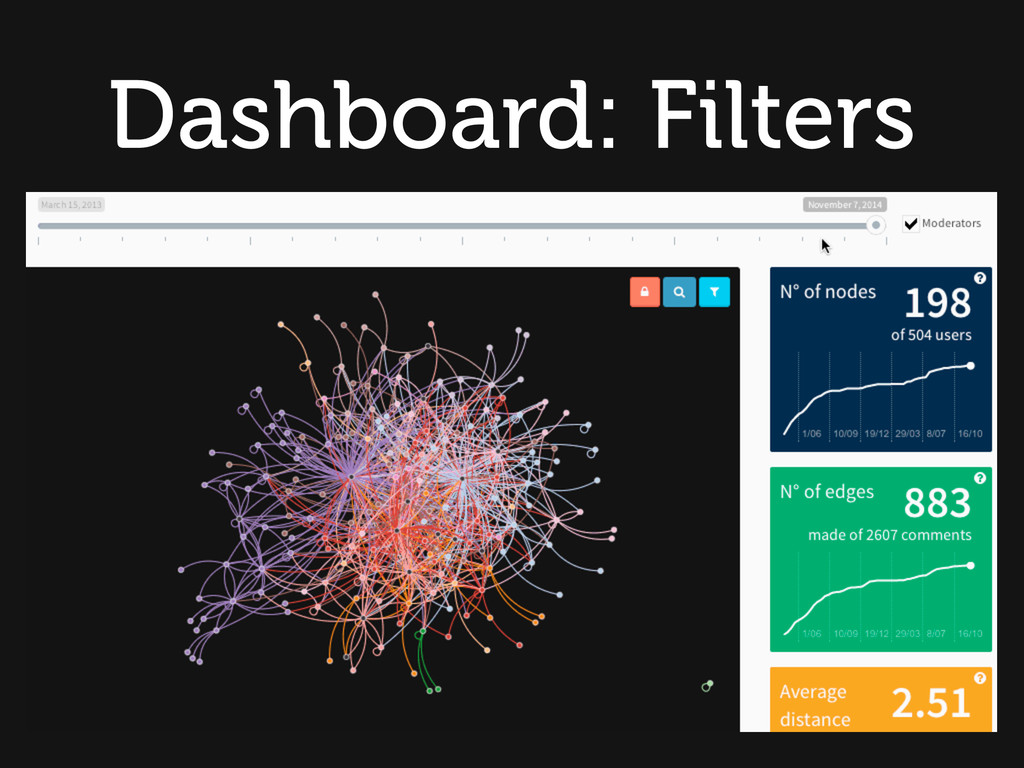
This is our attempt at making tools for social network analysis accessible to all those that could gain the most from them but maybe did not yet know their potential. Edgesense is built around a set of scripts that process the community data and extract the most relevant network metrics and the network structure and a dashboard that is able to present them giving a clear view of them. Through the dashboard community managers can for the first time see in a glimpse who is talking to who, which users are central to the community and those who are on the periphery. They can see which sub-communities are developing inside the larger online conversation and who is acting as a bridge between them.This is very useful to guide the conversation or to determine which users have the most authority (through measures of centrality or “pagerank")

Avatar for Luca Mearelli

Luca Mearelli

April 25, 2015

Other Decks in Technology

Transcript

  1. Emergence larger entities, patterns, and regularities arise through interactions among

    smaller or simpler entities that themselves do not exhibit such properties
  2. The Blueprint •Map the community social network •Measure the structural

    properties •Visualize the structure & the metrics •Tweak the interaction
  3. Edgesense Parsing Pipeline • Parse source files • Build network

    from interactions • Extract metrics • Export network + metrics to JSON files
  4. # Load the files allusers, allnodes, allcomments = load_files( ...

    ) # extract a normalized set of data nodes_map, posts_map, comments_map = eu.extract.normalized_data( ... ) # this is the network object network = {} # Add some file metadata network['meta'] = {} # Timestamp of the file generation (to show in the dashboard) network['meta']['generated'] = int(generated.strftime("%s")) # Extract the edges network['edges'] = extract_edges(nodes_map, comments_map) # Filter out nodes that have not participated to the full:conversations inactive_nodes = [ v for v in nodes_map.values() if not v['active'] ] network['nodes'] = [ v for v in nodes_map.values() if v['active'] ] # Compute the metricss directed_multiedge_network = calculate_network_metrics( ... ) # Write the results to JS eu.resource.write_network( ... ) Parse & Compute
  5. Network construction # build a mapping of nodes (users) keyed

    on their id nodes_map = {} for user in allusers: if not nodes_map.has_key(user['uid']): user_data = {} user_data['id'] = user['uid'] if user.has_key(node_title_field): user_data['name'] = user[node_title_field] else: user_data['name'] = "User %(uid)s" % user # timestamps user_data['created_ts'] = int(user['created']) # team membership user_data['team'] = is_team(user, admin_roles) user_data['active'] = False user_data['isolated'] = False nodes_map[user['uid']] = user_data else: logging.error("User %(uid)s was alredy added to the map (??)" % user)
  6. Network construction def extract_edges(nodes_map, comments_map): # build the list of

    edges edges_list = [] # a comment is 'valid' if it has a recipient and an author valid_comments = [e for e in comments_map.values() if e.get('recipient_id', None) and e.get('author_id', None)] logging.info("%(v)i valid comments on %(t)i total" % {'v':len(valid_comments), 't':len(comments_map.values())}) # build the whole network to use for metrics for comment in valid_comments: link = { 'id': "{0}_{1}_{2}".format(comment['author_id'],comment['recipient_id'],comment['created_ts']), 'source': comment['author_id'], 'target': comment['recipient_id'], 'ts': comment['created_ts'], 'effort': comment['length'], 'team': comment['team'] } if nodes_map.has_key(comment['author_id']): nodes_map[comment['author_id']]['active'] = True else: logging.info("error: node %(n)s was linked but not found in the nodes_map" % {'n':comment['author_id']}) if nodes_map.has_key(comment['recipient_id']): nodes_map[comment['recipient_id']]['active'] = True else: logging.info("error: node %(n)s was linked but not found in the nodes_map" % {'n':comment['recipient_id']}) edges_list.append(link) return sorted(edges_list, key=eu.sort_by('ts'))
  7. Network construction import networkx as nx def build_network(network): MDG=nx.MultiDiGraph() for

    node in network['nodes']: MDG.add_node(node['id'], node) for edge in network['edges']: MDG.add_edge(edge['source'], edge['target'], attr_dict=edge) set_isolated(network['nodes'], MDG) return MDG
  8. Network construction def extract_dpsg(mdg, ts, team=True): dg=nx.DiGraph() # add all

    the nodes present at the time ts for node in mdg.nodes_iter(): if mdg.node[node]['created_ts'] <= ts and (team or not mdg.node[node]['team']): dg.add_node(node, mdg.node[node]) for node in mdg.nodes_iter(): for neighbour in mdg[node].keys(): count = sum( 1 for e in mdg[node][neighbour].values() \ if e['ts'] <= ts and (team or not e['team'])) effort = sum( e['effort'] for e in mdg[node][neighbour].values() \ if e['ts'] <= ts and (team or not e['team'])) team_edge = sum( 1 for e in mdg[node][neighbour].values() \ if e['ts'] <= ts and e['team'])>0 if count > 0 and (team or not team_edge): dg.add_edge(node, neighbour, \ { 'source': node, \ 'target': neighbour, \ 'effort': effort, \ 'count': count, \ 'team': team_edge}) return dg
  9. Network Metrics Degree idgr = dsg.in_degree() # in_degree float(sum(idgr.values()))/float(len(idgr.values())) #

    avg_in_degree odgr = dsg.out_degree() # out_degree float(sum(odgr.values()))/float(len(odgr.values())) # avg_out_degree dgr = dsg.degree() # degree float(sum(dgr.values()))/float(len(dgr.values())) # avg_degree cdgr = dsg.degree(weight='count') # degree_count float(sum(cdgr.values()))/float(len(cdgr.values())) # avg_degree_count dgre = dsg.degree(weight='effort') # degree_effort float(sum(dgre.values()))/float(len(dgre.values())) # avg_degree_effort
  10. Network Metrics: Distance •The average number of hops needed to

    go from a randomly chosen node to another. •A lower distance implies that information spreads more easily across the network.
  11. Network Metrics Distance usg = dsg.to_undirected() connected_components = nx.connected_component_subgraphs(usg) shortest_paths

    = [ nx.average_shortest_path_length(g) \ for g in connected_components \ if g.size()>1 ] max_avg_distance = max(shortest_paths)
  12. Network Metrics: Centrality •Refers to indicators which identify the most

    important vertices within a graph •Betweenness Centrality: it is equal to the number of shortest paths from all vertices to all others that pass through that node.
  13. Network Metrics Centrality btw = nx.betweenness_centrality(dsg) # betweenness float(sum(btw.values()))/float(len(btw.values())) #

    avg_betweenness btwc = nx.betweenness_centrality(dsg, weight='count') # betweenness_count float(sum(btwc.values()))/float(len(btwc.values())) # avg_betweenness_count btwe = nx.betweenness_centrality(dsg, weight='effort') # betweenness_effort float(btwe.values()))/float(len(btwe.values())) # avg_betweenness_effort
  14. Network Metrics: Modularity •The difference between the observed network and

    a random one with the same degree distribution, on a 0-1 scale. •Subcommunities are defined such that its members are more connected to each other than to
  15. Network Metrics Modularity import community as co community = {}

    usg = g.copy() isolated = nx.isolates(usg) usg.remove_nodes_from(isolated) dendo = co.generate_dendrogram(usg) if len(dendo)>0 and isinstance(dendo, list): partition = co.partition_at_level(dendo, len(dendo) - 1) modularity = co.modularity(partition, usg)
  16. Exported Format { "edges": [ { "effort": 4, "id": "2_1_1315491000",

    "source": "2", "target": "1", "team": false, "ts": 1315491000 }, ... ], "meta": { "generated": 1415788633 }, "metrics": [ { "ts": 1315491000, ... } ], "nodes": [ { "active": true, "created_on": "2011-09-08", "created_ts": 1315483000, "id": "1", "isolated": false, "name": "Alice", "team": true, "team_on": "2011-09-08", "team_ts": 1315483000 }, {...} ] }
  17. Dashboard: Metrics •Sidebar, Bottom widgets •Declaratively select metrics to display

    <div class="small-box bg-maroon big-metric metric helped" data-metric-name="louvain_modularity" data-metric-round="3" data-help="modularity" > <div class="inner"> <h3 class="value"> </h3> <p> Modularity </p> </div> <div class="minichart"> </div> </div>