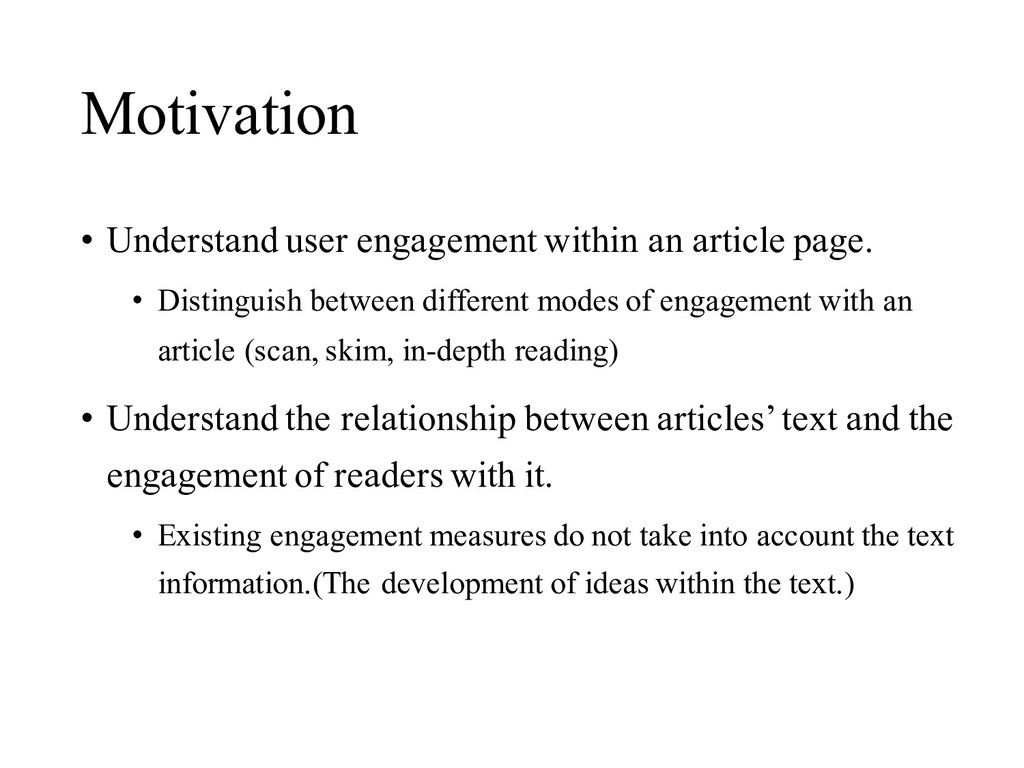
Distinguish between different modes of engagement with an article (scan, skim, in-depth reading) • Understand the relationship between articles’text and the engagement of readers with it. • Existing engagement measures do not take into account the text information.(The development of ideas within the text.)
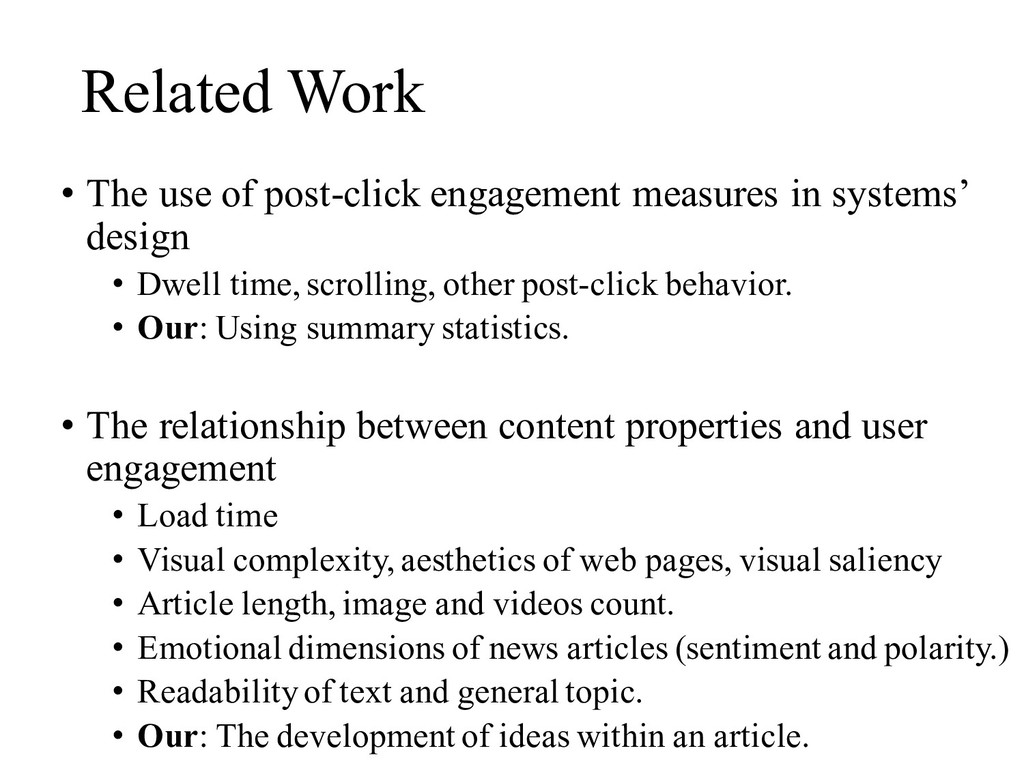
systems’ design • Dwell time, scrolling, other post-click behavior. • Our: Using summary statistics. • The relationship between content properties and user engagement • Load time • Visual complexity, aesthetics of web pages, visual saliency • Article length, image and videos count. • Emotional dimensions of news articles (sentiment and polarity.) • Readability of text and general topic. • Our: The development of ideas within an article.
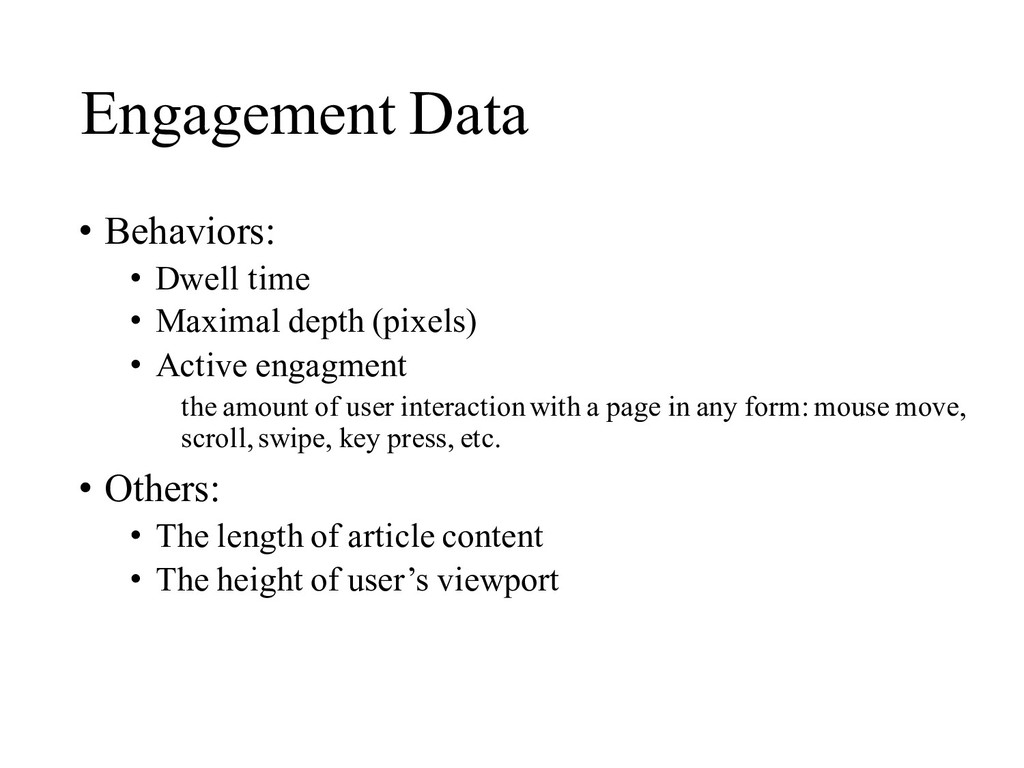
(pixels) • Active engagment the amount of user interactionwith a page in any form: mouse move, scroll, swipe, key press, etc. • Others: • The length of article content • The height of user’s viewport
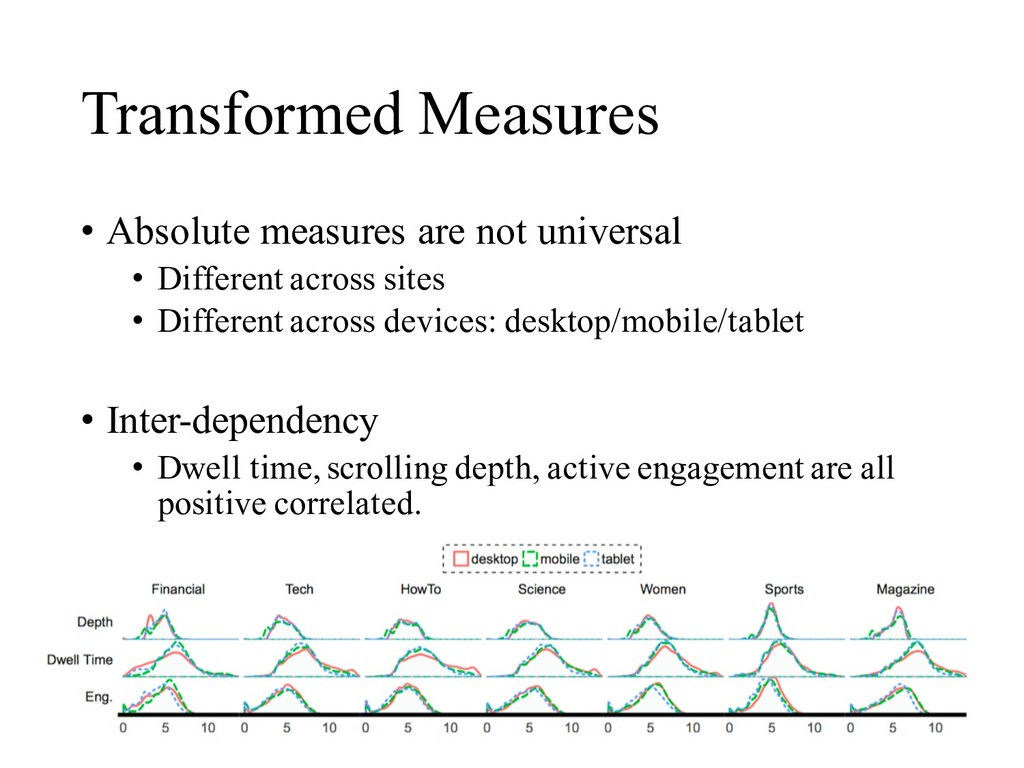
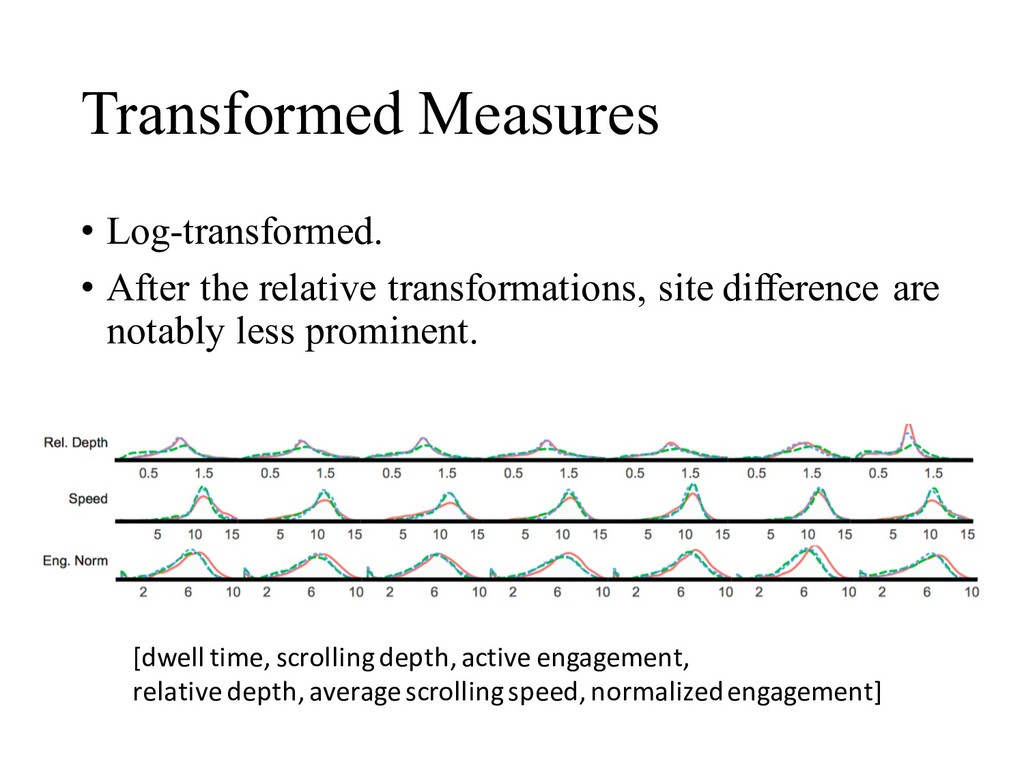
across sites • Different across devices: desktop/mobile/tablet • Inter-dependency • Dwell time, scrolling depth, active engagement are all positive correlated.
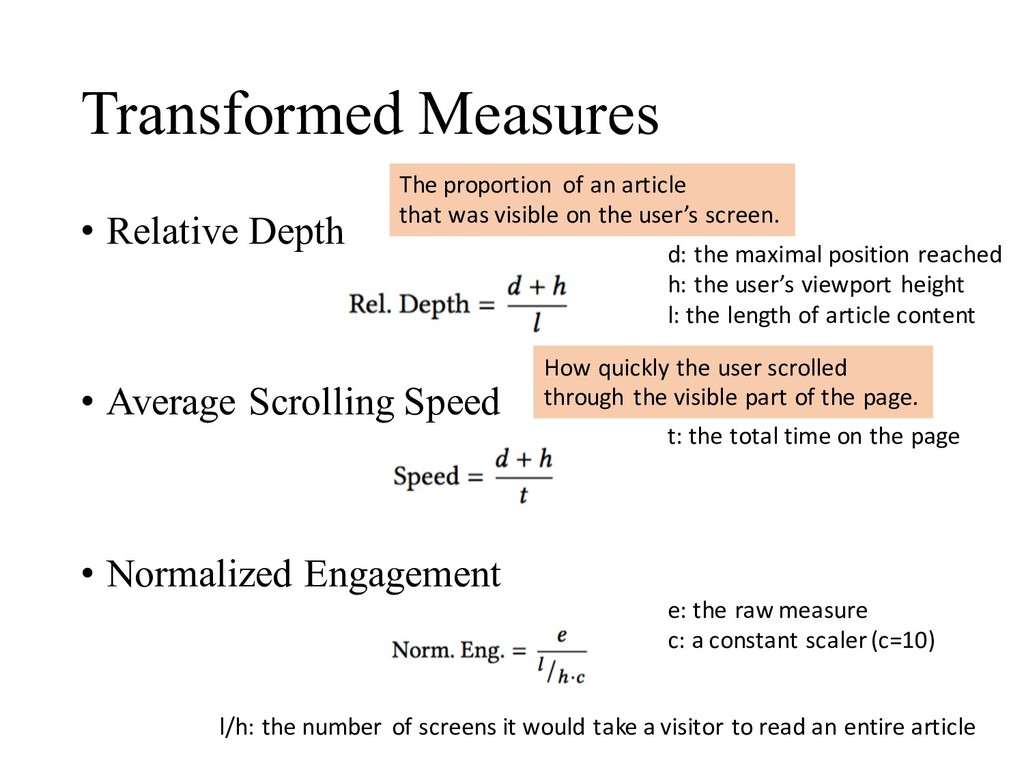
Normalized Engagement d: the maximal position reached h: the user’s viewport height l: the length of article content t: the total time on the page e: the raw measure c: a constant scaler (c=10) l/h: the number of screens it would take a visitor to read an entire article The proportion of an article that was visible on the user’s screen. How quickly the user scrolled through the visible part of the page.
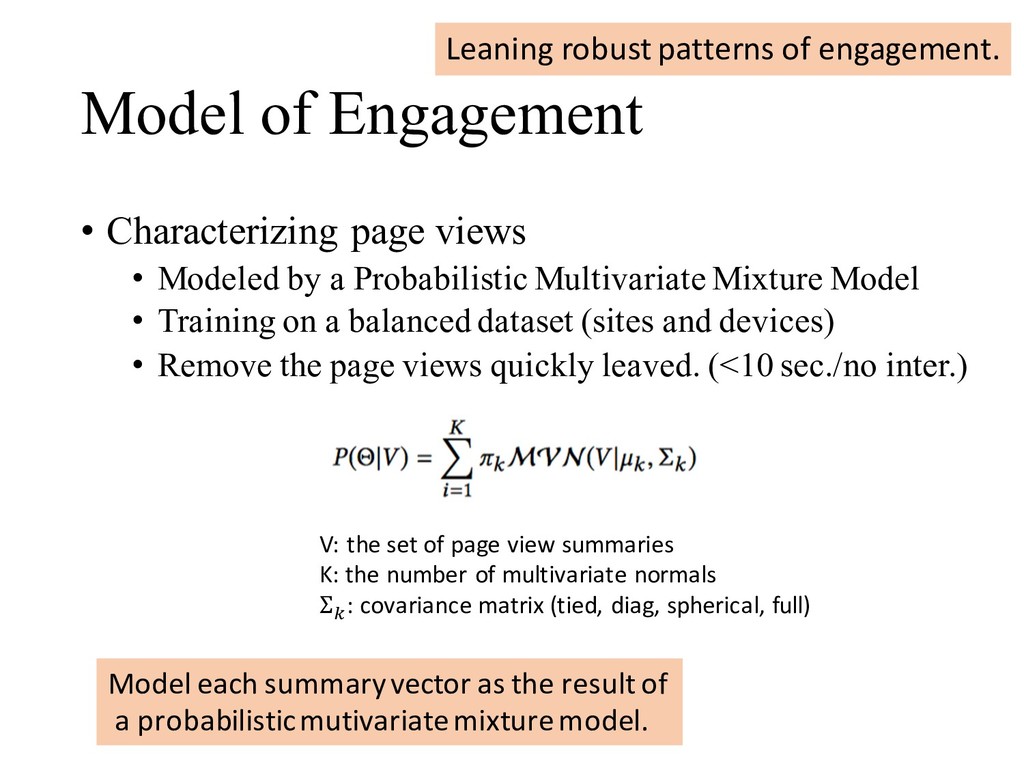
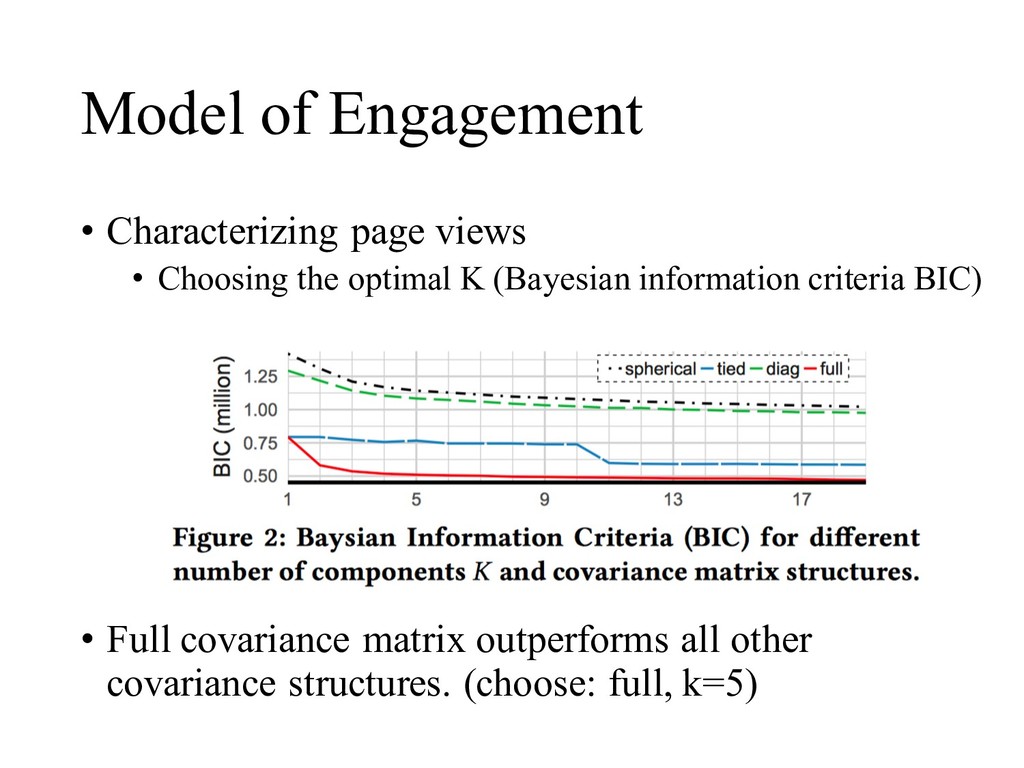
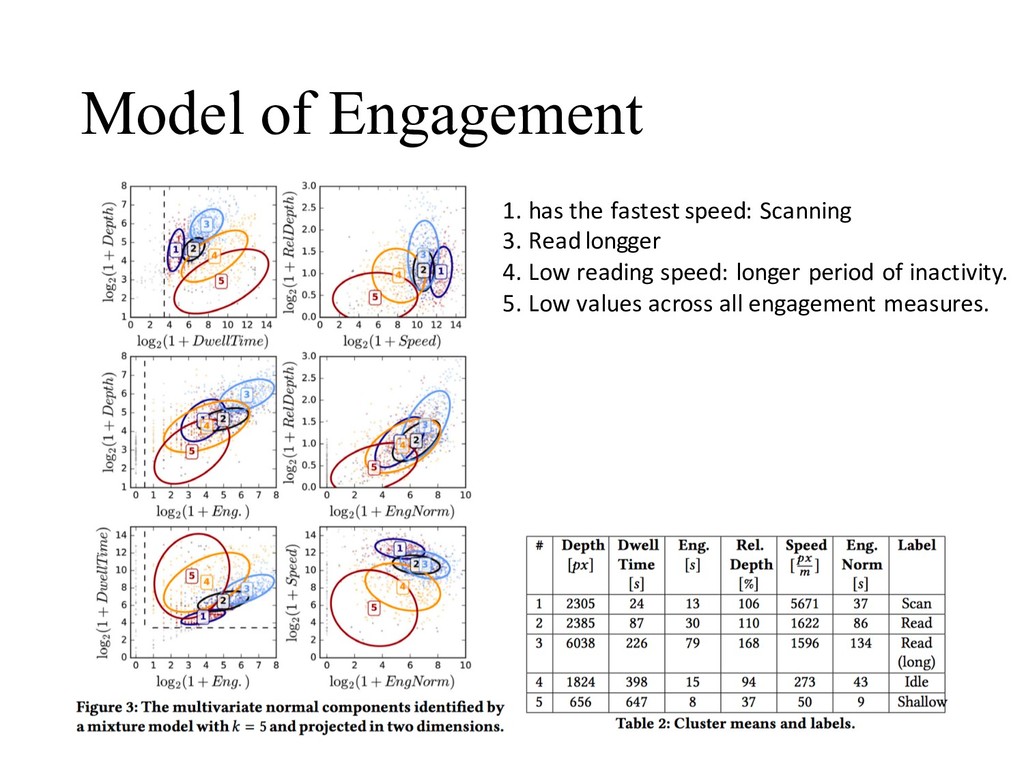
a Probabilistic Multivariate Mixture Model • Training on a balanced dataset (sites and devices) • Remove the page views quickly leaved. (<10 sec./no inter.) V: the set of page view summaries K: the number of multivariate normals Σ" : covariance matrix (tied, diag, spherical, full) Leaning robust patterns of engagement. Model each summaryvector as the result of a probabilisticmutivariatemixturemodel.
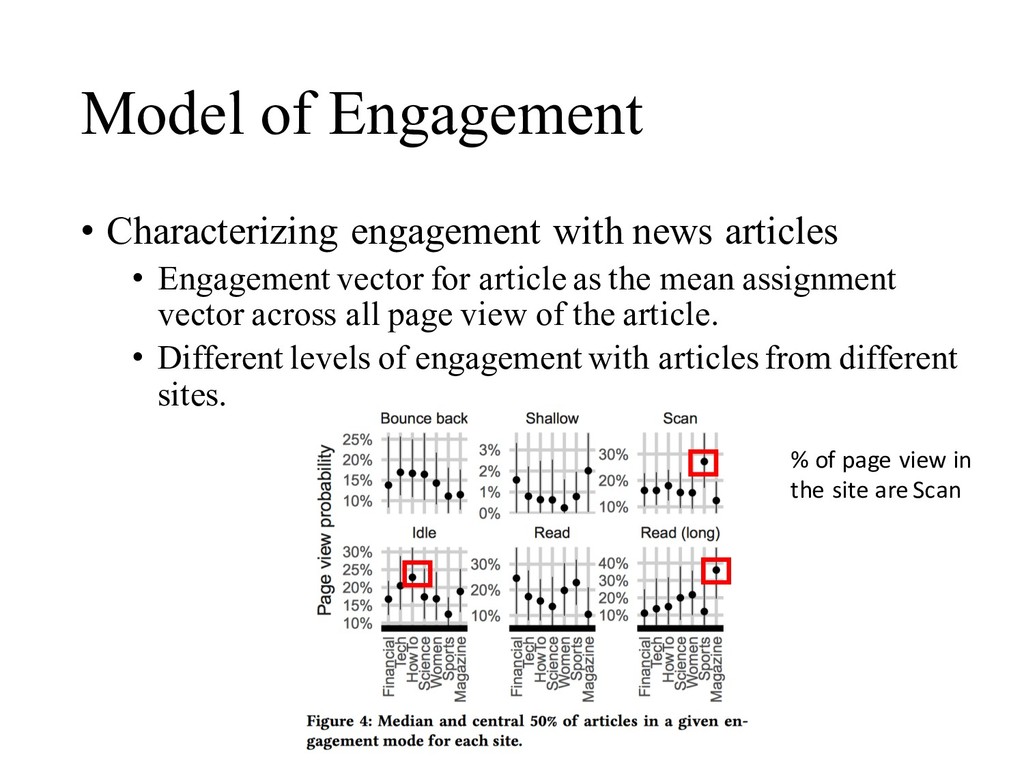
Engagement vector for article as the mean assignment vector across all page view of the article. • Different levels of engagement with articles from different sites. % of page view in the site are Scan
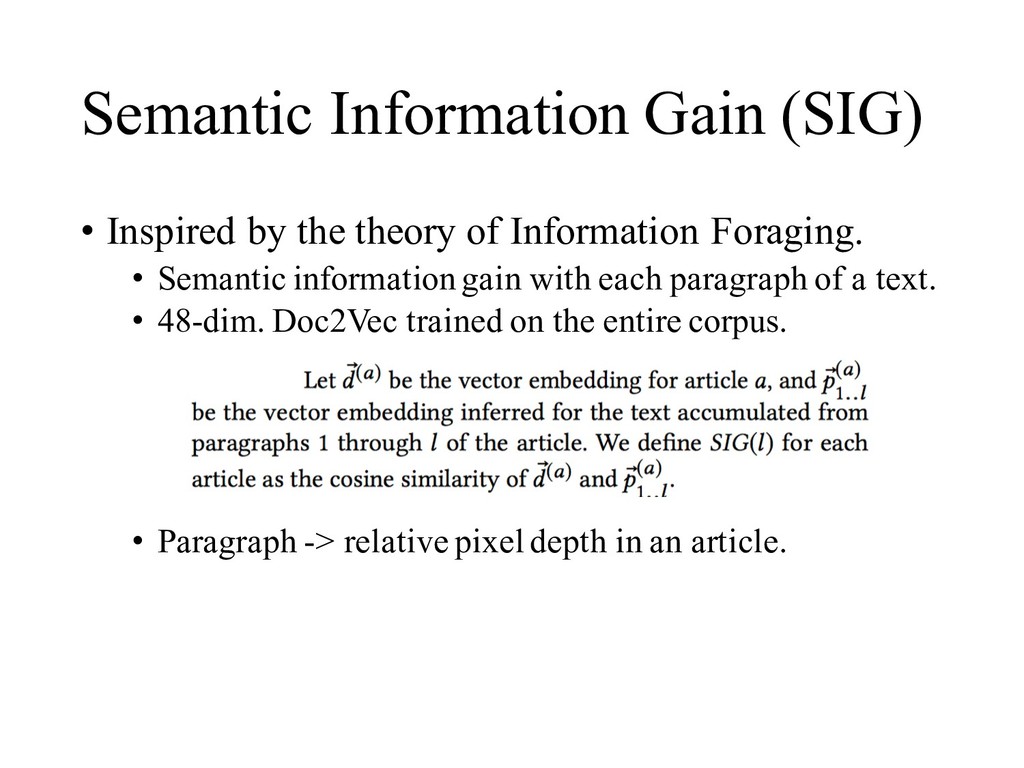
Information Foraging. • Semantic information gain with each paragraph of a text. • 48-dim. Doc2Vec trained on the entire corpus. • Paragraph -> relative pixel depth in an article.
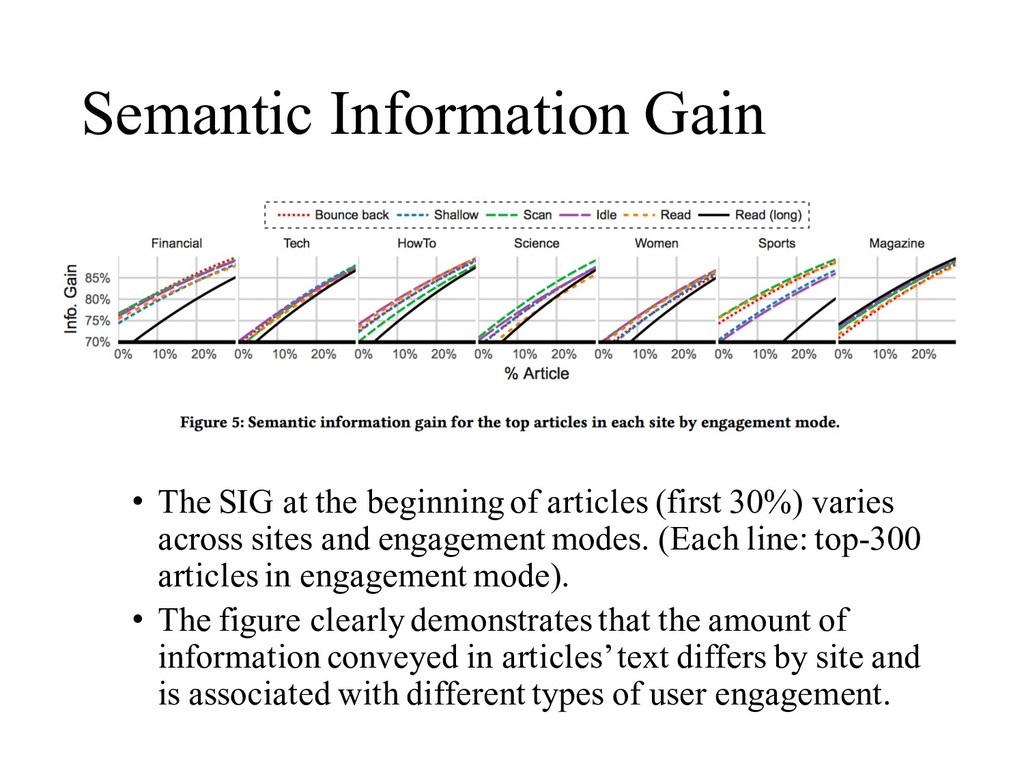
articles (first 30%) varies across sites and engagement modes. (Each line: top-300 articles in engagement mode). • The figure clearly demonstrates that the amount of information conveyed in articles’ text differs by site and is associated with different types of user engagement.
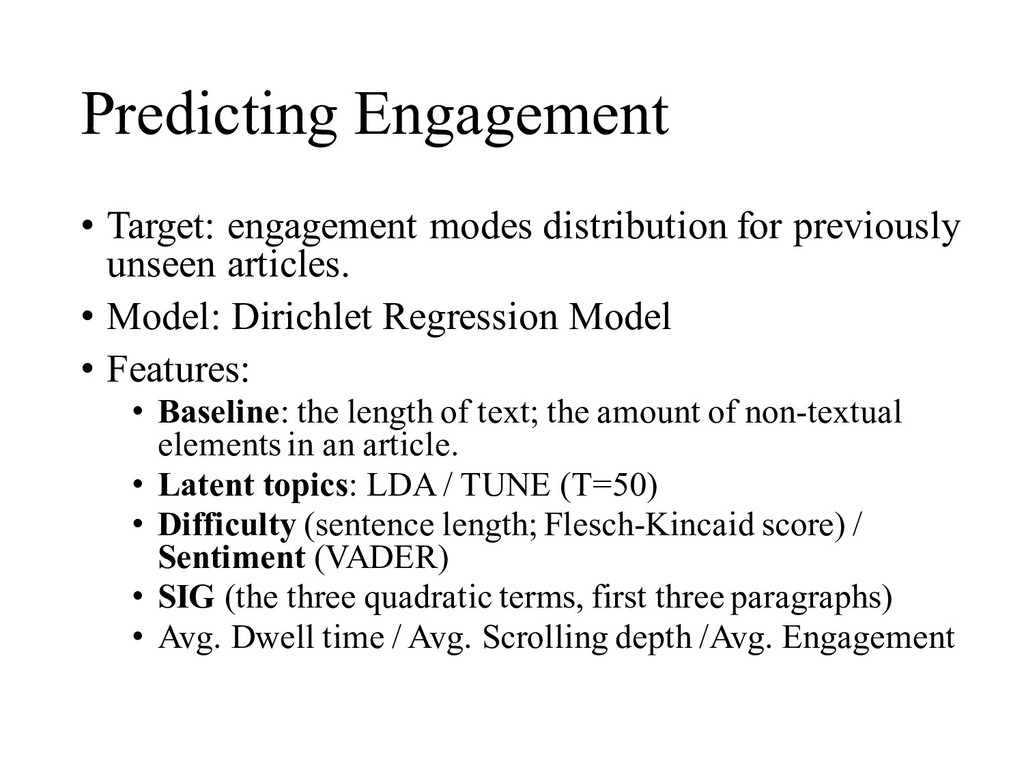
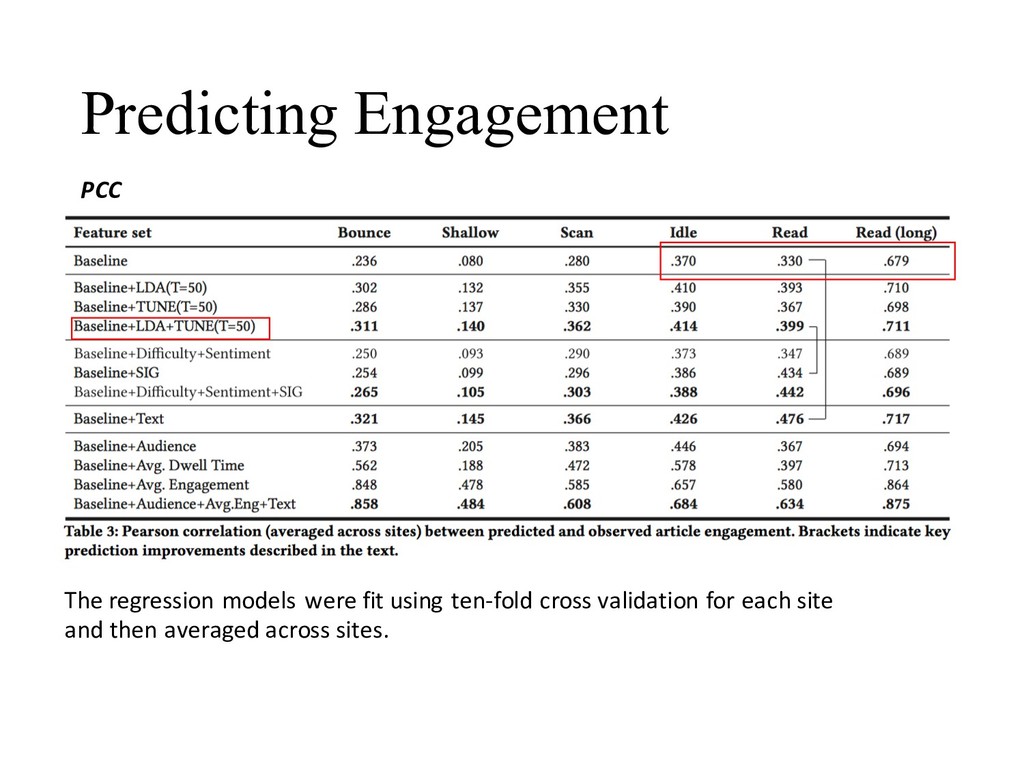
articles. • Model: Dirichlet Regression Model • Features: • Baseline: the length of text; the amount of non-textual elements in an article. • Latent topics: LDA / TUNE (T=50) • Difficulty (sentence length; Flesch-Kincaid score) / Sentiment (VADER) • SIG (the three quadratic terms, first three paragraphs) • Avg. Dwell time / Avg. Scrolling depth /Avg. Engagement
valuable information about post-click user engagement with a news article. • A novel measure of information gain within the text of news articles. • Empirical evidence linking information gain in text to user engagement as observed in a diversity of news sites, at large scale, and outside lab settings.


 satomasahiro2005
 gionn
 takonda
 sansantech
 taketakekaho
 codmoninc
 y0hgi
 maimyyym
 4o1sobblue
 ishikawa_satoru
 terurou
 ivry_presentationmaterials
 garrettdimon
 tanoku
 bkeepers
 frankvandijk
 sergeychernyshev
 csswizardry
 colly
 watany
 inesmontani
 cassininazir
 keavy
 soudai