Upgrade to Pro — share decks privately, control downloads, hide ads and more …

Adopting ZGC in HBase for LINE Messaging

Adopting ZGC in HBase for LINE Messaging

イベント「JJUG CCC 2024 Spring」のセッション登壇した際の資料です。
https://ccc2024spring.java-users.jp/

LY Corporation Tech

June 16, 2024
Tweet

More Decks by LY Corporation Tech

Other Decks in Technology

Transcript

  1. Adopting ZGC in HBase for LINE Messaging LINEヤフー株式会社 Yoshida Shinya

    JJUG CCC 2024 Spring 2024/06/16 1 #jjug_ccc #jjug_ccc_b
  2. Yoshida Shinya • Working at LINEヤフー株式会社 after LINE株式会社 • LINEヤフー株式会社

    > PP開発グループ > サービスPF統括本部 > メッセージングPF開発本部 > メッセージングPF開発1部 > HBase Partチーム • Tech Lead / Team Lead (Not a manager role) • Love Java • JJUG Board Member • Contributed to OpenJDK (Project Lambda and jshell) in the past 3 #jjug_ccc #jjug_ccc_b
  3. Engineer at LINE Messaging Platform HBase Middleware Engineer Serverside Application

    Engineer DBA SRE Platform Engineer 4 #jjug_ccc #jjug_ccc_b
  4. Garbage Collection • Manage memory in applications behalf of developers

    • Dispose dead objects never be used in application • Mark: Find objects which is (not) linked from any object roots • Defragmentation of memory space • Make large objects allocatable • Copy (Compaction): Gather alive objects to sequential space and rid sparse spaces 6 #jjug_ccc #jjug_ccc_b
  5. Stop the world • Garbage Collection might stop application for

    • Soundness: GC never dispose any of alive objects • Completeness: GC must dispose all of dead objects (optional) • Copy object: Change address of objects • Reduce pause time by parallel and concurrent GC App threads GC threads App threads GC threads App threads GC threads STW STW STW Serial GC Prallel GC Concurrent GC 7 #jjug_ccc #jjug_ccc_b
  6. Throughput and Responsiveness • Parallel GC improves both of Throughput

    and Responsiveness • Concurrent GC has tradeoff between Throughput and Responsiveness • High Throughput • Shorter time to process N data • Larger N data that single node can handle • High Responsiveness • Shorter (controllable) pause time 8 Throughput Responsiveness #jjug_ccc #jjug_ccc_b
  7. Java GCs 10 Throughput Responsiveness ★Generational Serial GC ★Generational Parallel

    GC ★Epsilon GC ★CMS GC ★G1GC #jjug_ccc #jjug_ccc_b
  8. Java GCs • Epsilon GC (JEP 318) • Almost zero

    pause time • Highest throughput • Because... this doesn't collect any garbage at all • Mainly for testing, learning, short-living latency-sensitive app • OOME at the end 11 Throughput Responsiveness ★Generational Serial GC ★Generational Parallel GC ★Epsilon GC ★CMS GC ★G1GC #jjug_ccc #jjug_ccc_b
  9. Java GCs • Generational Serial/Parallel GC • 2 Young area,

    Survivor area, Old area • Full stop the world • Pause time scale by heap size • Full GC stops more than minutes for large scale • Throughput is highest in general 12 Throughput Responsiveness ★Generational Serial GC ★Generational Parallel GC ★Epsilon GC ★CMS GC ★G1GC #jjug_ccc #jjug_ccc_b
  10. Java GCs • CMS GC • Concurrent Mark-and-Sweep • Concurrent

    GC • Short pause time • Removed in Java 14 (JEP 363) • No defragmentation • Avoid copy (compaction) • FullGC or OOME for some workload 13 Throughput Responsiveness ★Generational Serial GC ★Generational Parallel GC ★Epsilon GC ★CMS GC ★G1GC #jjug_ccc #jjug_ccc_b
  11. Java GCs • G1GC • Generational • GC per region

    • Garbage First • Concurrent GC • Controllable pause time vs throughput tradeoff • But pause time scale by heap size 14 Throughput Responsiveness ★Generational Serial GC ★Generational Parallel GC ★Epsilon GC ★CMS GC ★G1GC #jjug_ccc #jjug_ccc_b
  12. HW Evolution • 2006 • 2024 引用: https://www.dell.com/downloads/jp/products/pedge/PE1950_0906_final.pdf (Retrieved 2021/01/30)

    https://japancatalog.dell.com/c/wp-content/uploads/PowerEdge_16G_brochure_240126.pdf 16 #jjug_ccc #jjug_ccc_b
  13. ZGC New generation Production ready from Java15 STW: Stop The

    World, JVM Pause Time Low latency STW<=1ms Scalable Up to TB scale Throughput reduction 15% 17 #jjug_ccc #jjug_ccc_b
  14. App thread GC thread STW ≦1ms STW ≦1ms STW ≦10ms

    Mark start Conc mark Mark end Prepare for reloc Reloc start Conc reloc Conc remap STW ≦1ms 19 #jjug_ccc #jjug_ccc_b ZGC cycle
  15. App thread GC thread STW ≦1ms STW ≦1ms STW ≦10ms

    STW ≦1ms Mark start Conc mark Mark end Prepare for reloc Reloc start Conc reloc Conc remap 20 #jjug_ccc #jjug_ccc_b ZGC cycle
  16. App thread GC thread STW ≦1ms STW ≦1ms STW ≦10ms

    STW ≦1ms Flip state Check mark end Clean up Flip state Assign tasks to workers Mark start Conc mark Mark end Prepare for reloc Reloc start Conc reloc Conc remap 21 #jjug_ccc #jjug_ccc_b ZGC cycle
  17. App thread GC thread STW ≦1ms STW ≦1ms STW ≦10ms

    STW ≦1ms Walk object graph Mark alive objects Choose relocation set Copy object to another page Walk object graph Update pointer to refer new location Mark start Conc mark Mark end Prepare for reloc Reloc start Conc reloc Conc remap 22 #jjug_ccc #jjug_ccc_b ZGC cycle
  18. App thread GC thread STW ≦1ms STW ≦1ms STW ≦10ms

    STW ≦1ms Walk object graph Mark alive objects Choose relocation set Copy object to another page Walk object graph Update pointer to refer new location Mark start Conc mark Mark end Prepare for reloc Reloc start Conc reloc Conc remap 23 #jjug_ccc #jjug_ccc_b ZGC cycle
  19. App thread GC thread STW ≦1ms STW ≦1ms STW ≦1ms

    Mark start Conc remap &mark Mark end Reloc start STW ≦1ms Conc remap &mark Mark start GC(N) GC(N+1 GC(N-1) Prepare for reloc Conc reloc 24 #jjug_ccc #jjug_ccc_b ZGC cycle
  20. Concurrent Relocation • Object a = O.field; • a must

    be pointer to A' • If it's A, it's inconsistent 25 A A’ O A A’ GC copied A to A' O.field #jjug_ccc #jjug_ccc_b
  21. Load barrier Object o = O.field; <load barrier for O.field>

    // Use o • App threads handle GC tasks depends on pointer address • Mark: not-marked ⇒ mark • Relocate/remap: not-relocated/remapped ⇒ relocate/remap 26 #jjug_ccc #jjug_ccc_b
  22. Colored Pointer • Pointer state is represented as flag in

    the address bits • Rotate bit for Marked for each GC cycle (Marked0/1) • Use Virtual Memory Map 27 Unused(16 bits) Object Address (44 bits, Up to 16 TB) Remapped Finalizable Marked1 Marked0 Marked: Remapped: Real address: 0000 0000 0000 0000 0010 0010 1101 0110 … 1011 0100 0000 0000 0000 0000 0100 0010 1101 0110 … 1011 0100 0000 0000 0000 0000 0000 0010 1101 0110 … 1011 0100 #jjug_ccc #jjug_ccc_b
  23. Relocate and remap 28 O A A A’ O A

    A’ A A’ O A A’ Relocate Marked0(A) GC copied A to A' Forwarding A ⇒ A' Mark Remap Marked0(A) Remapped(A') in load barrier while relocate phase Marked1(A') while mark phase while next GC cycle Forwarding A ⇒ A' #jjug_ccc #jjug_ccc_b
  24. When start ZGC cycle time Heap usage Slope: 1x 29

    #jjug_ccc #jjug_ccc_b GC(0) start GC(0) end GC(1) start GC(1) end X seconds X seconds
  25. When start ZGC cycle time Slope: 1x 30 #jjug_ccc #jjug_ccc_b

    Heap usage GC(0) start GC(0) end GC(1) start GC(1) end X seconds X seconds
  26. When start ZGC cycle time Traffic might be bursted Heap

    full before GC end Allocation stall 31 #jjug_ccc #jjug_ccc_b Heap usage GC(0) start GC(0) end GC(1) start GC(1) end X seconds X seconds
  27. When start ZGC cycle time Slope: 2x -XX:ZAllocationSpikeTolerance Default: 2

    32 #jjug_ccc #jjug_ccc_b Heap usage GC(0) start GC(0) end GC(1) start GC(1) end X seconds X seconds
  28. Setup ZGC // Increase virtual memory map count // N:

    higher than `1.8 * heap size / MB` // We specify `2 * RAM size` to cover any heap size # sysctl -w vm.max_map_count=<N> // Enable hugepages (optional) // N: higher than `heap size / 2MB` // We specify `(heap size + 2GB) / 2MB` # sysctl -w vm.nr_hugepages=<N> # mkdir /javaheap # mount -t hugetlbfs -o uid=<java_user> nodev /javaheap // Run Java application $ java -XX:+UseZGC -XX:+AlwaysPreTouch -XX:+UseLargePages -XX:AllocateHeapAt=/javaheap ... 34 #jjug_ccc #jjug_ccc_b
  29. PreTouch and Hugepages • ZGC w/o PreTouch requires memory allocation

    while app running • Performance impact when heap expansion • ZGC w/ PreTouch allocates memory for whole heap size before app starts • Need time to start up application • 56s to start app with 120~130GB scale heap • Hugepages minimize the start up time • Shorten to 5s • Linux kernel >= 4.7: transparent hugepages is available • https://wiki.openjdk.org/display/zgc#Main-EnablingTransparentHugePagesOnLinux 35 #jjug_ccc #jjug_ccc_b
  30. JVM Logs: Safepoint (Stop the World) [2023-10-23T17:48:08.863+0900][136166][info ][safepoint ] Safepoint

    "ZMarkStart", Time since last: 21246320750 ns, Reaching safepoint: 262204 ns, At safepoint: 179287 ns, Total: 441491 ns (0.4 ms) 37 #jjug_ccc #jjug_ccc_b
  31. ZGC Logs: Allocation Stall [2023-10-23T17:48:17.916+0900][136166][info ][gc ] Allocation Stall (RS-EventLoopGroup-1-5)

    214.945ms [2023-10-23T17:48:17.916+0900][136166][info ][gc ] Allocation Stall (RS-EventLoopGroup-1-28) 132.445ms [2023-10-23T17:48:17.916+0900][136166][info ][gc ] Allocation Stall (RS-EventLoopGroup-1-55) 240.809ms Pausing thread 38 #jjug_ccc #jjug_ccc_b
  32. ZGC Logs: Alloc&Director [2023-10-24T16:46:36.720+0900][50588][debug][gc,alloc ] Allocation Rate: 1690.0MB/s, Predicted: 1695.2MB/s,

    Avg: 1676.4(+/-13.3)MB/s [2023-10-24T16:46:36.720+0900][50588][debug][gc,director ] Select GC Workers (Normal), AvoidLongGCWorkers: 1.894, AvoidOOMGCWorkers: 3.701, LastGCWorkers: 4.000, GCWorkers: 3.701 [2023-10-24T16:46:36.720+0900][50588][debug][gc,director ] Rule: Allocation Rate (Dynamic GC Workers), MaxAllocRate: 3434.2MB/s (+/-0.8%), Free: 17724MB, GCCPUTime: 18.932, GCDuration: 4.738s, TimeUntilOOM: 5.120s, TimeUntilGC: 0.283s, GCWorkers: 4 -> 4 [2023-10-24T16:46:36.720+0900][50588][debug][gc,director ] Rule: High Usage, Free: 17724MB(55.8%) [2023-10-24T16:46:36.720+0900][50588][debug][gc,director ] Rule: Proactive, UsedUntilEnabled: 3150MB, TimeUntilEnabled: 299.981s Allocation Rate * -XX:ZAllocationSpikeTolerance + α 39 #jjug_ccc #jjug_ccc_b
  33. Condition • Already evaluated Java 17,21 for HBase, Hadoop and

    Zookeeper • Focus GC for HBase RegionServer • Using G1GC for 31GB heap • First, compare the performance between G1GC and ZGC for 31GB heap • After that, try to increase heap size for ZGC • Example HW Spec • CPU: 20 core, 40 threads, 2.2GHz • RAM: 192GB • Disk: SSD 480GB*2 (RAID1), NVMe 3200GB*1 (RAID0) 41 #jjug_ccc #jjug_ccc_b
  34. Benchmark 1 • Simulate production table workload (1x traffic) •

    31GB Heap • -XX:+UseZGC -XX:+AlwaysPreTouch -XX:+UseLargePages -XX:AllocateHeapAt=/javaheap ... 42 #jjug_ccc #jjug_ccc_b
  35. Benchmark 1: Result • Not good 2023-10-23 17:48:17,917 INFO [sync.0]

    wal.AbstractFSWAL: Slow sync cost: 261 ms, current pipeline: [DatanodeInfoWithStorage[10.***.***.***:*****,DS-0cd60649-e74e-4d7c-b9cb- 9cc45eddfe6e,DISK], DatanodeInfoWithStorage[10.***.***.***:*****,DS-377ccc70-8a5b-4d2b-ba57-50a9d4451434,DISK], DatanodeInfoWithStorage[10.***.***.***:*****,DS-f40618e1-9dda- 4947-a f2b-97653ced0cb9,DISK]] 2023-10-23 17:48:17,917 WARN [RpcServer.default.RWQ.Fifo.write.handler=255,queue=5,port=11471] ipc.RpcServer: (responseTooSlow): {"call":"Multi(org.apache.hadoop.hbase.shaded.protobuf.generated.ClientProtos$MultiRequest)","multi.gets":0,"starttimems":"1698050897655","responsesize":"10","method":"Multi","param":"reg ion= *****, for 1 action(s) and 1st row key=*****","processingtimems":262,"client":"10.***.***.***:*****","multi.service_calls":0,"queuetimems":0,"class<span class="code- quote">":"HRegionServer","multi.mutations":1} [2023-10-23T17:48:17.916+0900][136166][info ][gc ] Allocation Stall (ResponseProcessor for block BP-1688862045-10.***.***.***-1656316144477:blk_1084294087_10564360) 260.902ms [2023-10-23T17:48:17.916+0900][136166][info ][gc ] Allocation Stall (RpcServer.default.RWQ.Fifo.write.handler=33,queue=8,port=11471) 252.762ms [2023-10-23T17:48:17.916+0900][136166][info ][gc ] Allocation Stall (RS-EventLoopGroup-1-5) 214.945ms 43 #jjug_ccc #jjug_ccc_b
  36. Benchmark 1: Why Allocation Stall occurs? [2023-10-23T17:48:08.862+0900][136166][debug][gc,alloc ] Allocation Rate:

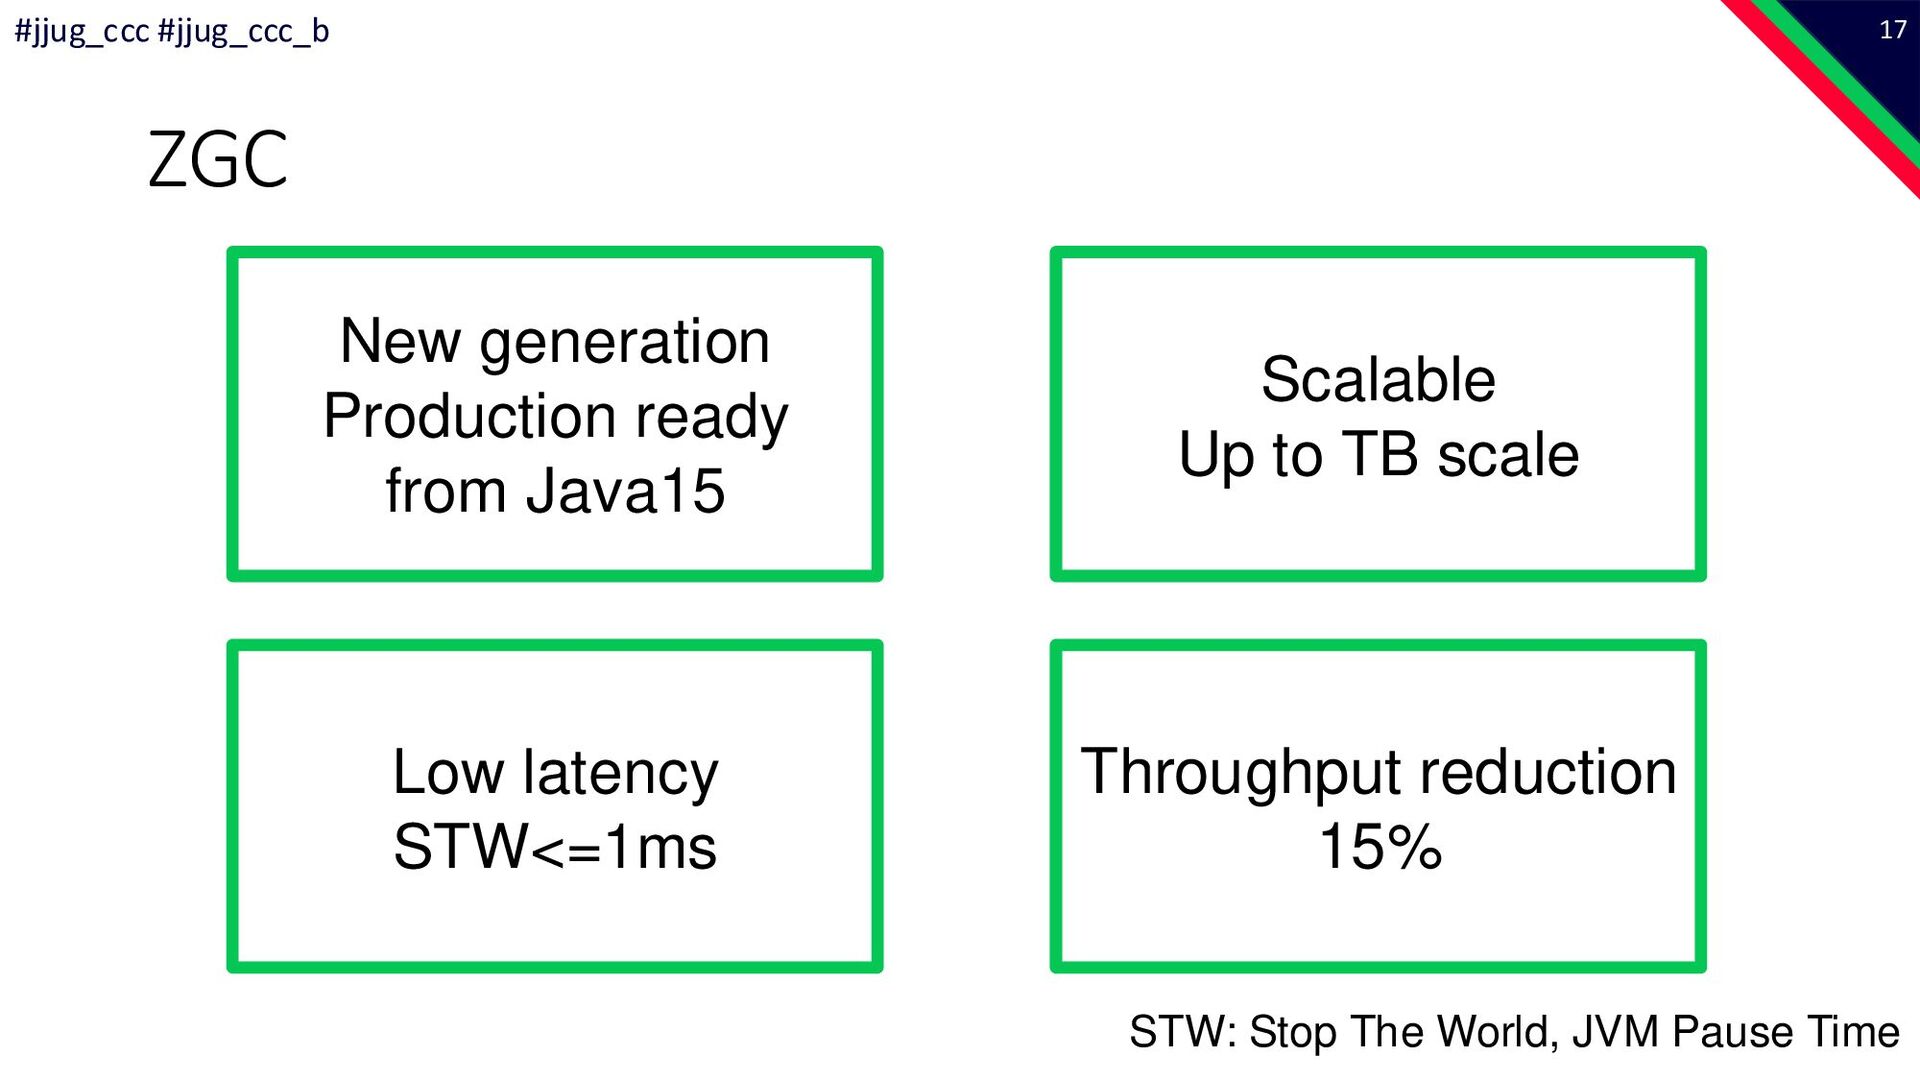
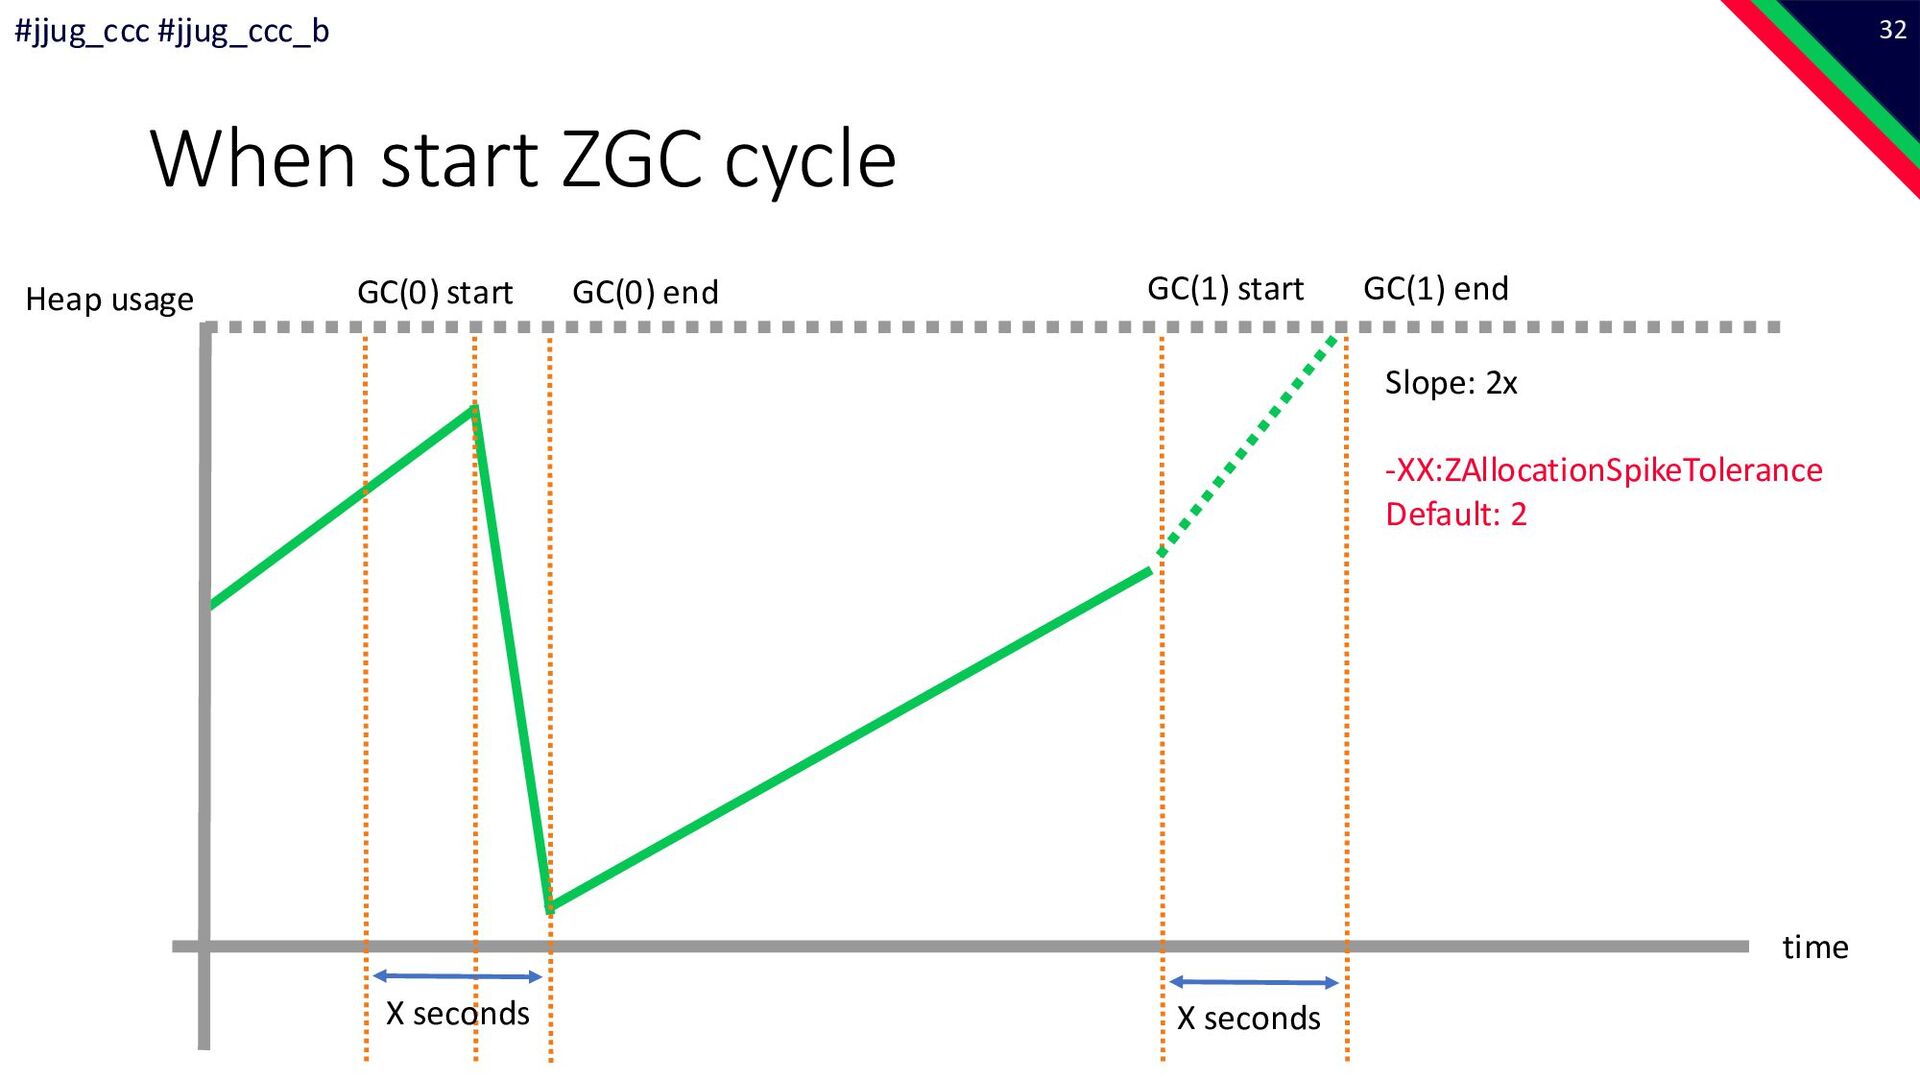
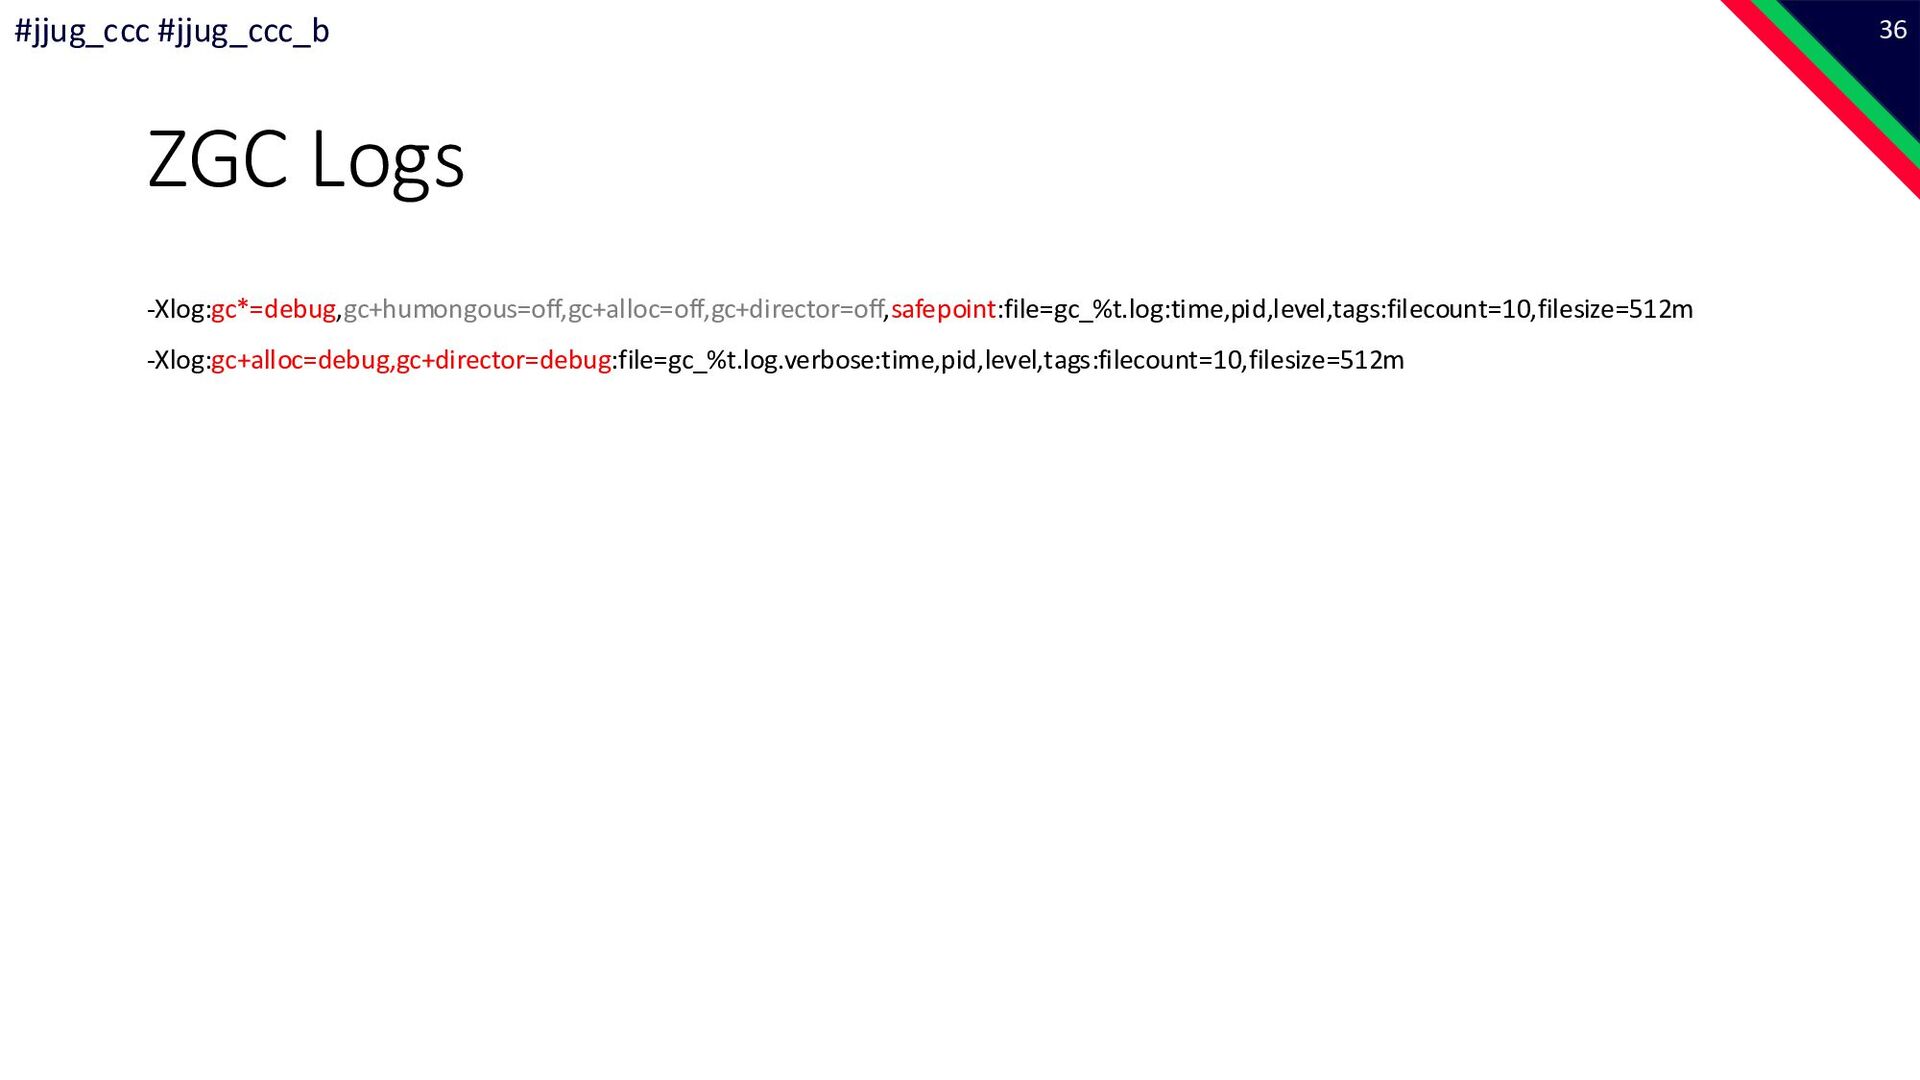
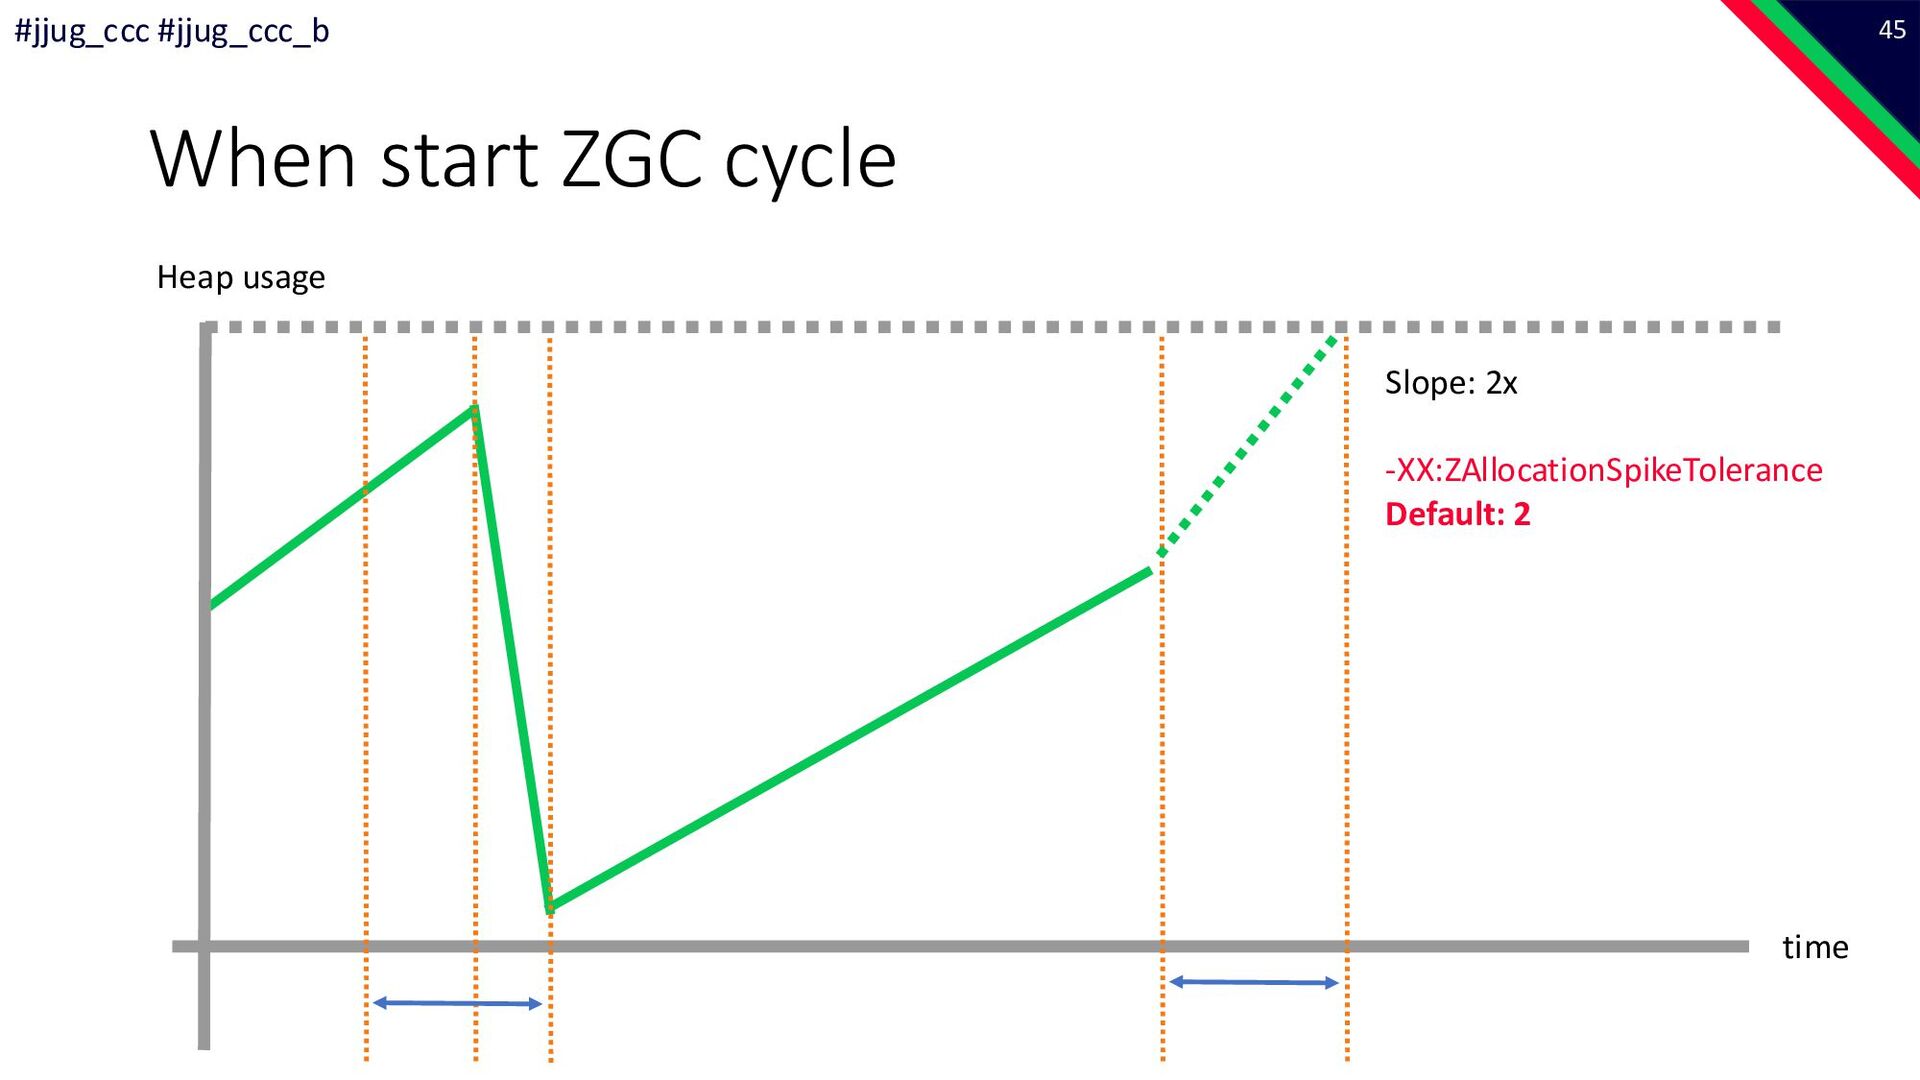
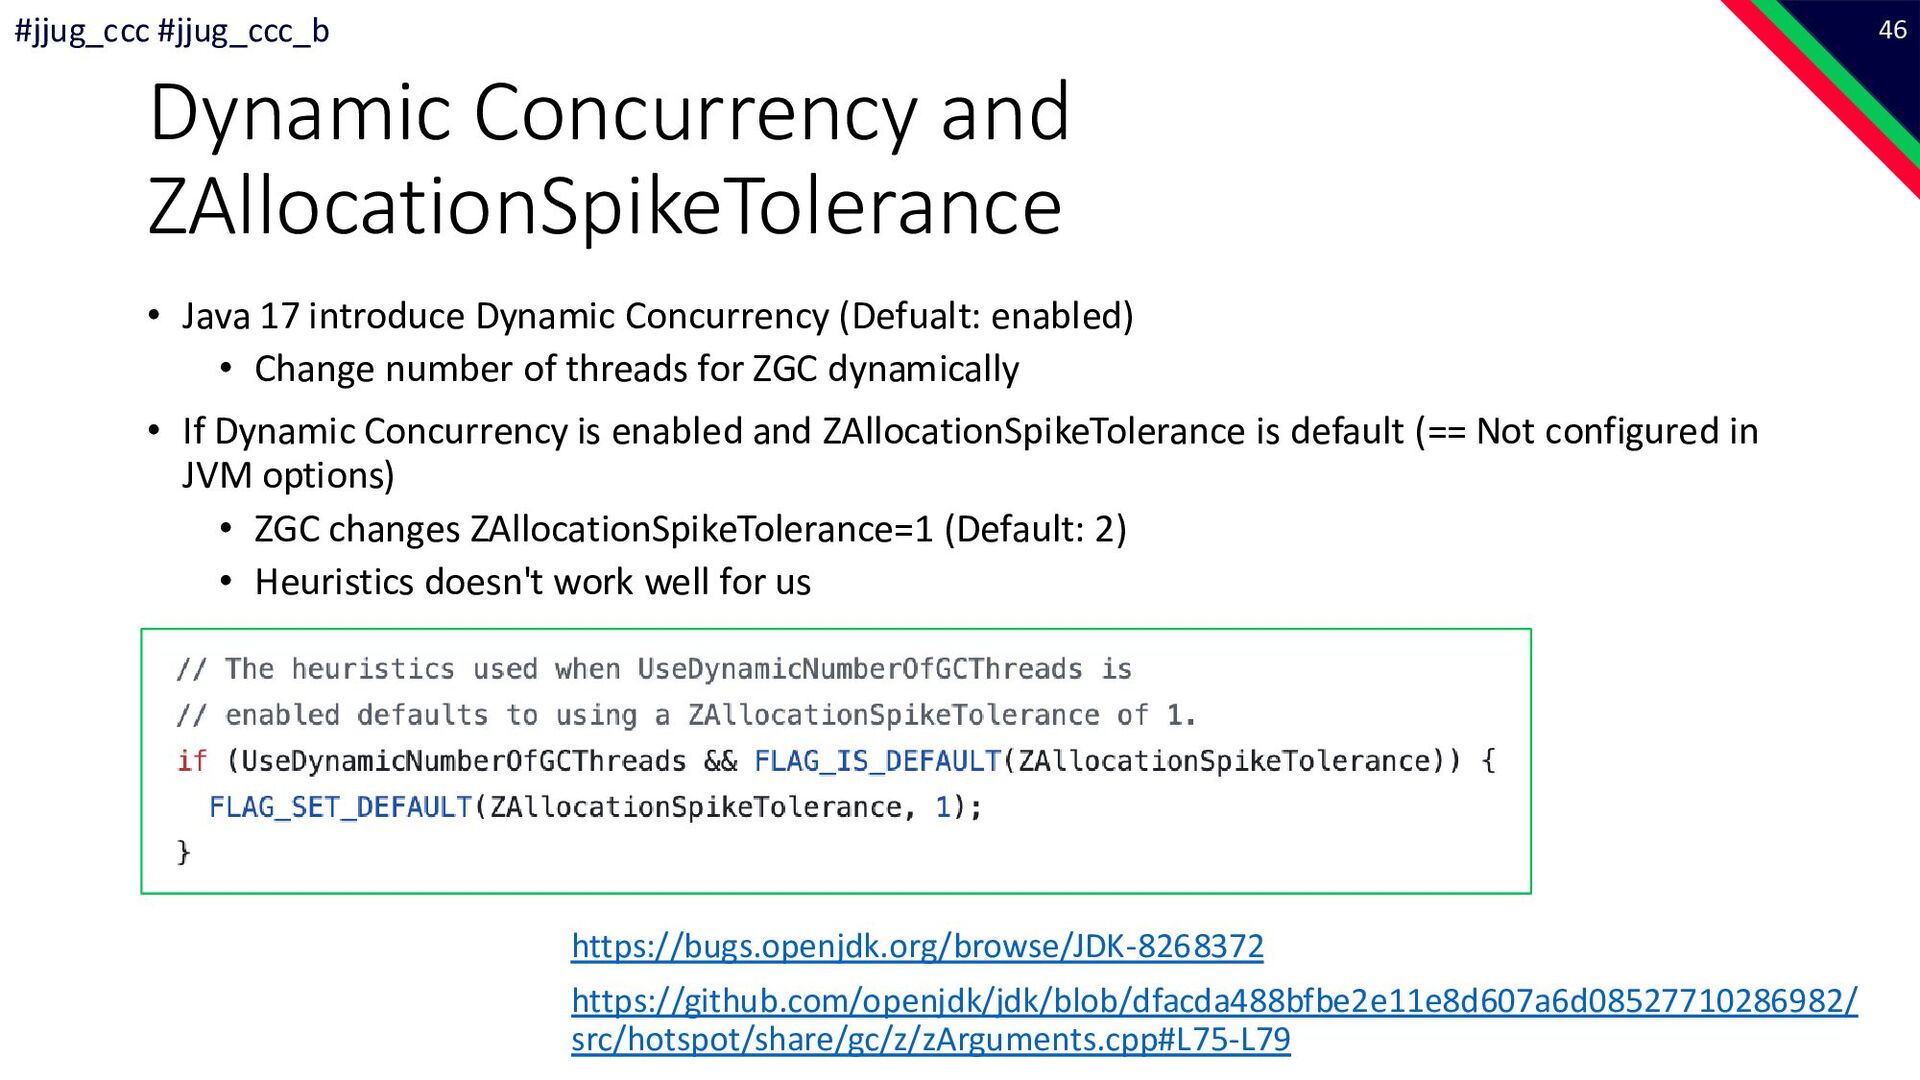
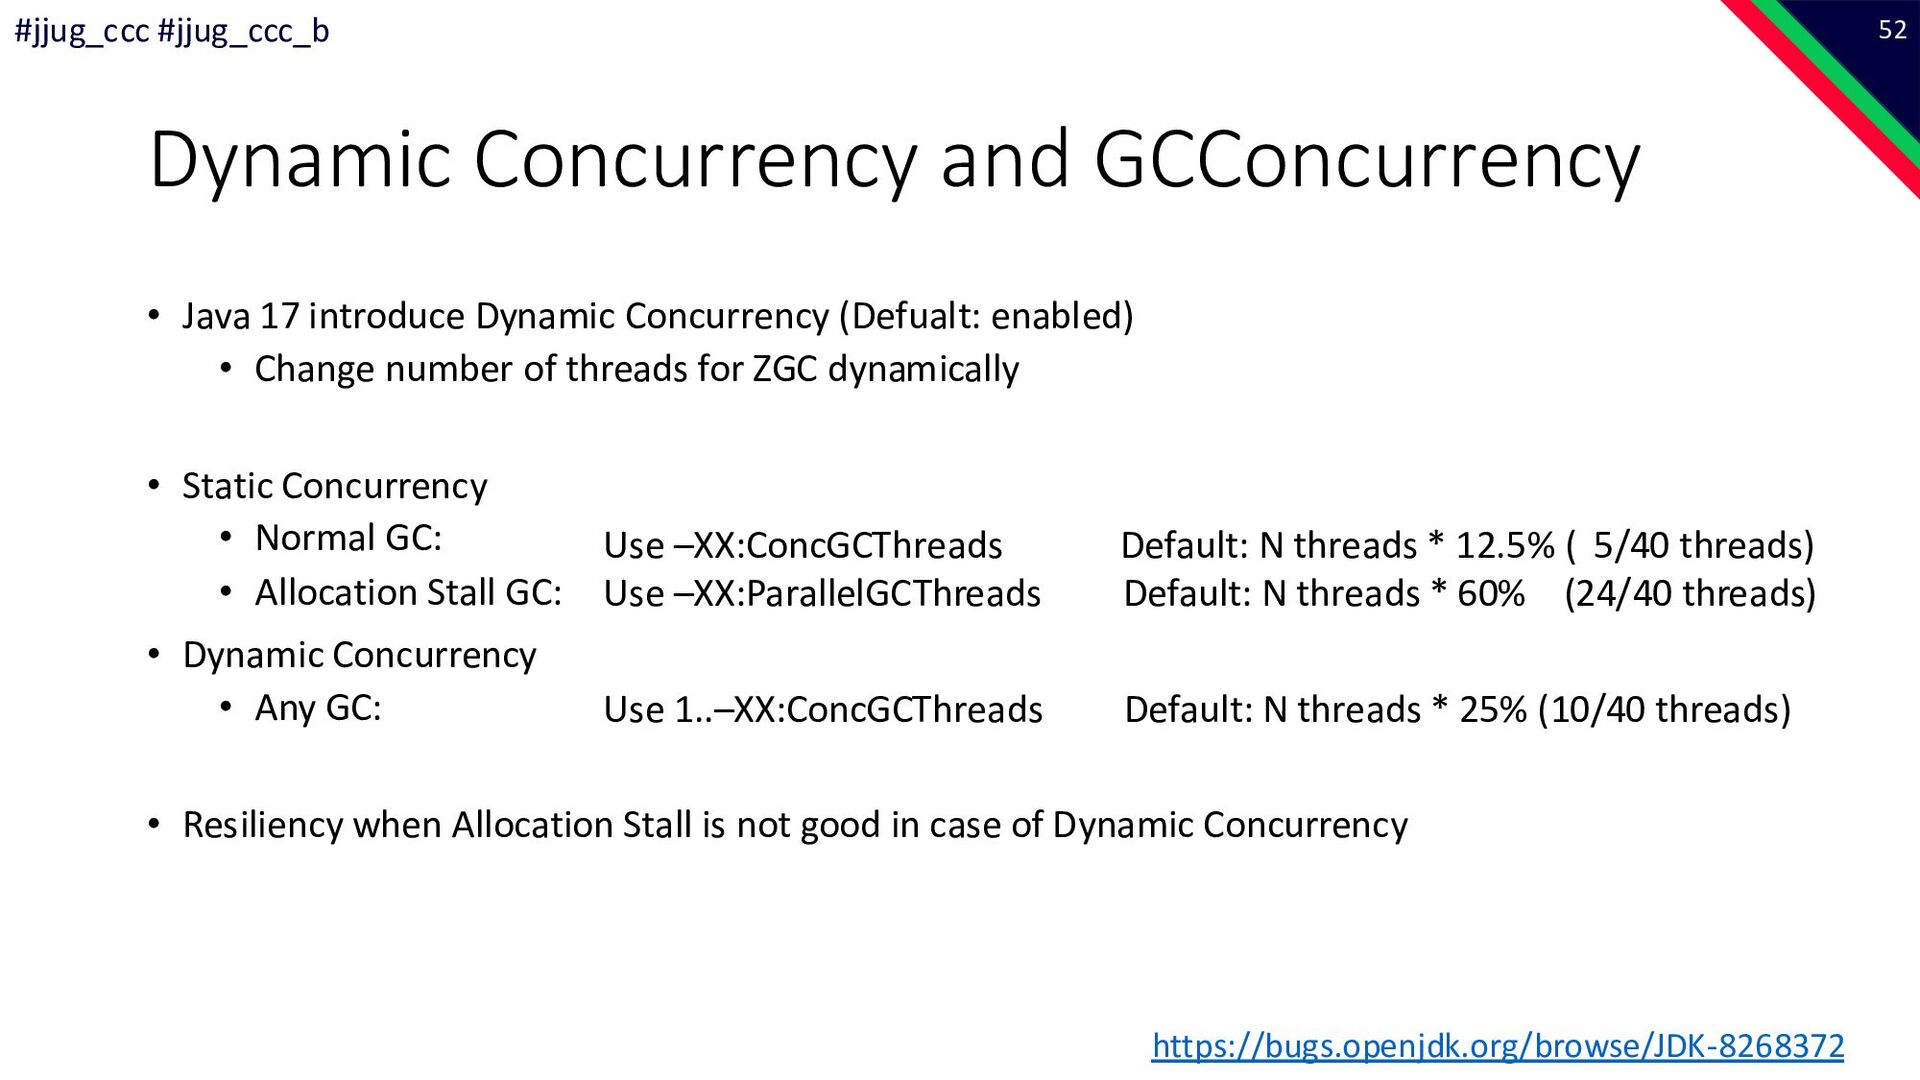
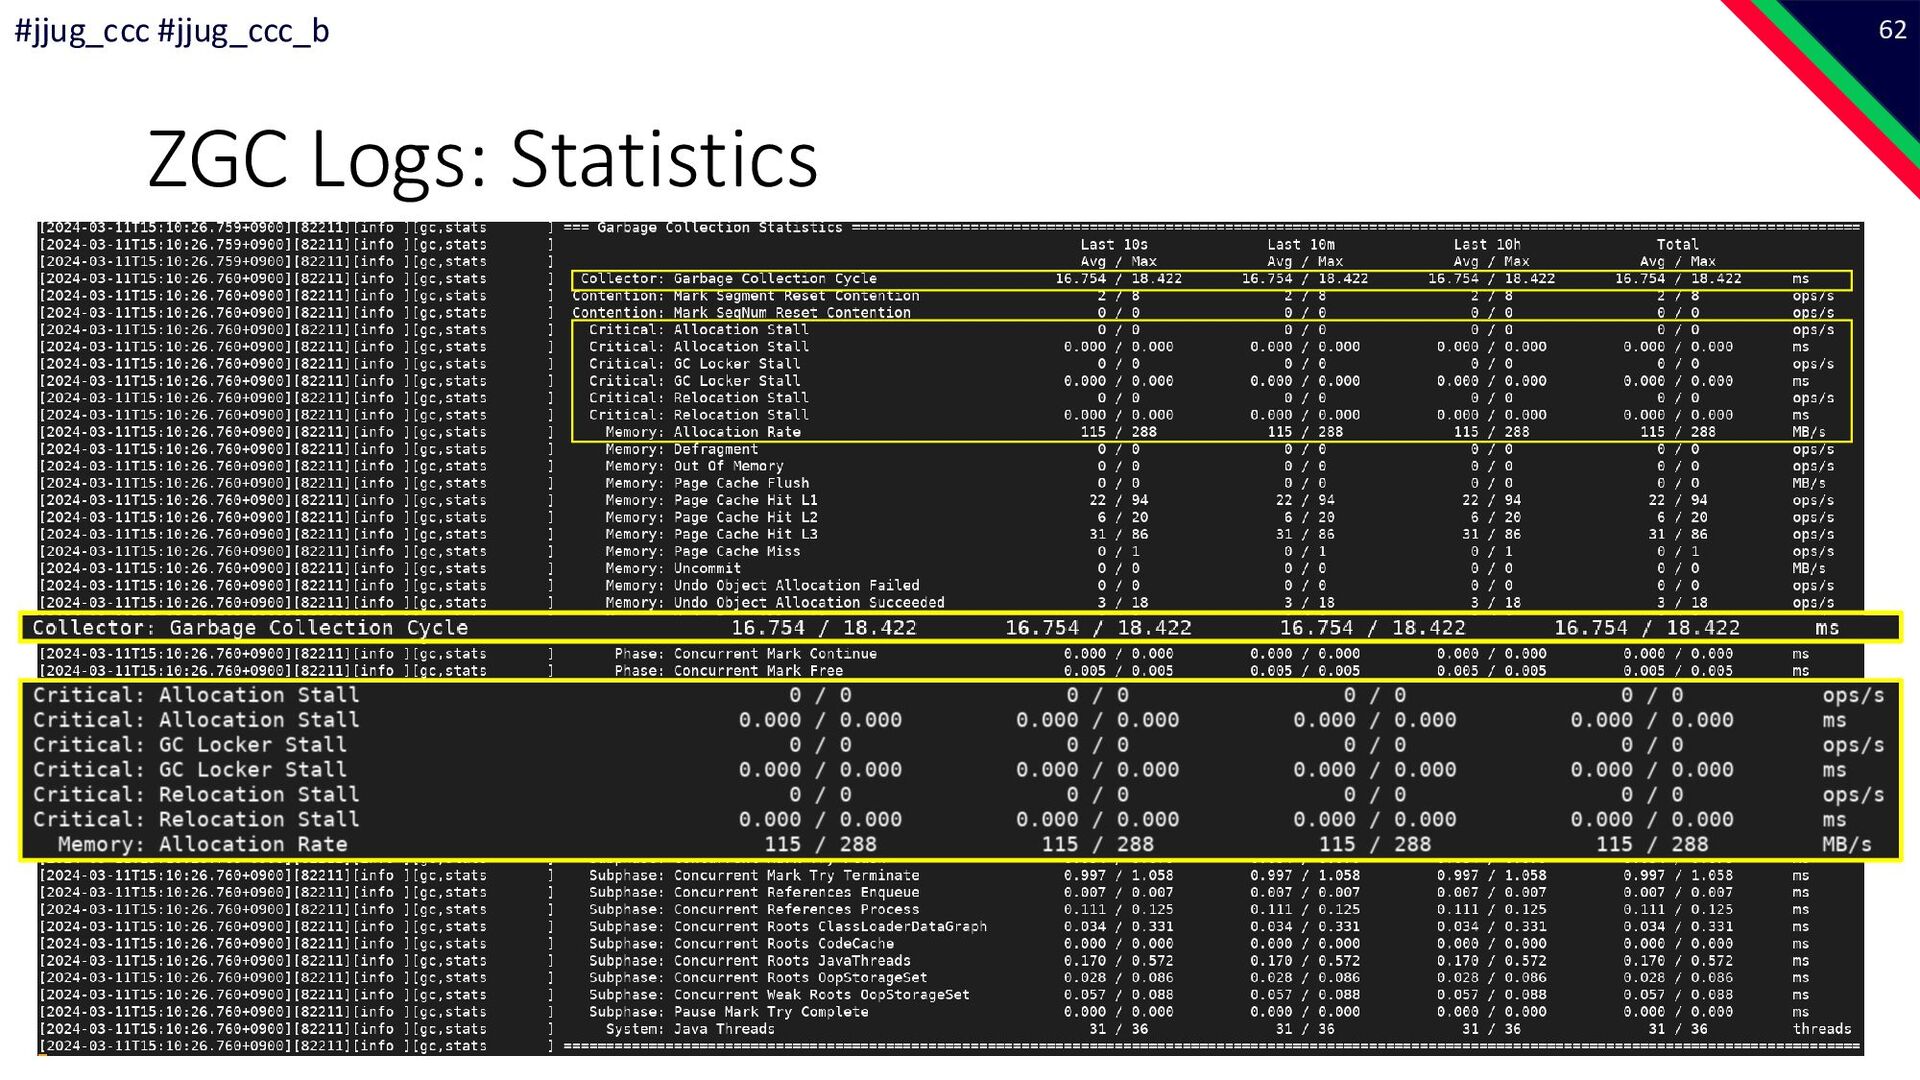
    2754.0MB/s, Predicted: 2744.4MB/s, Avg: 2663.4(+/-45.1)MB/s [2023-10-23T17:48:08.862+0900][136166][debug][gc,director ] Select GC Workers (Normal), AvoidLongGCWorkers: 5.848, AvoidOOMGCWorkers: 6.961, LastGCWorkers: 7.000, GCWorkers: 6.961 [2023-10-23T17:48:08.862+0900][136166][debug][gc,director ] Rule: Allocation Rate (Dynamic GC Workers), MaxAllocRate: 2892.9MB/s (+/-1.7%), Free: 24726MB, GCCPUTime: 58.366, GCDuration: 8.358s, TimeUntilOOM: 8.405s, TimeUntilGC: -0.054s, GCWorkers: 7 -> 7 [2023-10-23T17:48:08.862+0900][136166][debug][gc,heap ] GC(823) Heap before GC invocations=823 (full 823): ... [2023-10-23T17:48:09.163+0900][136166][debug][gc,alloc ] Allocation Rate: 2884.0MB/s, Predicted: 2920.4MB/s, Avg: 2741.2(+/-98.3)MB/s [2023-10-23T17:48:09.263+0900][136166][debug][gc,alloc ] Allocation Rate: 2922.0MB/s, Predicted: 2963.6MB/s, Avg: 2770.2(+/-104.4)MB/s [2023-10-23T17:48:09.362+0900][136166][debug][gc,alloc ] Allocation Rate: 2914.0MB/s, Predicted: 2983.2MB/s, Avg: 2798.8(+/-100.6)MB/s [2023-10-23T17:48:09.462+0900][136166][debug][gc,alloc ] Allocation Rate: 2934.0MB/s, Predicted: 2998.1MB/s, Avg: 2827.0(+/-94.8)MB/s [2023-10-23T17:48:09.562+0900][136166][debug][gc,alloc ] Allocation Rate: 2910.0MB/s, Predicted: 2995.9MB/s, Avg: 2848.6(+/-86.3)MB/s [2023-10-23T17:48:09.662+0900][136166][debug][gc,alloc ] Allocation Rate: 2934.0MB/s, Predicted: 2990.9MB/s, Avg: 2871.8(+/-74.1)MB/s [2023-10-23T17:48:09.763+0900][136166][debug][gc,alloc ] Allocation Rate: 2872.0MB/s, Predicted: 2947.3MB/s, Avg: 2888.2(+/-50.4)MB/s [2023-10-23T17:48:09.863+0900][136166][debug][gc,alloc ] Allocation Rate: 2872.0MB/s, Predicted: 2905.1MB/s, Avg: 2900.0(+/-25.0)MB/s Allocation Rate * -XX:ZAllocationSpikeTolerance = 1 44 #jjug_ccc #jjug_ccc_b
  37. Dynamic Concurrency and ZAllocationSpikeTolerance • Java 17 introduce Dynamic Concurrency

    (Defualt: enabled) • Change number of threads for ZGC dynamically • If Dynamic Concurrency is enabled and ZAllocationSpikeTolerance is default (== Not configured in JVM options) • ZGC changes ZAllocationSpikeTolerance=1 (Default: 2) • Heuristics doesn't work well for us https://github.com/openjdk/jdk/blob/dfacda488bfbe2e11e8d607a6d08527710286982/ src/hotspot/share/gc/z/zArguments.cpp#L75-L79 46 #jjug_ccc #jjug_ccc_b https://bugs.openjdk.org/browse/JDK-8268372
  38. Specify ZAllocationSpikeTolerance • -XX:ZAllocationSpikeTolerance=3 • Why 3? • We have

    3x traffic for new year greeting or after large earthquake hits 47 #jjug_ccc #jjug_ccc_b
  39. Benchmark 2 • Simulate production table workload (3x regions) •

    31GB Heap • -XX:+UseZGC -XX:+AlwaysPreTouch -XX:+UseLargePages -XX:AllocateHeapAt=/javaheap \ -XX:ZAllocationSpikeTolerance=3 ... 49 #jjug_ccc #jjug_ccc_b
  40. Benchmark 2: Result [2023-10-24T15:01:59.939+0900][113315][info ][gc ] Allocation Stall (RS-EventLoopGroup-1-77) 212.257ms

    [2023-10-24T15:01:59.939+0900][113315][info ][gc ] Allocation Stall (RS-EventLoopGroup-1-32) 745.304ms [2023-10-24T15:01:59.939+0900][113315][info ][gc ] Allocation Stall (RS-EventLoopGroup-1-41) 724.140ms [2023-10-24T15:01:59.939+0900][113315][info ][gc ] Allocation Stall (RS-EventLoopGroup-1-38) 702.429ms [2023-10-24T15:01:59.939+0900][113315][info ][gc ] Allocation Stall (RS-EventLoopGroup-1-3) 666.996ms [2023-10-24T15:00:08.944+0900][113315][debug][gc,director ] Rule: Allocation Rate (Dynamic GC Workers), MaxAllocRate: 4244.6MB/s (+/-3.6%), Free: 8342MB, GCCPUTime: 49.894, GCDuration: 4.995s, TimeUntilOOM: 1.897s, TimeUntilGC: -3.198s, GCWorkers: 10 -> 10 50 #jjug_ccc #jjug_ccc_b 1s 99%tile response time
  41. Benchmark 2: Why Allocation Stall occurs? [info ][gc,init] GC Workers:

    5/24 (static) ... [debug][gc,director ] Rule: Allocation Stall Observed [debug][gc,heap ] GC(454) Heap before GC invocations=454 (full 454): [debug][gc,heap ] GC(454) ZHeap used 21820M, capacity 31744M, max capacity 31744M [debug][gc,heap ] GC(454) Metaspace used 81958K, committed 82560K, reserved 1130496K [debug][gc,heap ] GC(454) class space used 8250K, committed 8576K, reserved 1048576K [info ][gc,start ] GC(454) Garbage Collection (Allocation Stall) [info ][gc,ref ] GC(454) Clearing All SoftReferences [info ][gc,task ] GC(454) Using 24 workers [debug][gc,phases,start] GC(454) Pause Mark Start [debug][gc,marking ] GC(454) Using 16 mark stripes 51 #jjug_ccc #jjug_ccc_b [info ][gc,init] GC Workers: 10 (dynamic) ... [debug][gc,director ] Rule: Allocation Stall Observed [debug][gc,heap ] GC(788) Heap before GC invocations=788 (full 788): [debug][gc,heap ] GC(788) ZHeap used 22270M, capacity 31744M, max capacity 31744M [debug][gc,heap ] GC(788) Metaspace used 78082K, committed 78720K, reserved 1122304K [debug][gc,heap ] GC(788) class space used 7766K, committed 8128K, reserved 1048576K [info ][gc,start ] GC(788) Garbage Collection (Allocation Stall) [info ][gc,ref ] GC(788) Clearing All SoftReferences [info ][gc,task ] GC(788) Using 10 workers [debug][gc,phases,start] GC(788) Pause Mark Start [debug][gc,marking ] GC(788) Using 8 mark stripes
  42. Dynamic Concurrency and GCConcurrency • Java 17 introduce Dynamic Concurrency

    (Defualt: enabled) • Change number of threads for ZGC dynamically • Static Concurrency • Normal GC: • Allocation Stall GC: • Dynamic Concurrency • Any GC: • Resiliency when Allocation Stall is not good in case of Dynamic Concurrency 52 #jjug_ccc #jjug_ccc_b https://bugs.openjdk.org/browse/JDK-8268372 Use –XX:ConcGCThreads Default: N threads * 12.5% ( 5/40 threads) Use –XX:ParallelGCThreads Default: N threads * 60% (24/40 threads) Use 1..–XX:ConcGCThreads Default: N threads * 25% (10/40 threads)
  43. Specify ConcGCThreads • -XX:ConcGCThreds=20 • Dynamic Concurrency will choose #

    of GC threads between 1〜20 • Select max threads in case of GC cannot catch up • Select smaller threads in case of lower load, save to overhead by GC 53 #jjug_ccc #jjug_ccc_b
  44. Increase Heap size • After several evaluation, we decide heap

    size • HBase RegionServer Heap: 60% (120GB/192GB, 450GB/768GB) • HBase RegionServer Off-Heap: 10%〜15% (30GB/192GB, 90GB/768GB) • Disk Cache: 25%〜30% • If we increased HBase Heap and Off-Heap to 80%~90%, • Disk Cache is too small and HBase RegionServer write performance is degraded 55 #jjug_ccc #jjug_ccc_b
  45. Benchmark 3 • Simulate production table workload (7x traffic) •

    120GB Heap • -XX:+UseZGC -XX:+AlwaysPreTouch -XX:+UseLargePages -XX:AllocateHeapAt=/javaheap \ -XX:ZAllocationSpikeTolerance=3 –XX:+ConcGCThreads=20 ... 56 #jjug_ccc #jjug_ccc_b
  46. Benchmark 3: Result G1GC ZGC 57 #jjug_ccc #jjug_ccc_b 99%tile response

    time 99%tile response time 5ms 15ms 120GB 120GB
  47. Conclusion • ZGC – new GC Algorithm for Java •

    Low latency, TB scalable • Java 17 introduce Dynamic Concurrency • Need to tune 2 parameter carefully • Z Allocation Spike Tolerance • GC Concurrency • Performance is better in our HBase cluster than G1GC • Able to increase heap size without pause time impact • Thanks to increasing heap size, throughput is also increased • Get full power of physical machine 58 #jjug_ccc #jjug_ccc_b
  48. Future work • Evaluate Generational ZGC • We'd like to

    do this in 2024 • Find better heap size for our usecase • HBase heap vs offheap cache vs disk cache • Increase usage of ZGC • Currently we applied ZGC to HBase RegionServer only • We have more daemons • Hadoop Namenode, Datanode, ... • HBase Master • Zookeeper 59 #jjug_ccc #jjug_ccc_b
  49. Benchmark 3 • Simulate production table workload (7x) • 31GB

    Heap • -XX:+UseZGC -XX:+AlwaysPreTouch -XX:+UseLargePages -XX:AllocateHeapAt=/javaheap \ -XX:ZAllocationSpikeTolerance=3 ... 63 #jjug_ccc #jjug_ccc_b