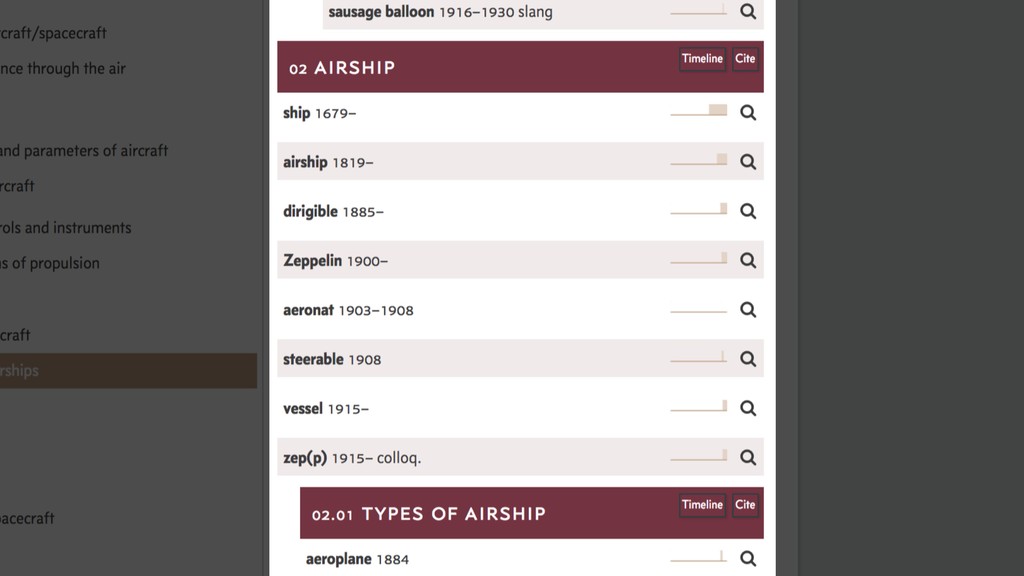
as the essential tool and criterion for the study of any language [and] nothing less than classification, by meaning, of the whole if one is to begin to understand the parts. Kay et al 2017: ‘Why a Historical Thesaurus’ https://ht.ac.uk/why/
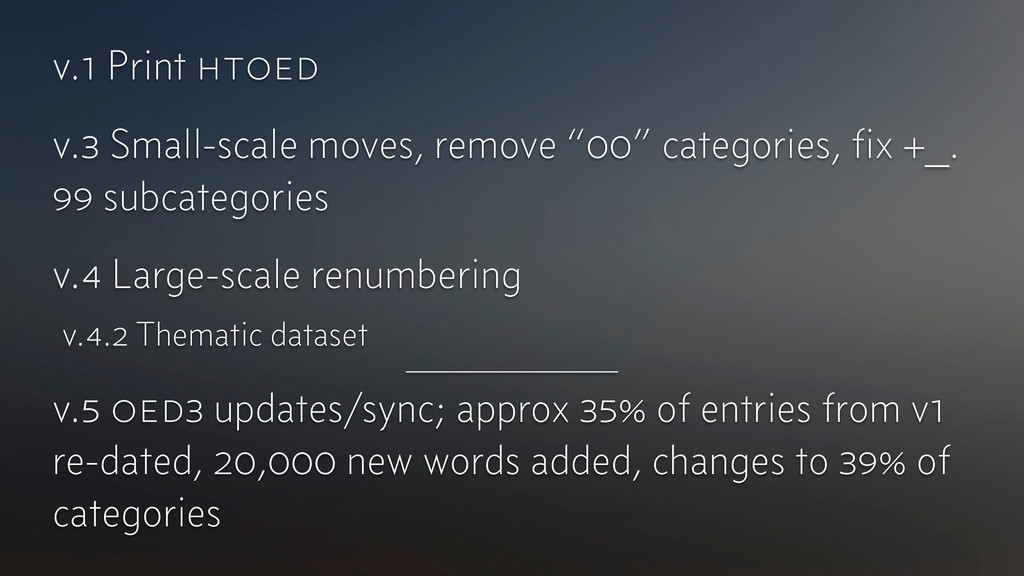
+_. 99 subcategories v.4 Large-scale renumbering v.4.2 Thematic dataset v.5 oed3 updates/sync; approx 35% of entries from v1 re-dated, 20,000 new words added, changes to 39% of categories
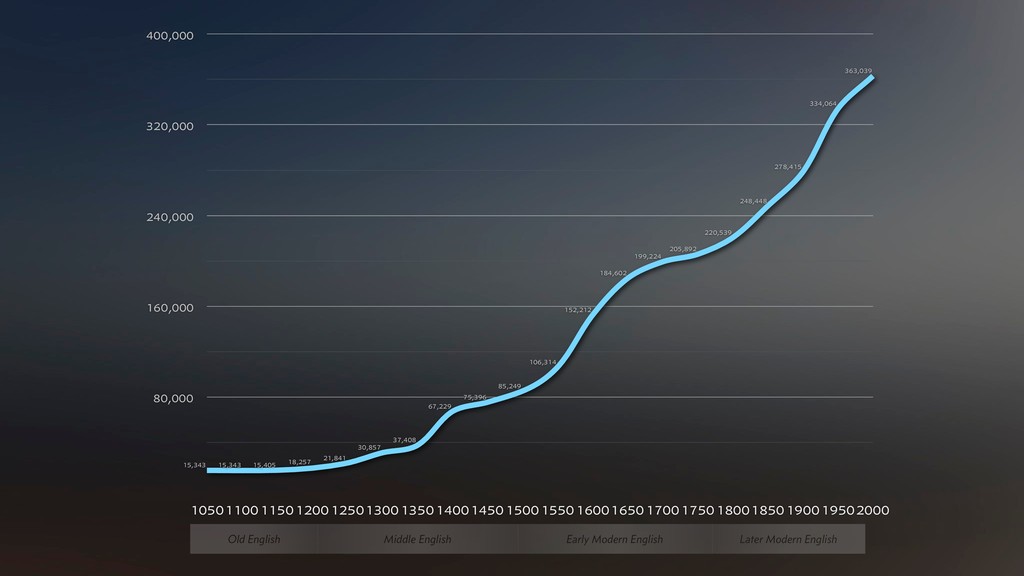
21,841 30,857 37,408 67,229 75,396 85,249 106,314 152,212 184,602 199,224 205,892 220,539 248,448 278,415 334,064 363,039 Middle English Early Modern English Later Modern English Old English
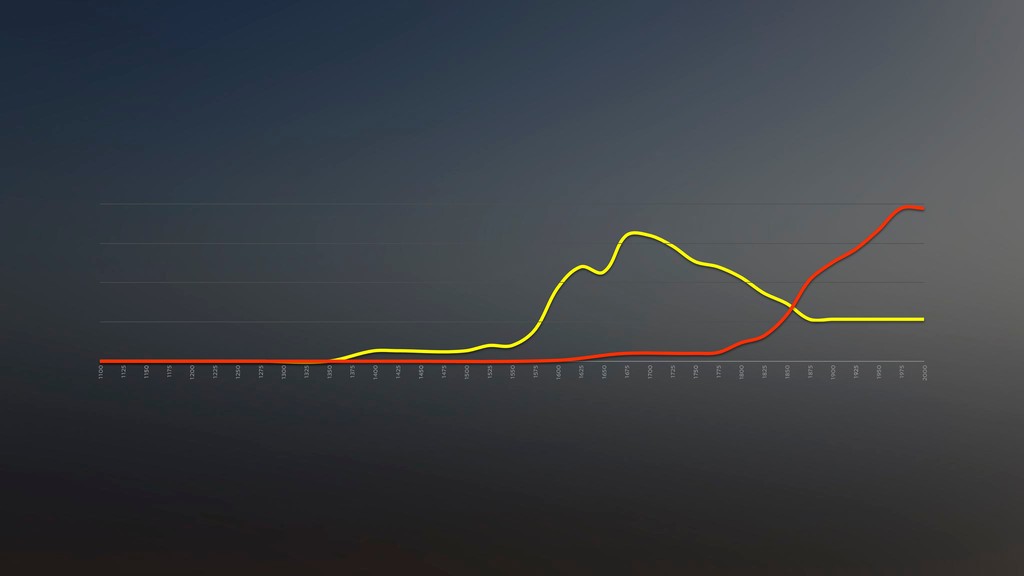
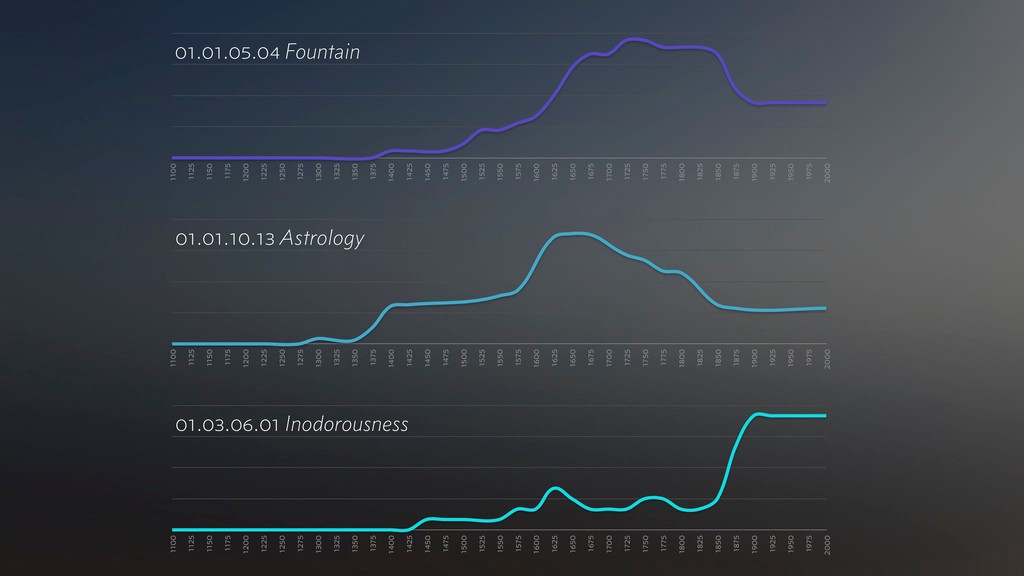
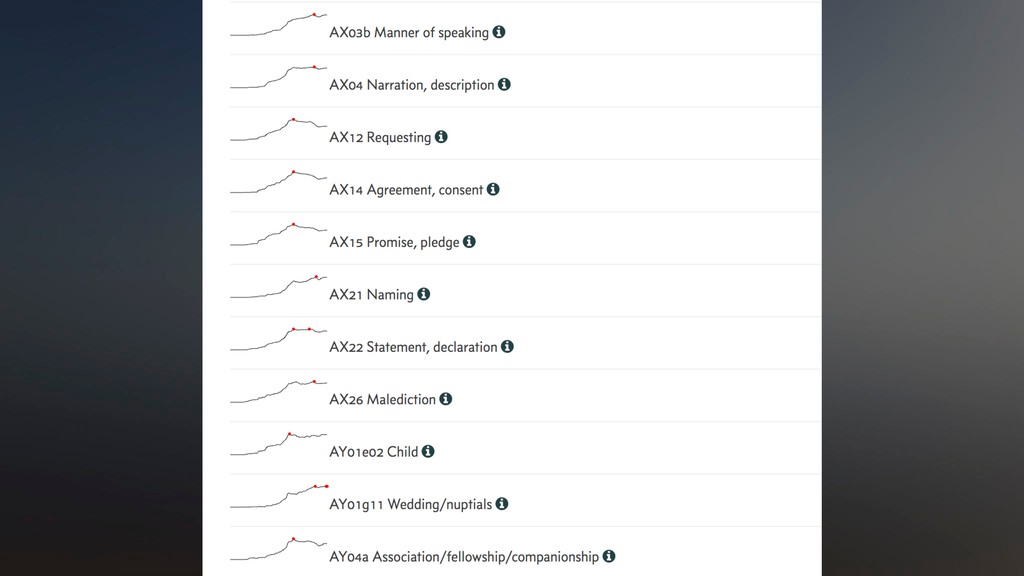
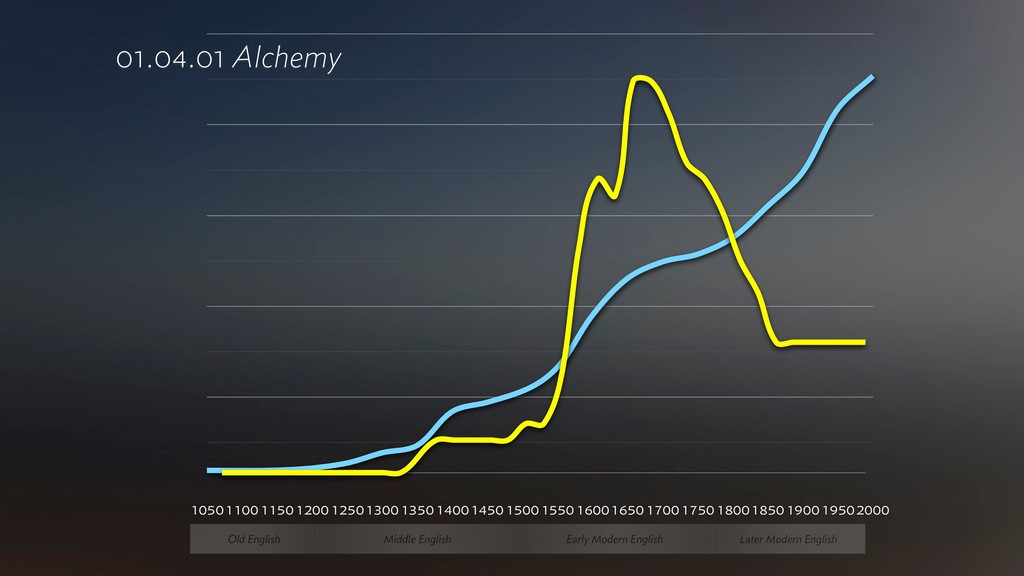
Across a Thesaurus category, patterns of lexicalization show increasing and decreasing word senses available to describe the category’s concept ‣ Such patterns show: ‣ a ‘pressure’ to increase the word-stock of a particular concept ‣ where significant unusual attention has been placed to a concept over time ‣ unusual places where the language develops out of line with general trends lexicalization
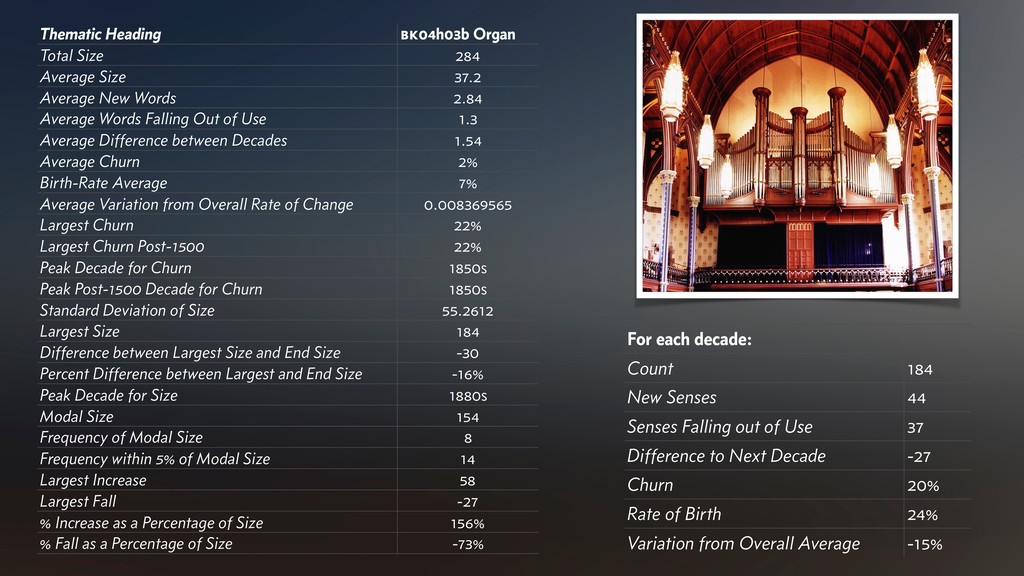
Average New Words 2.84 Average Words Falling Out of Use 1.3 Average Difference between Decades 1.54 Average Churn 2% Birth-Rate Average 7% Average Variation from Overall Rate of Change 0.008369565 Largest Churn 22% Largest Churn Post-1500 22% Peak Decade for Churn 1850s Peak Post-1500 Decade for Churn 1850s Standard Deviation of Size 55.2612 Largest Size 184 Difference between Largest Size and End Size -30 Percent Difference between Largest and End Size -16% Peak Decade for Size 1880s Modal Size 154 Frequency of Modal Size 8 Frequency within 5% of Modal Size 14 Largest Increase 58 Largest Fall -27 % Increase as a Percentage of Size 156% % Fall as a Percentage of Size -73% For each decade: Count 184 New Senses 44 Senses Falling out of Use 37 Difference to Next Decade -27 Churn 20% Rate of Birth 24% Variation from Overall Average -15%
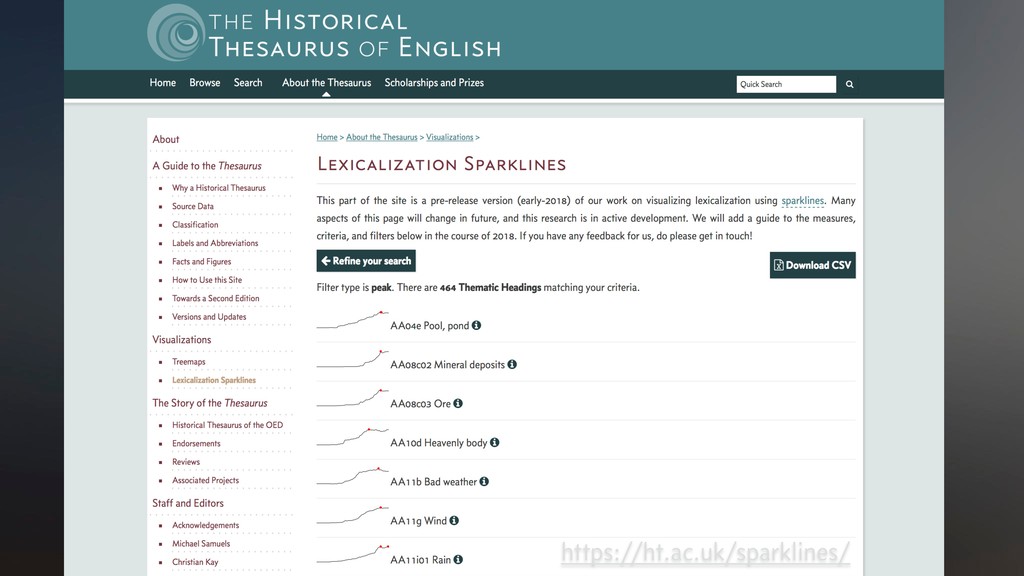
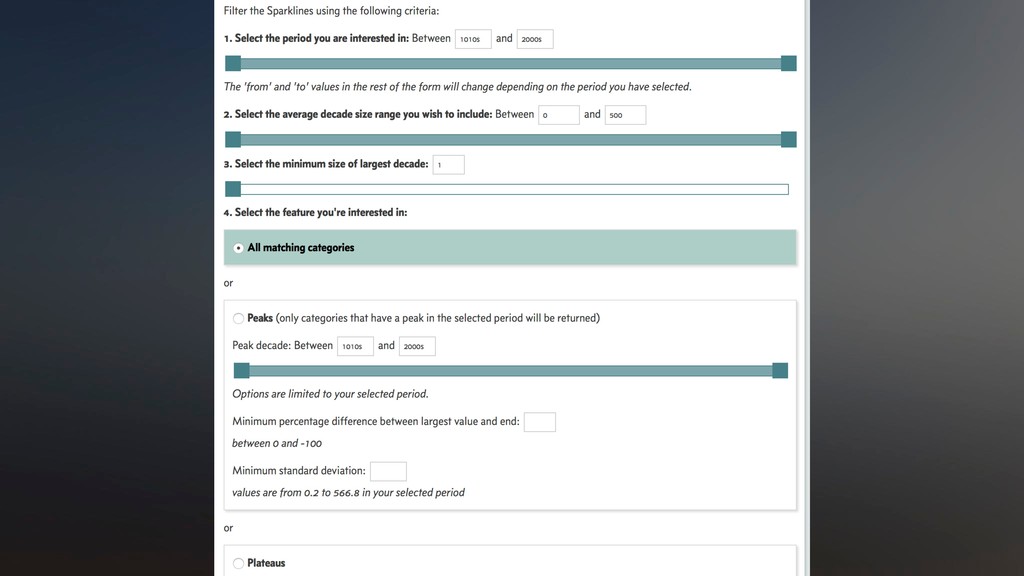
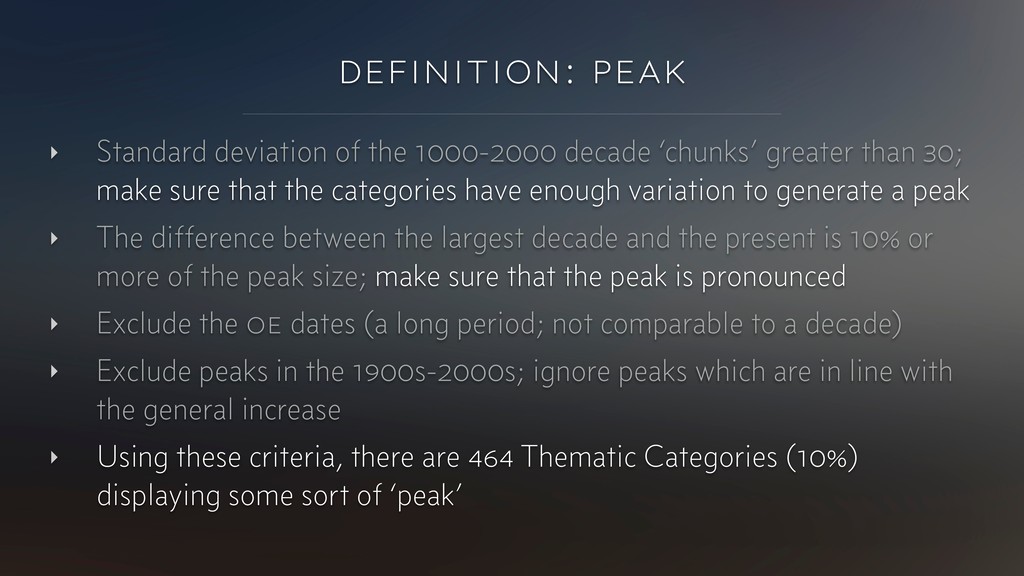
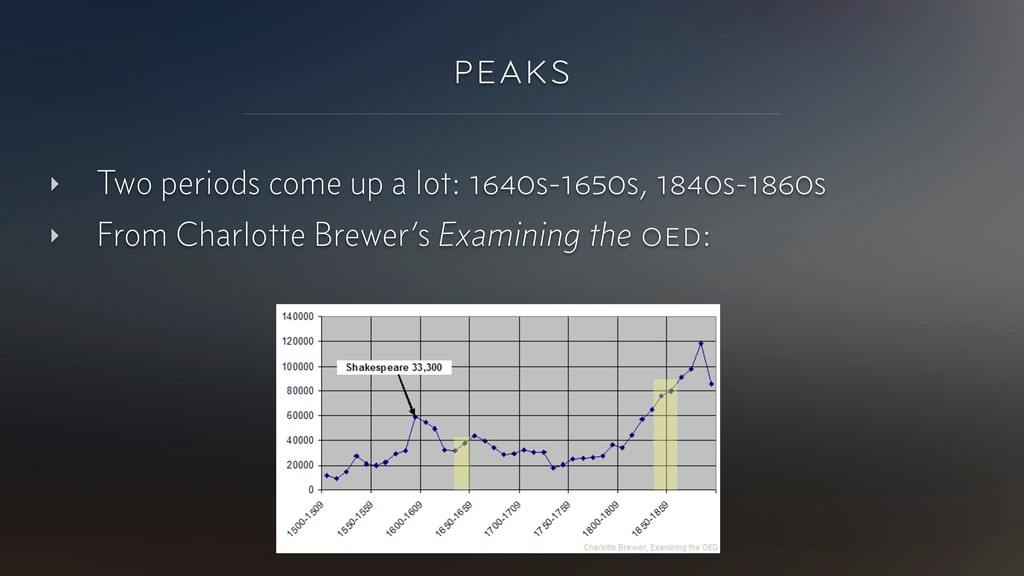
30; make sure that the categories have enough variation to generate a peak ‣ The difference between the largest decade and the present is 10% or more of the peak size; make sure that the peak is pronounced ‣ Exclude the oe dates (a long period; not comparable to a decade) ‣ Exclude peaks in the 1900s-2000s; ignore peaks which are in line with the general increase ‣ Using these criteria, there are 464 Thematic Categories (10%) displaying some sort of ‘peak’ definition: peak
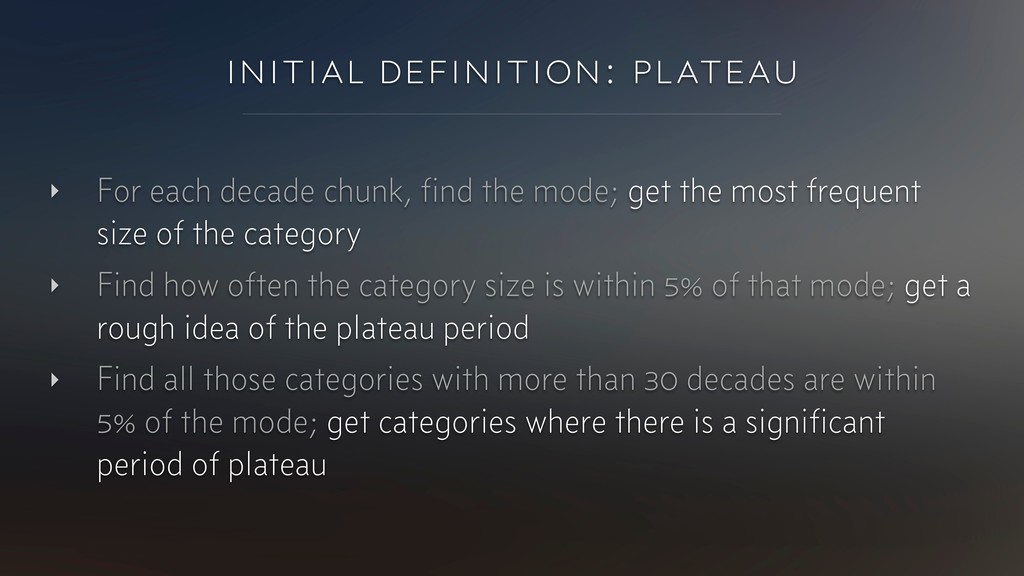
most frequent size of the category ‣ Find how often the category size is within 5% of that mode; get a rough idea of the plateau period ‣ Find all those categories with more than 30 decades are within 5% of the mode; get categories where there is a significant period of plateau initial definition: plateau
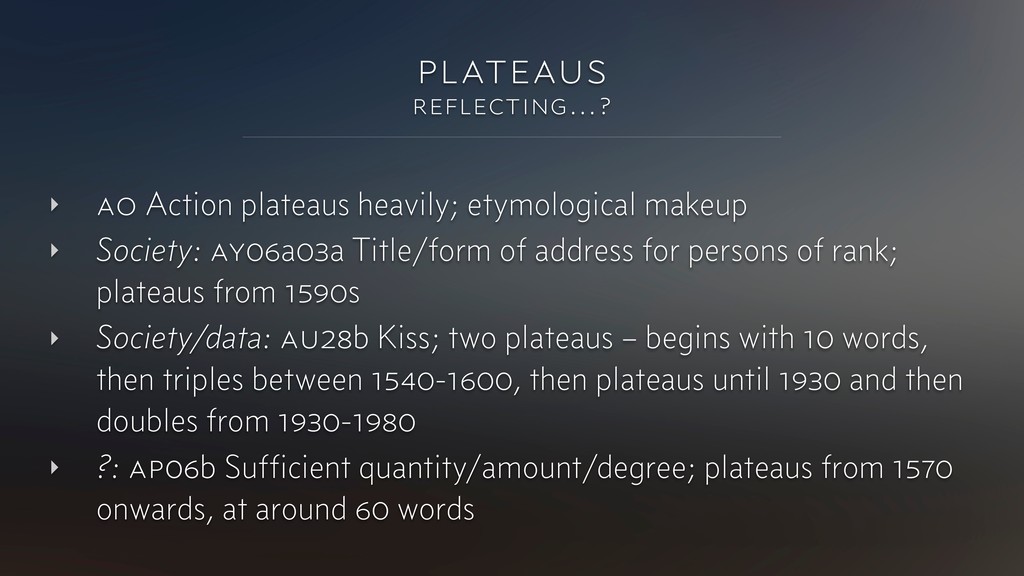
Title/form of address for persons of rank; plateaus from 1590s ‣ Society/data: au28b Kiss; two plateaus – begins with 10 words, then triples between 1540-1600, then plateaus until 1930 and then doubles from 1930-1980 ‣ ?: ap06b Sufficient quantity/amount/degree; plateaus from 1570 onwards, at around 60 words plateaus reflecting…?
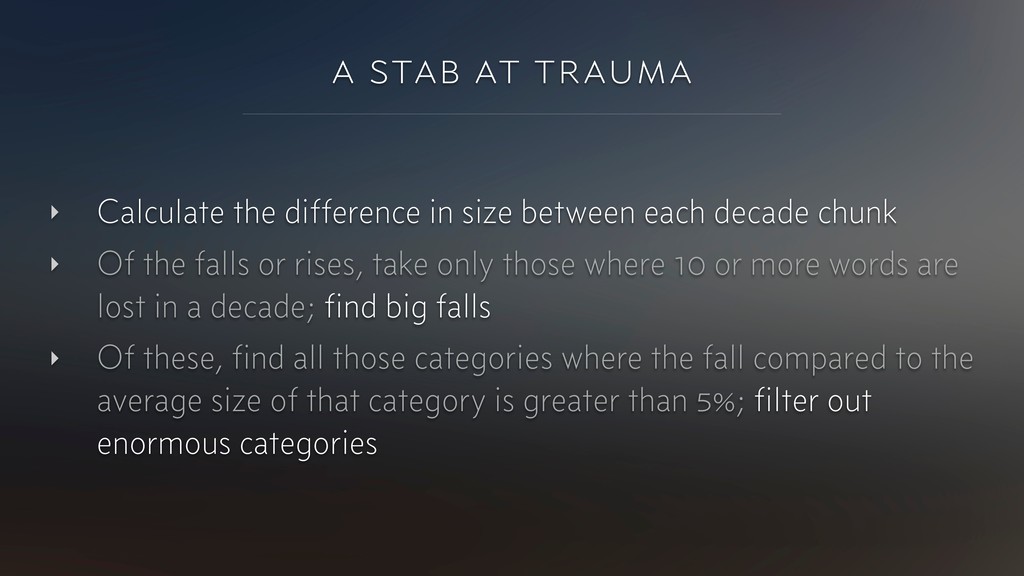
‣ Of the falls or rises, take only those where 10 or more words are lost in a decade; find big falls ‣ Of these, find all those categories where the fall compared to the average size of that category is greater than 5%; filter out enormous categories a stab at trauma
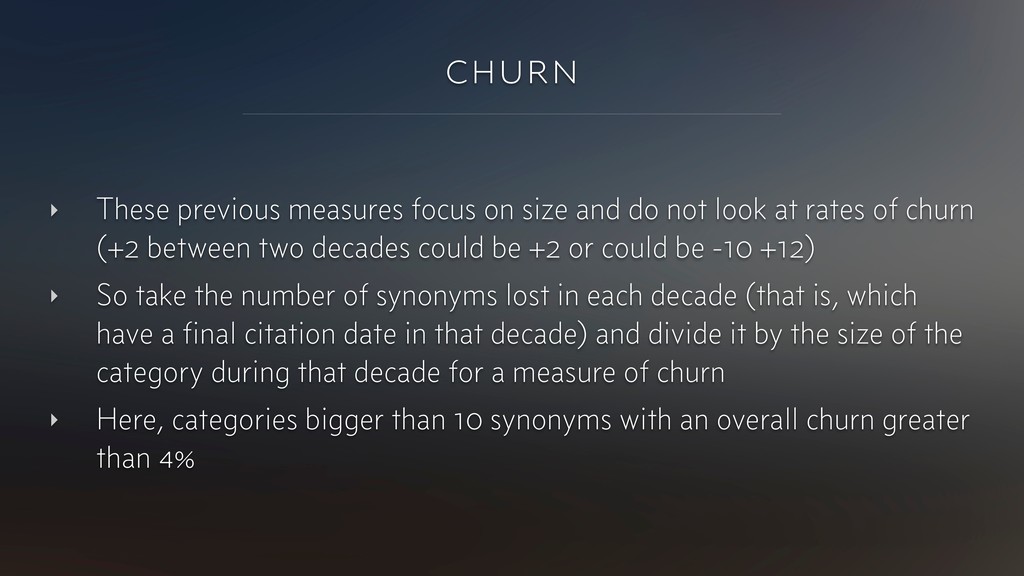
look at rates of churn (+2 between two decades could be +2 or could be -10 +12) ‣ So take the number of synonyms lost in each decade (that is, which have a final citation date in that decade) and divide it by the size of the category during that decade for a measure of churn ‣ Here, categories bigger than 10 synonyms with an overall churn greater than 4% churn
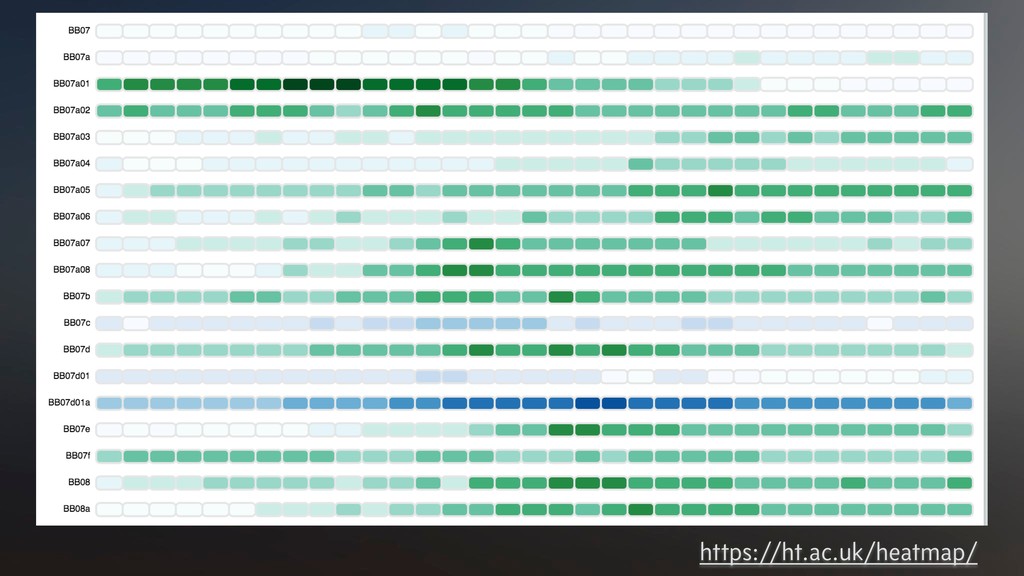
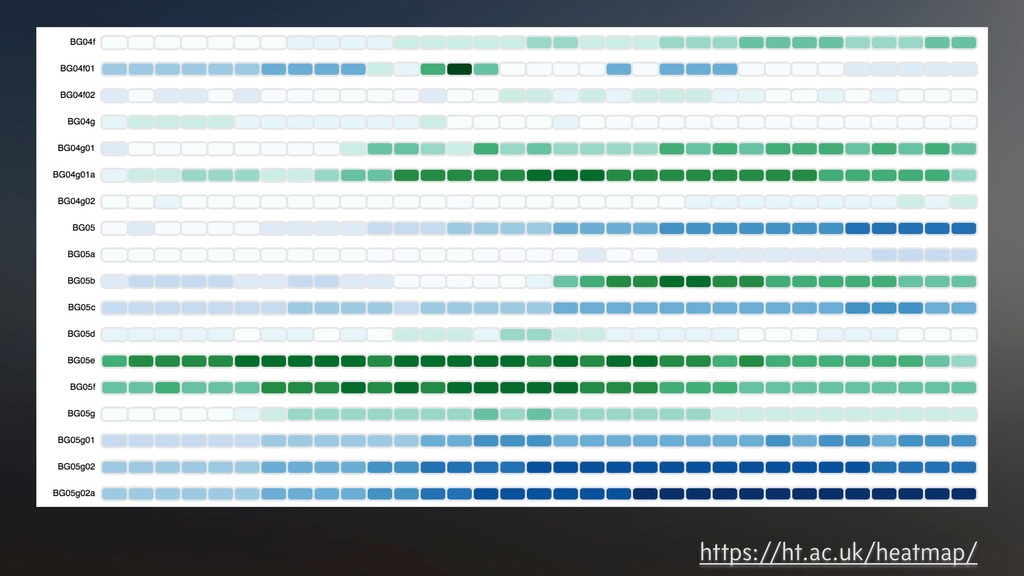
accordance with cultural trends, and mirrors historical facts, then we have a rough measure of attention across the history of English which is primarily independent of frequency ‣ It shows us if our investigation is in a semantic field with unusual overall patterning in a particular period ‣ It connects historical linguistics more closely to the history of ideas what can we tell from this?
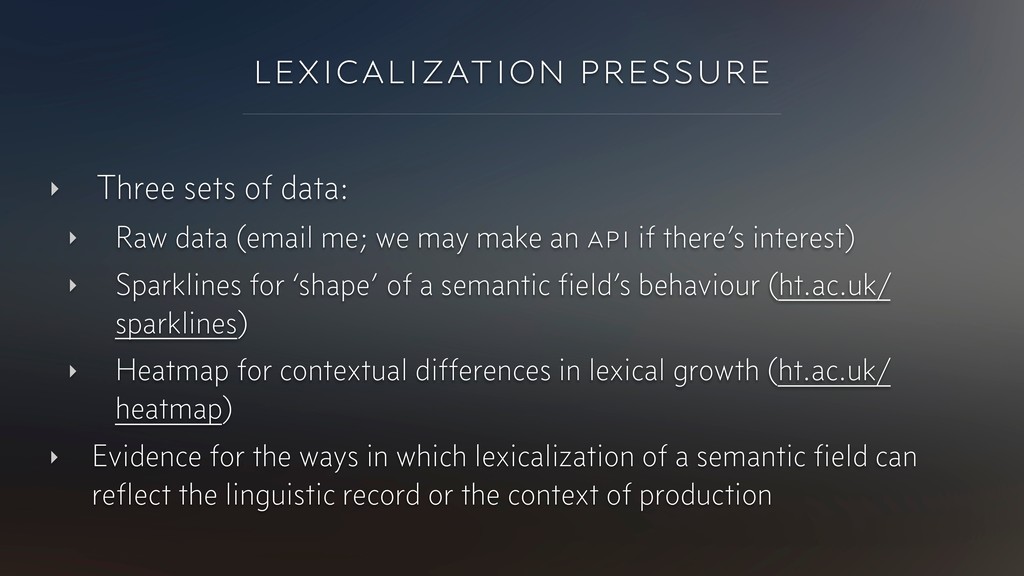
we may make an api if there’s interest) ‣ Sparklines for ‘shape’ of a semantic field’s behaviour (ht.ac.uk/ sparklines) ‣ Heatmap for contextual differences in lexical growth (ht.ac.uk/ heatmap) ‣ Evidence for the ways in which lexicalization of a semantic field can reflect the linguistic record or the context of production lexicalization pressure
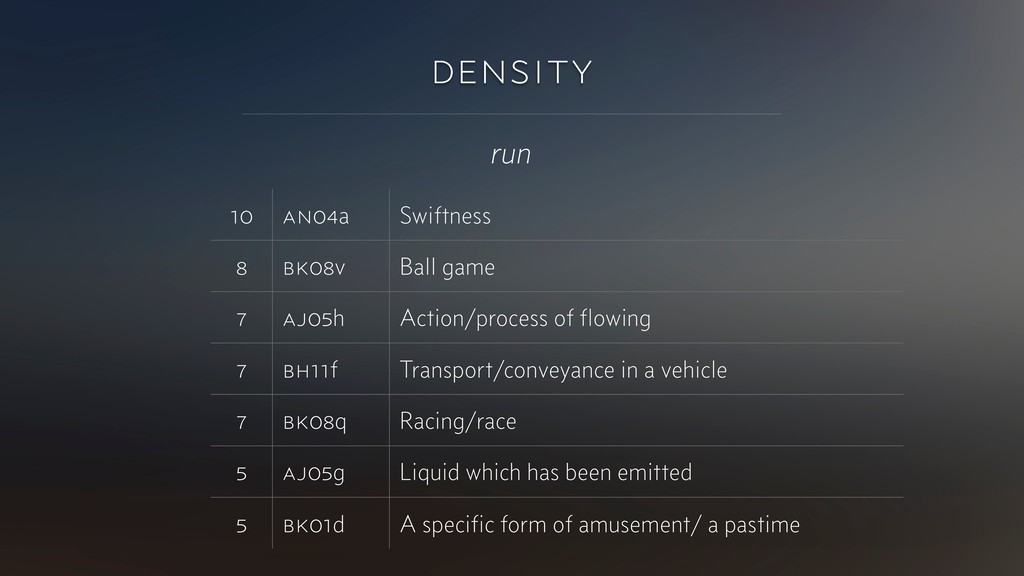
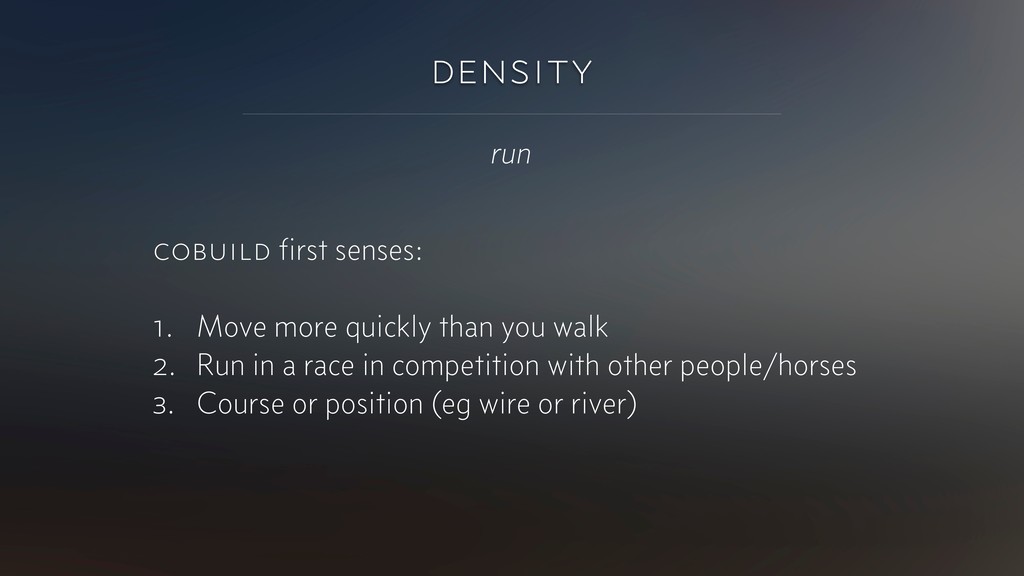
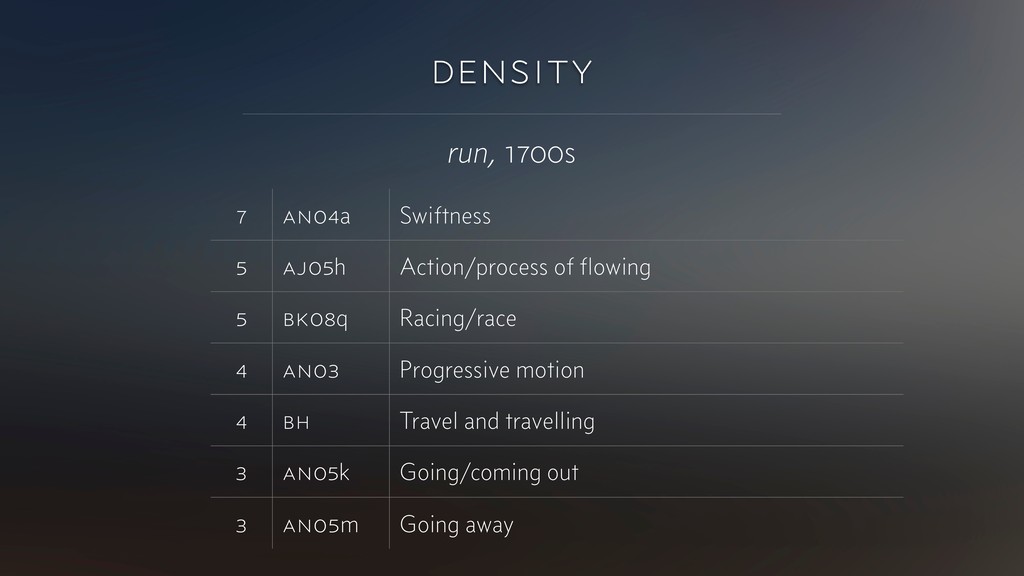
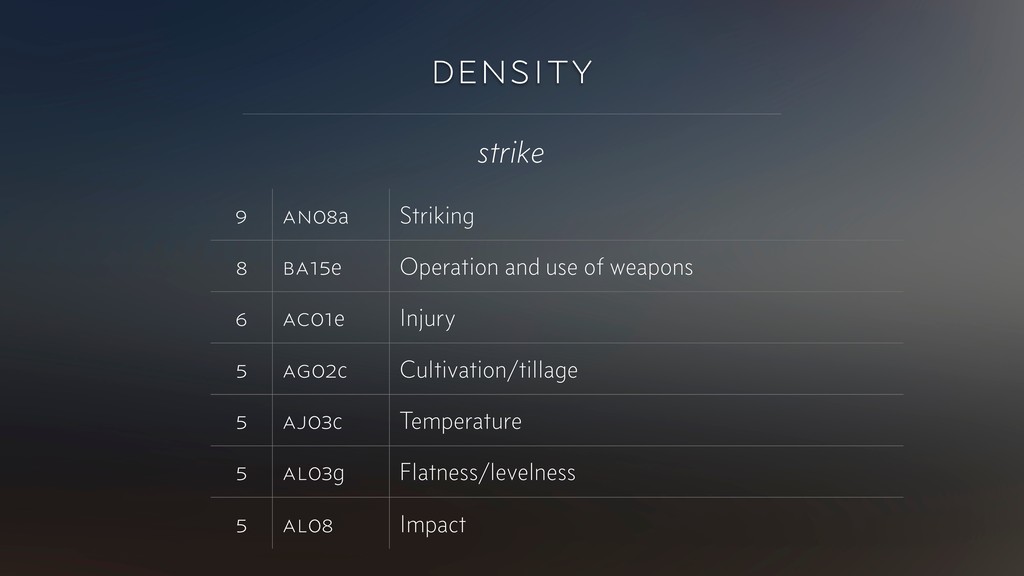
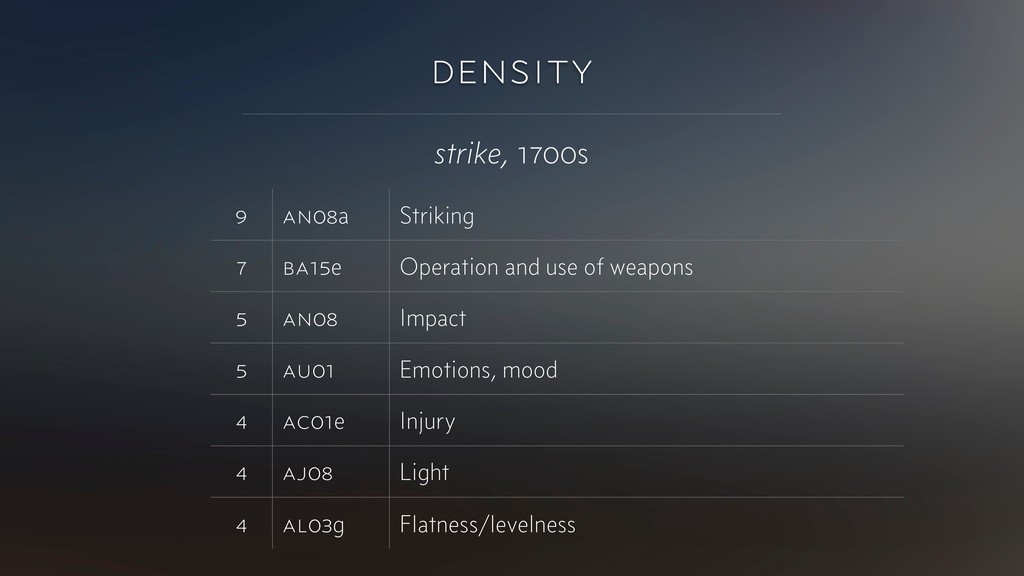
form in a language is the form most likely to bud off further meanings (that is, that will generate re-use of the same word form in the same semantic field) density
aj05h Action/process of flowing 7 bh11f Transport/conveyance in a vehicle 7 bk08q Racing/race 5 aj05g Liquid which has been emitted 5 bk01d A specific form of amusement/ a pastime
Action/process of flowing 7 bh11f Transport/conveyance in a vehicle 7 bk08q Racing/race 5 aj05g Liquid which has been emitted 5 bk01d A specific form of amusement/ a pastime run
accordance with cultural trends, and mirrors historical facts, then we have a rough measure of attention ‣ If we agree that density of a widespread word form in a semantic category indicates the primary sense of that word form at that time, then we have another rough measure of associations of that word form ‣ Frequency is a proxy; we can supplement that proxy what can we tell from this?
the lexicographical record, not least that of oed; ’any dictionary dates should be treated with a certain amount of caution’ (Durkin) ‣ This data can supplement frequency but should not aim to replace it health warnings
English, we have inherited from our predecessors a legacy which can and should be used fruitfully [...] In the field of lexis – apart from alphabetical dictionaries – we are comparatively poorly equipped, and the way before us is a long one.’ Samuels (1965: 40)
![[…] the primacy of meaning, and the analysis of meaning,](https://files.speakerdeck.com/presentations/12dcb9b83d474a478278d33289087a1d/slide_4.jpg)