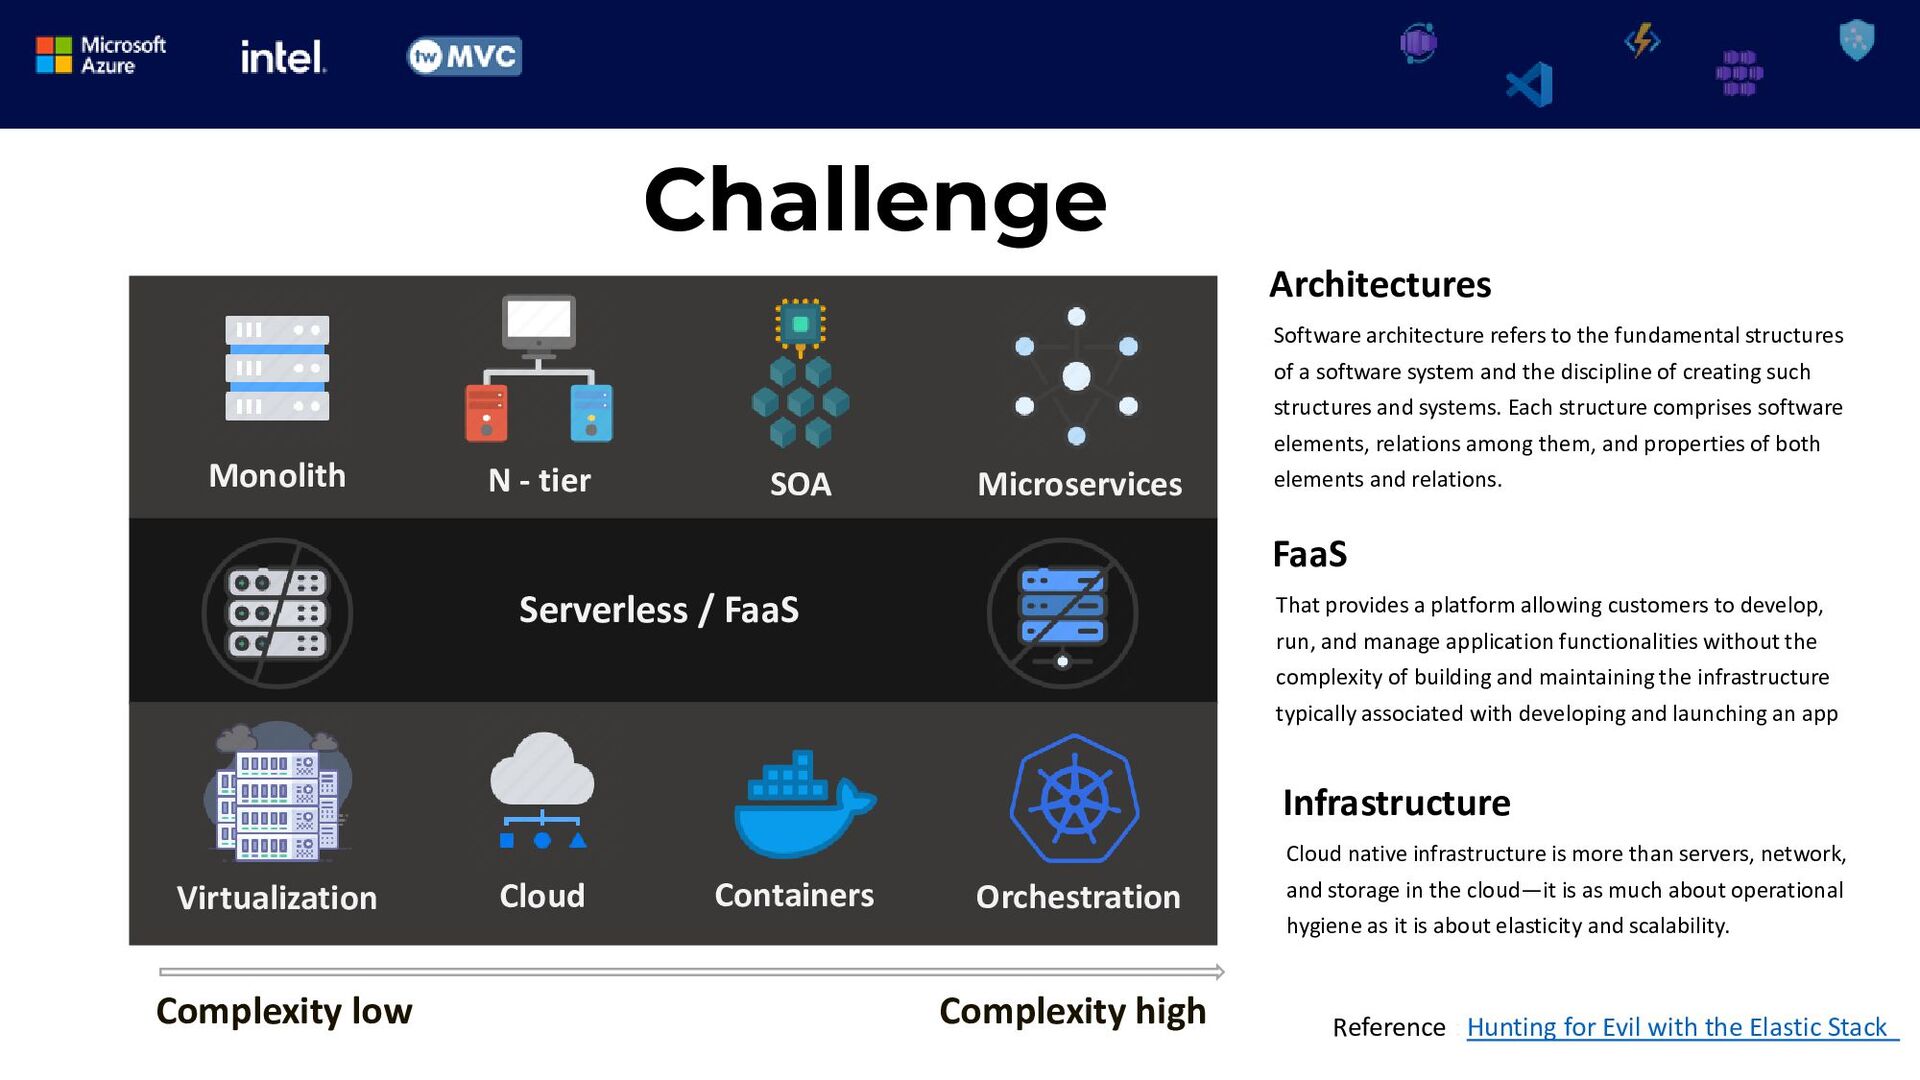
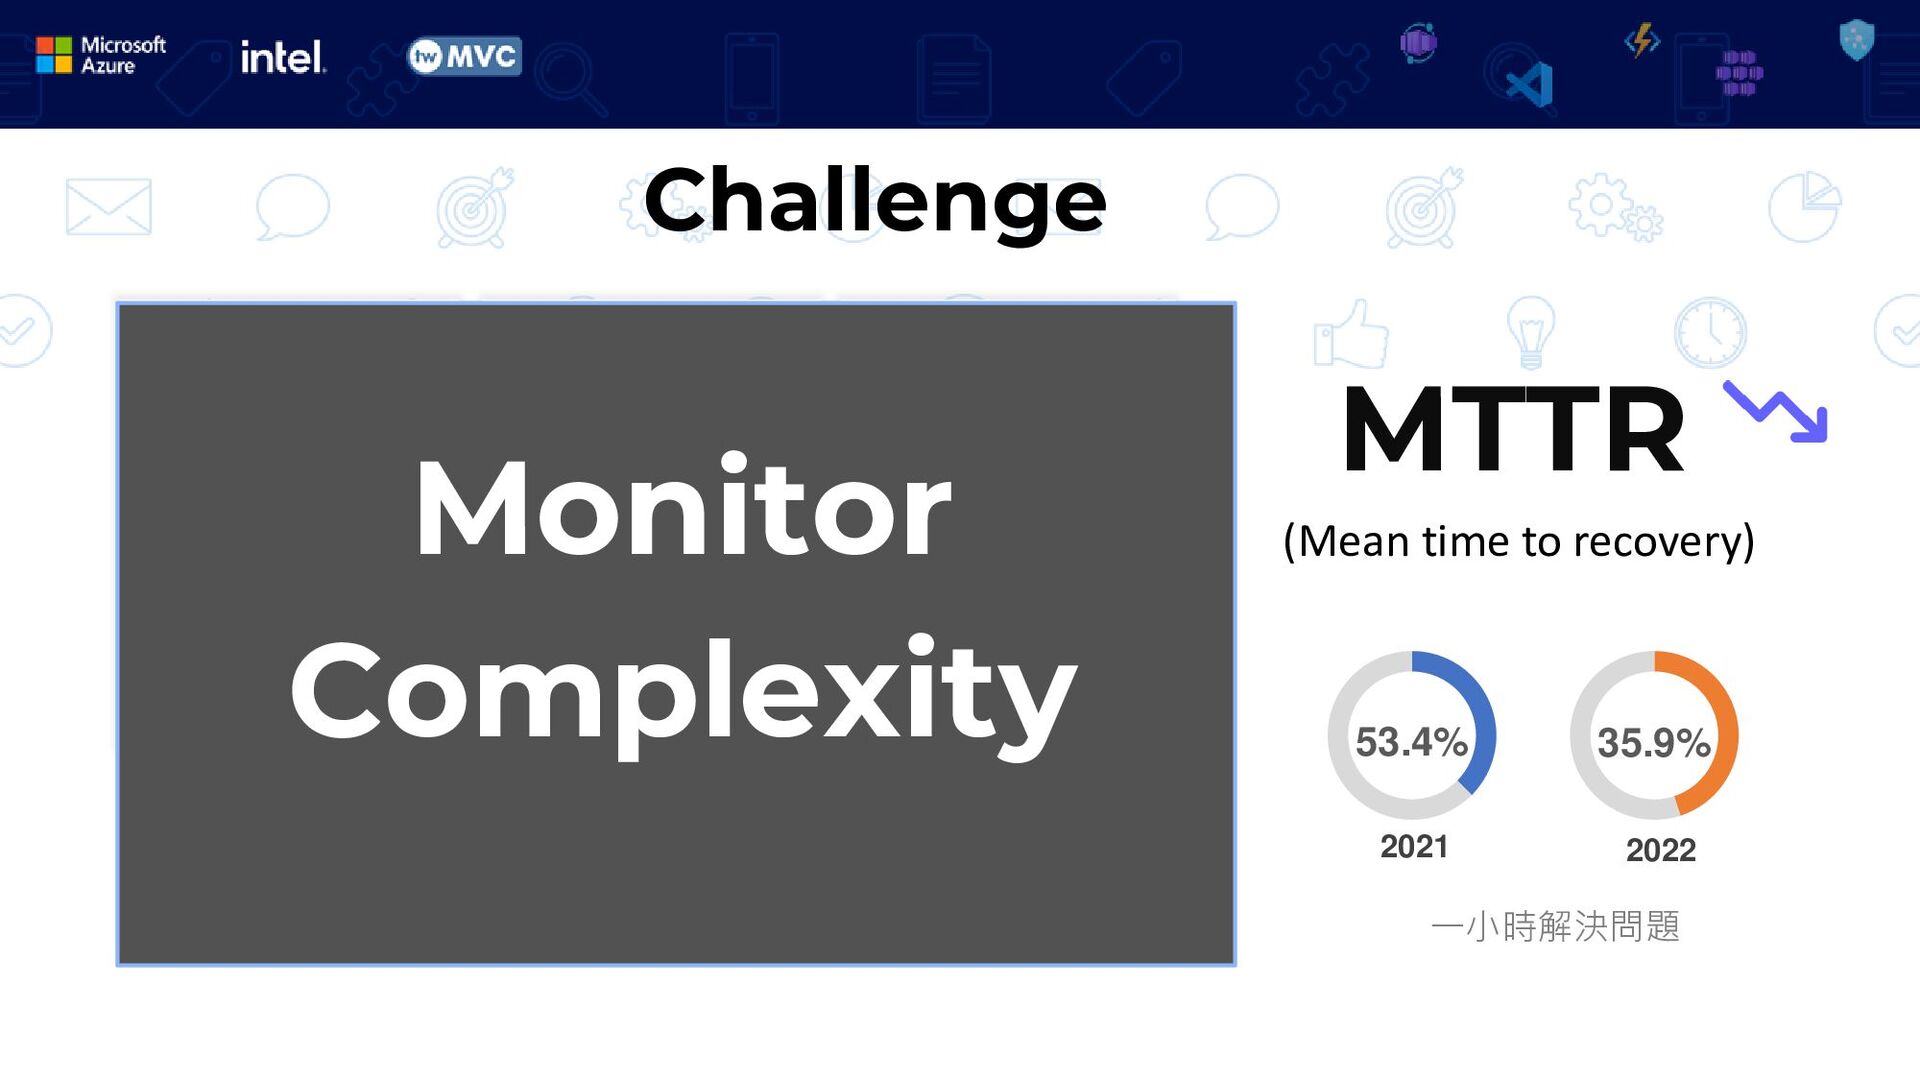
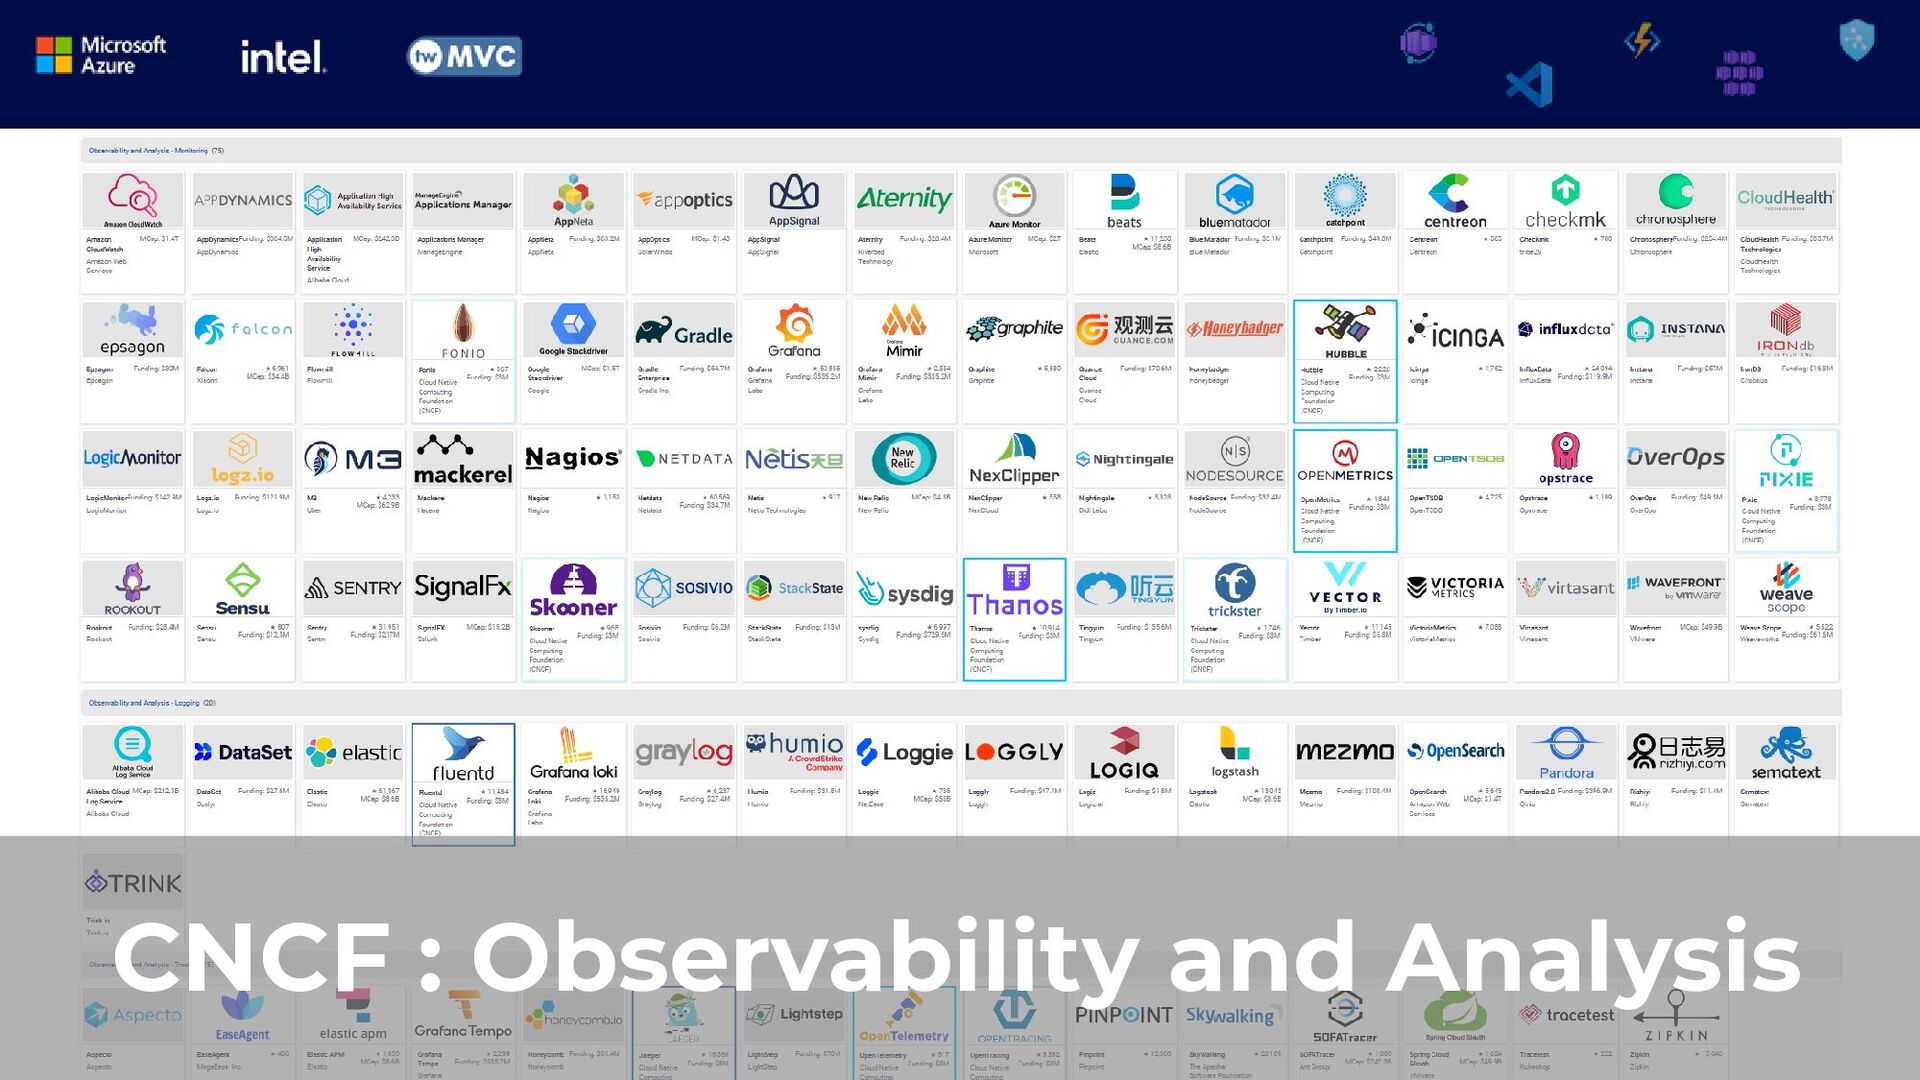
隨著雲端與雲原生(Cloud Native)應用程式的普及,企業在軟體架構的演進與程式開發的速度與越來越快,隨之而來的挑戰是開發人員如何針對這些服務進行更即時的監控(Monitor)。可觀測性(Observability)議題在近幾年越來越多人在討論,甚至在 CNCF 還有專區介紹 Observability 相關的工具,可觀測性與監控到底有何不同?開發人員與SRE團隊該如何迎接雲原生應用的挑戰?這議程將會以淺顯易懂方式和與會者分享以下內容
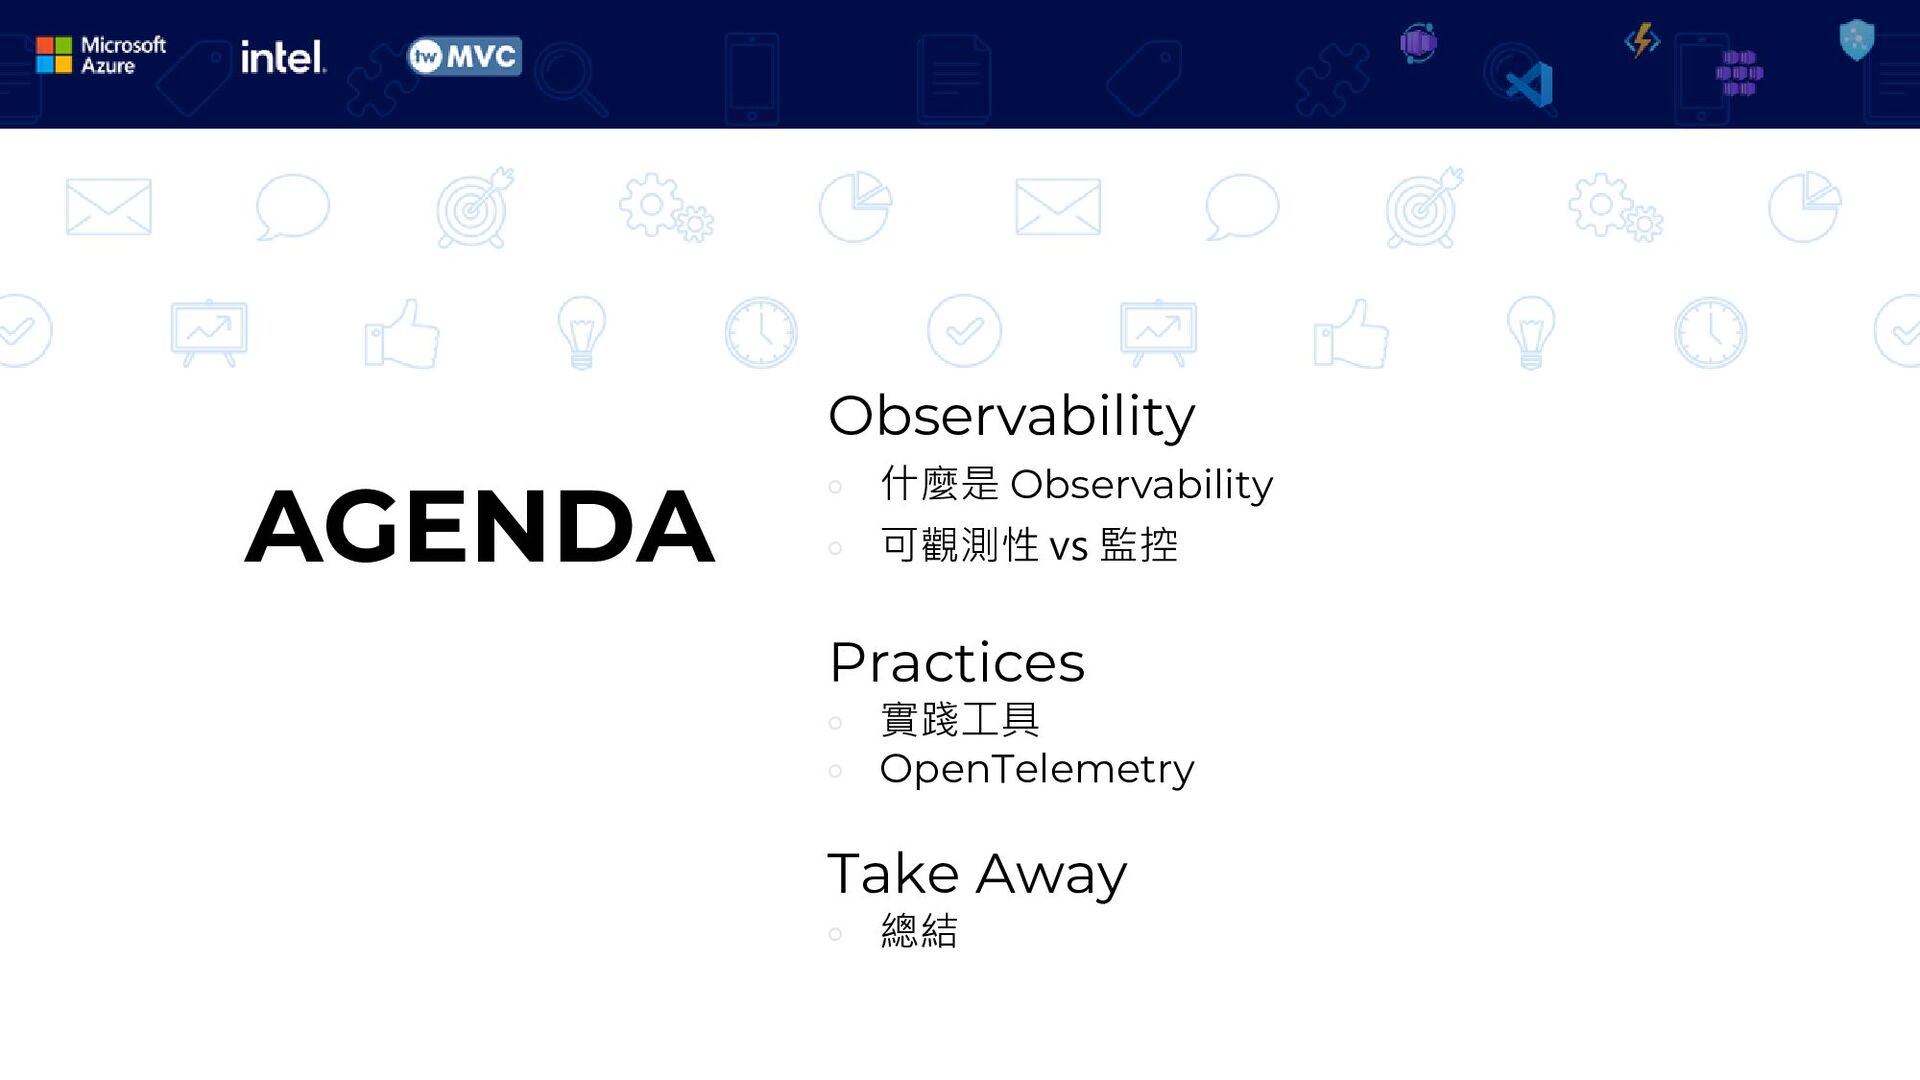
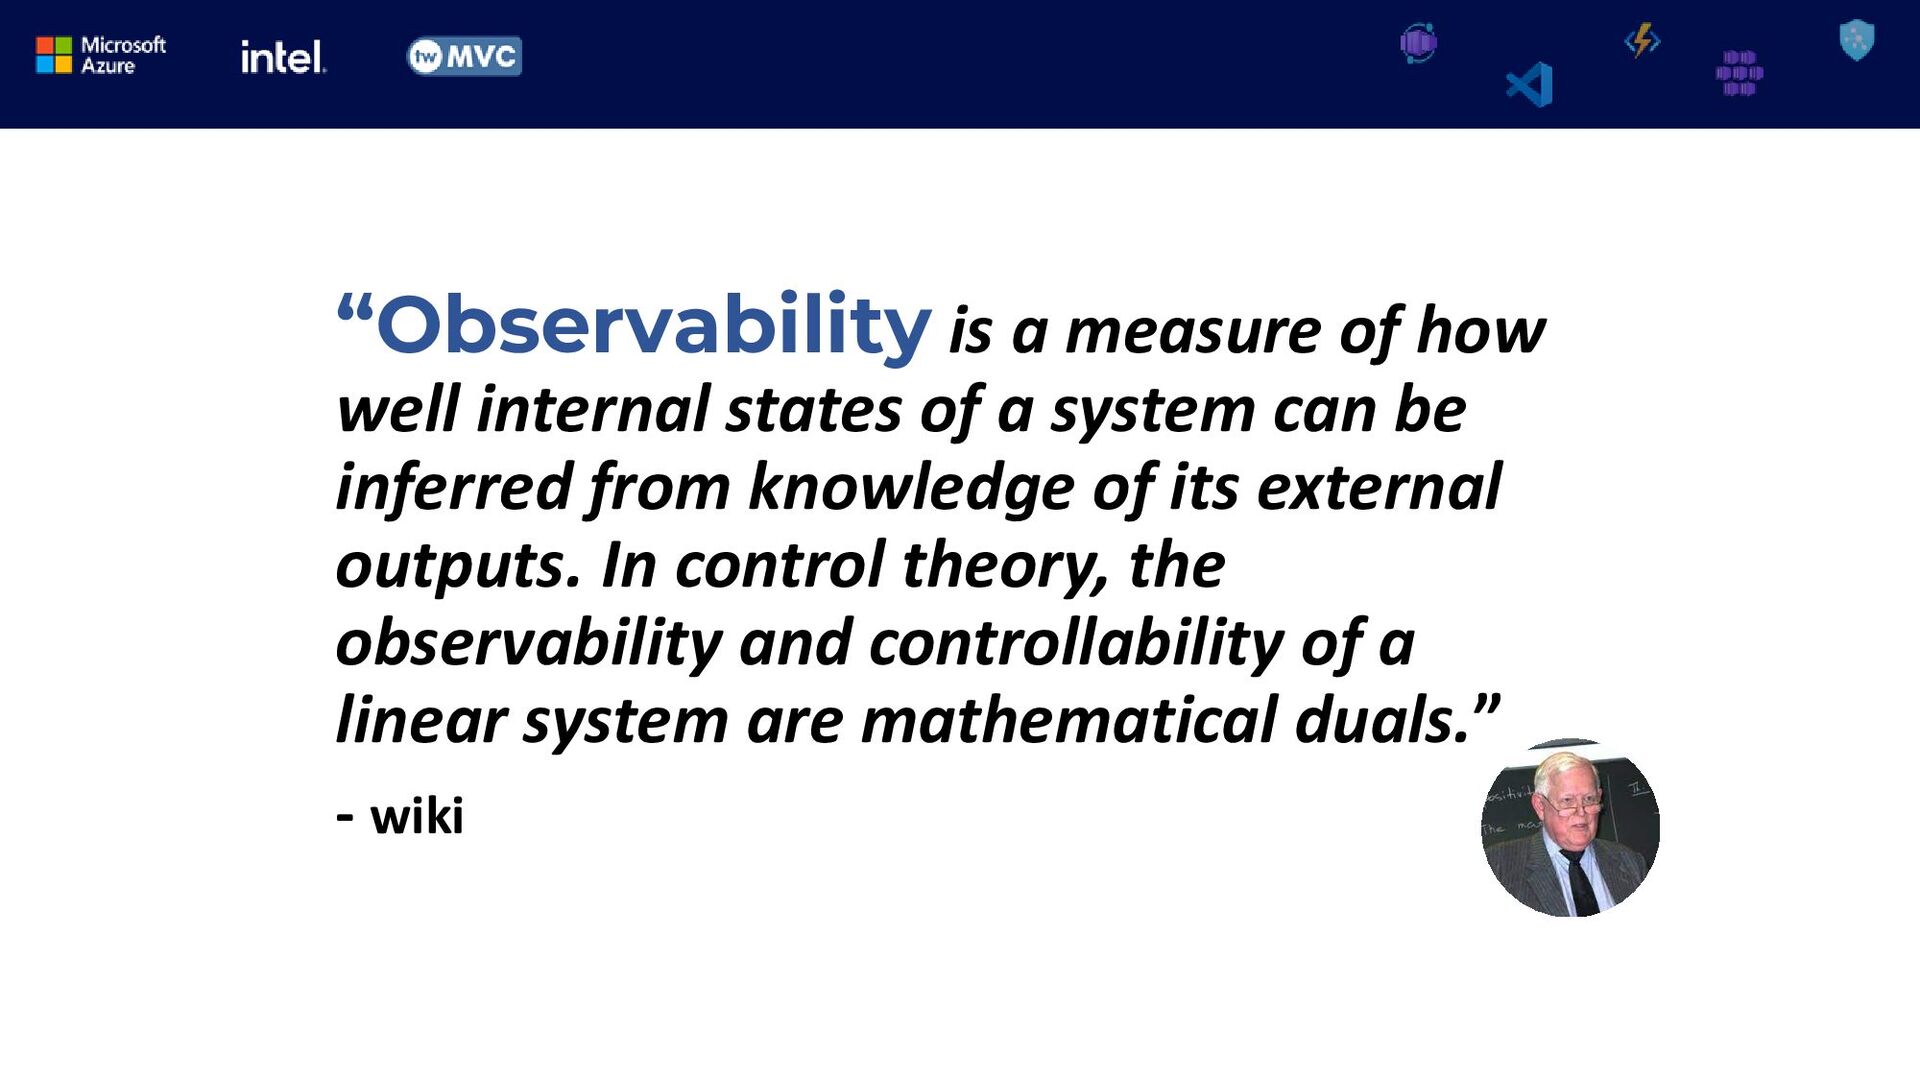
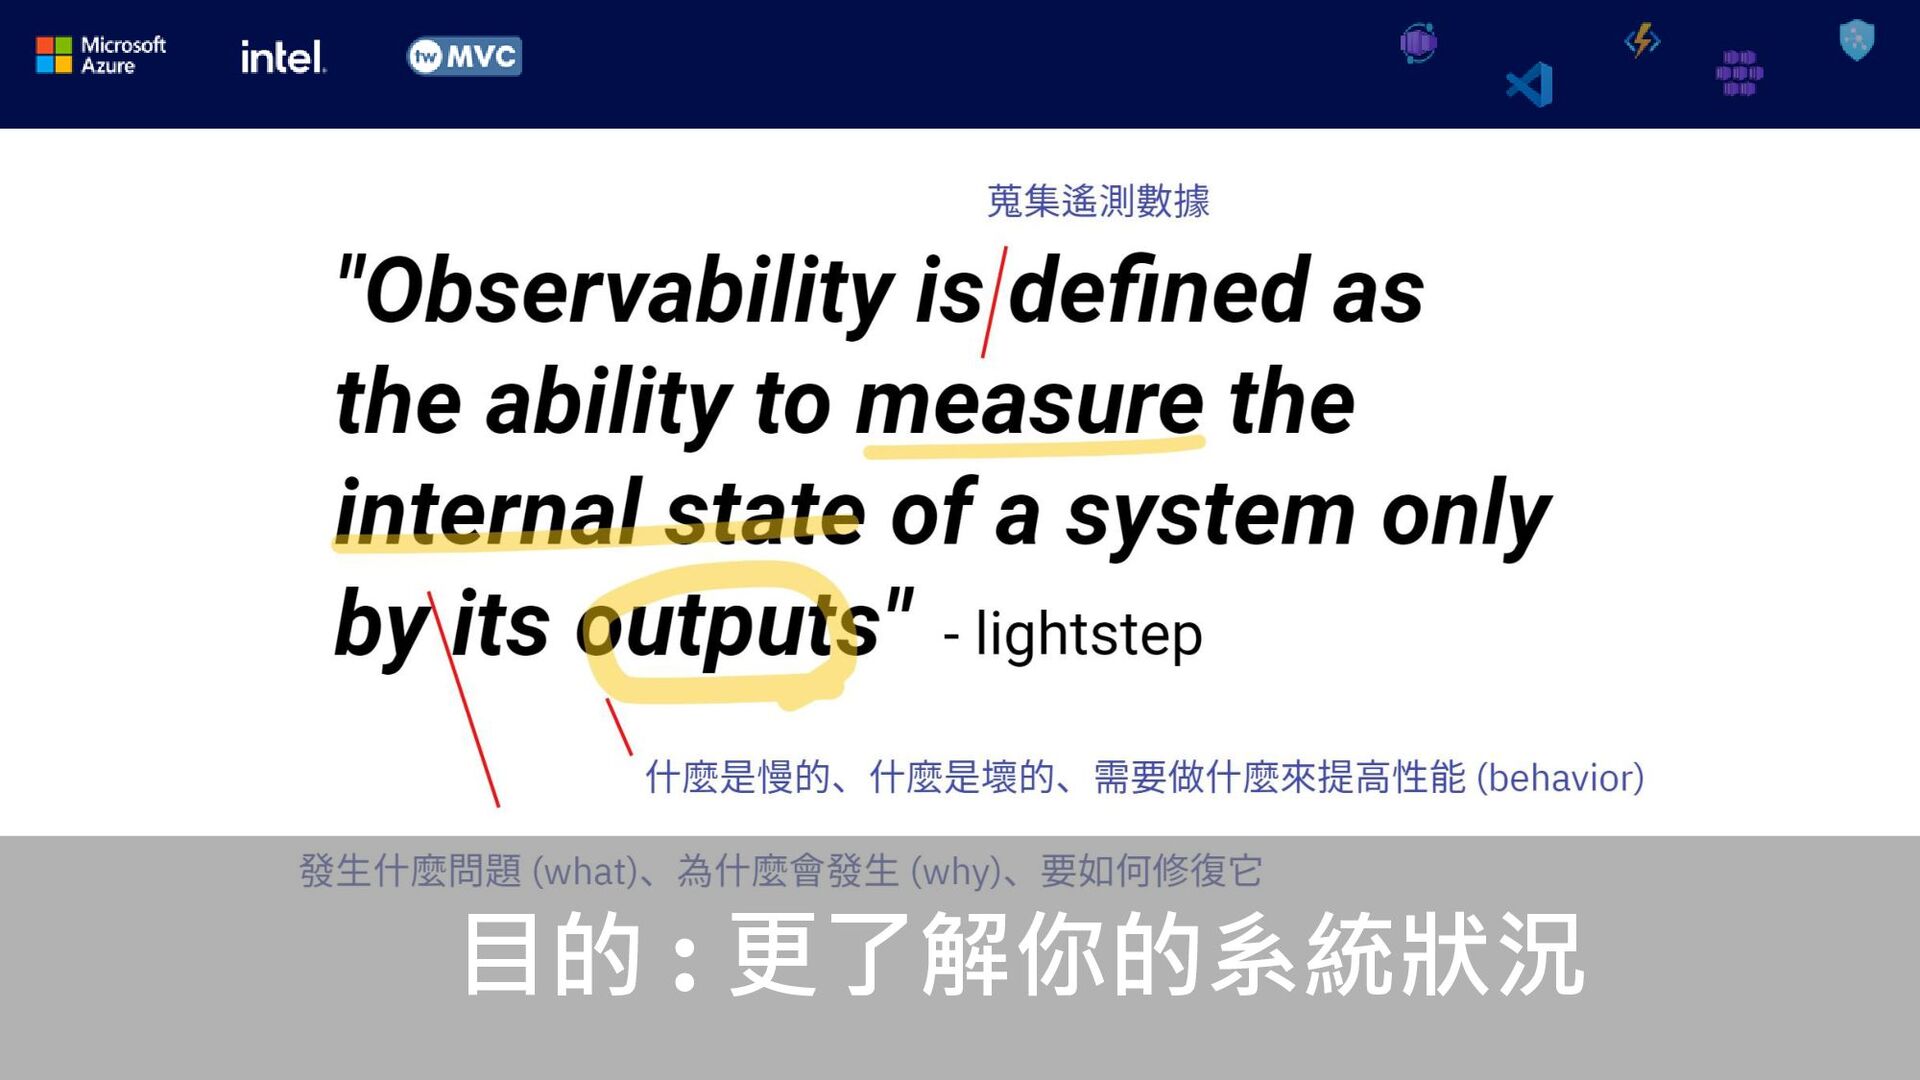
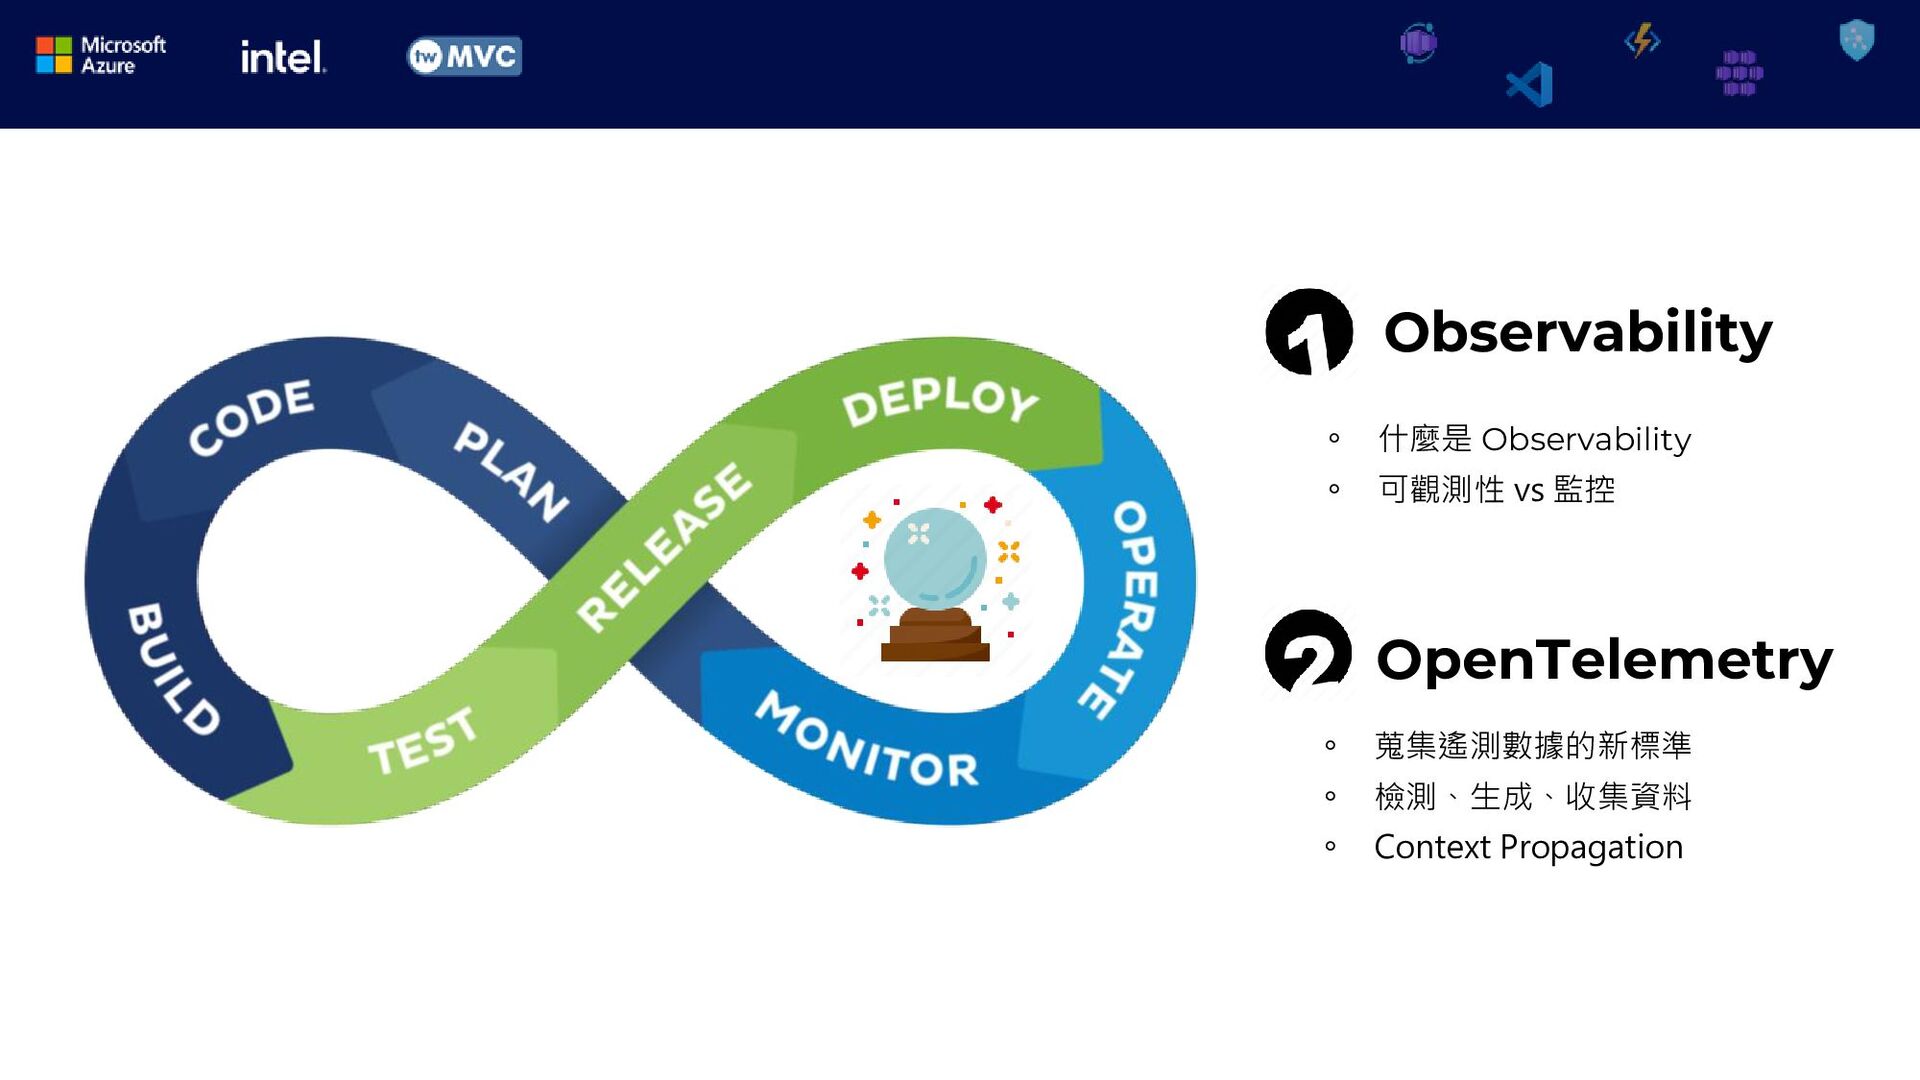
- 什麼是 Observability?
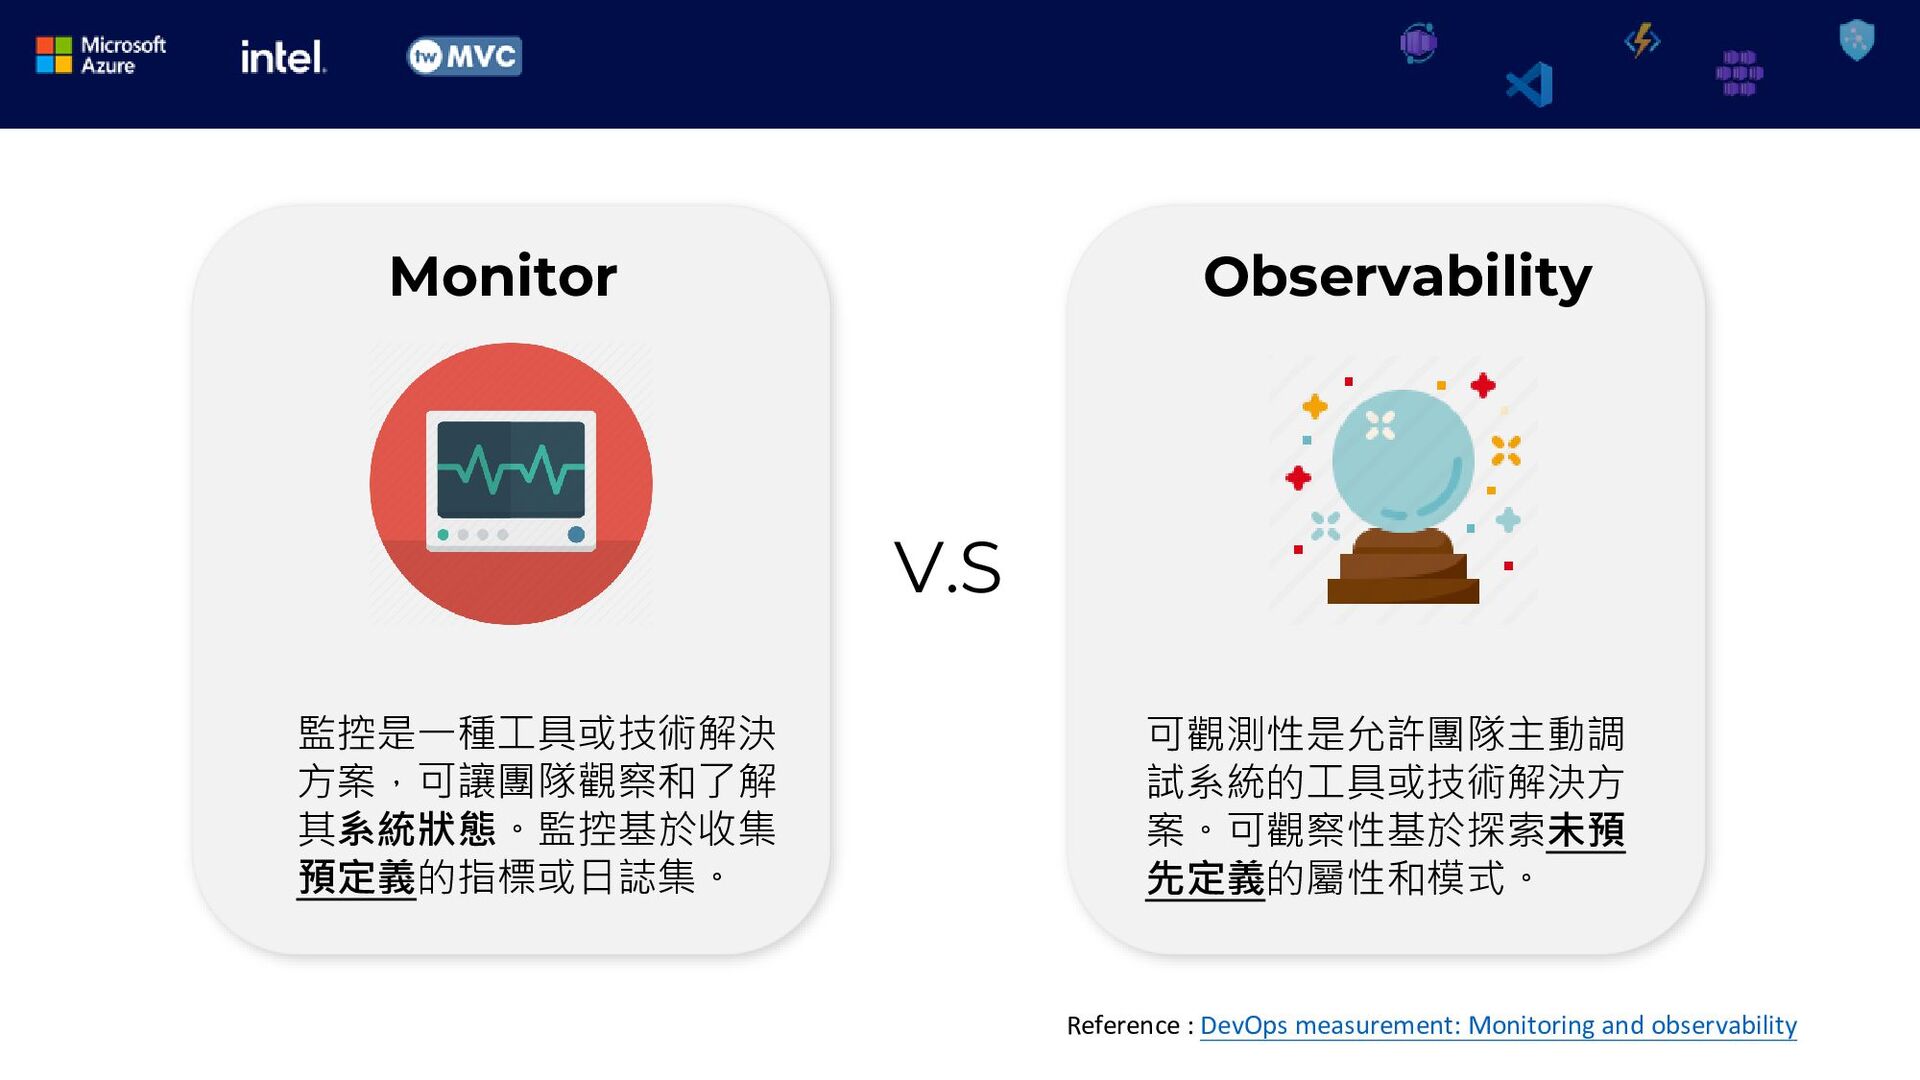
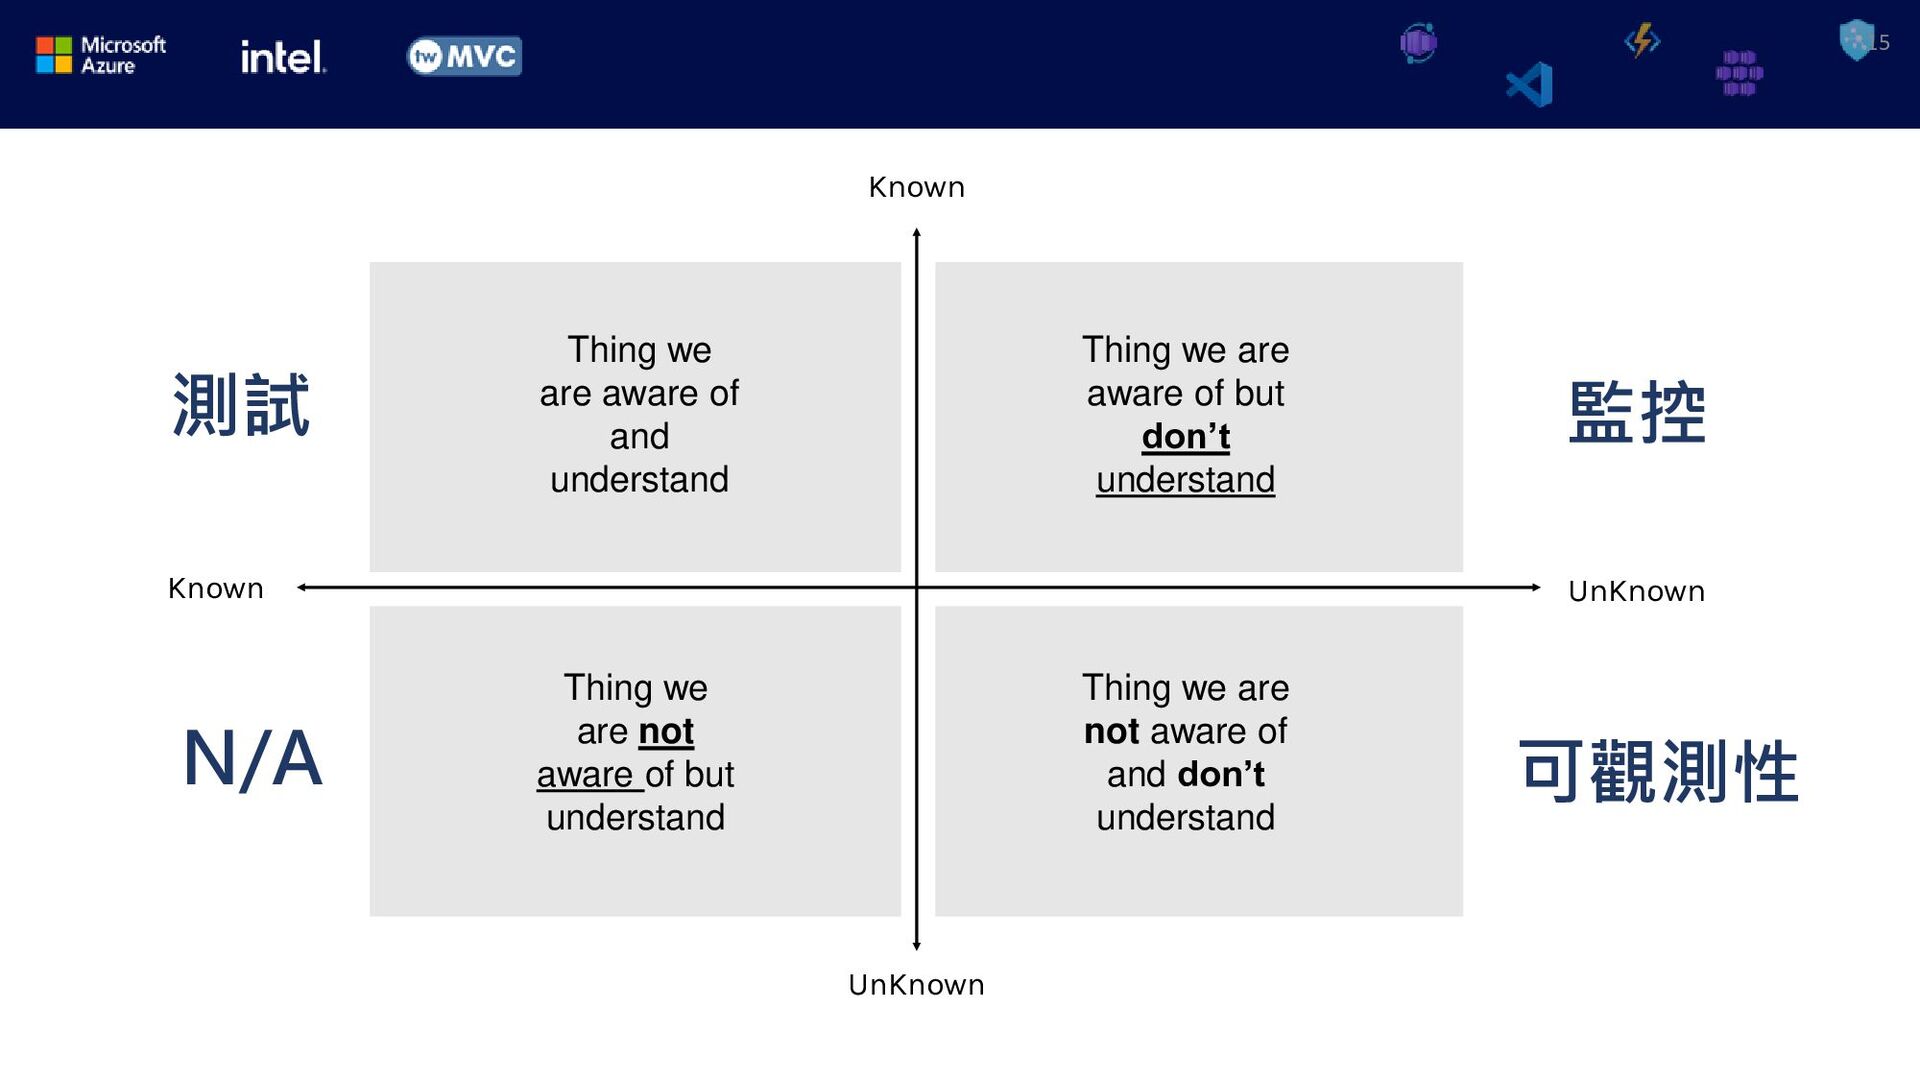
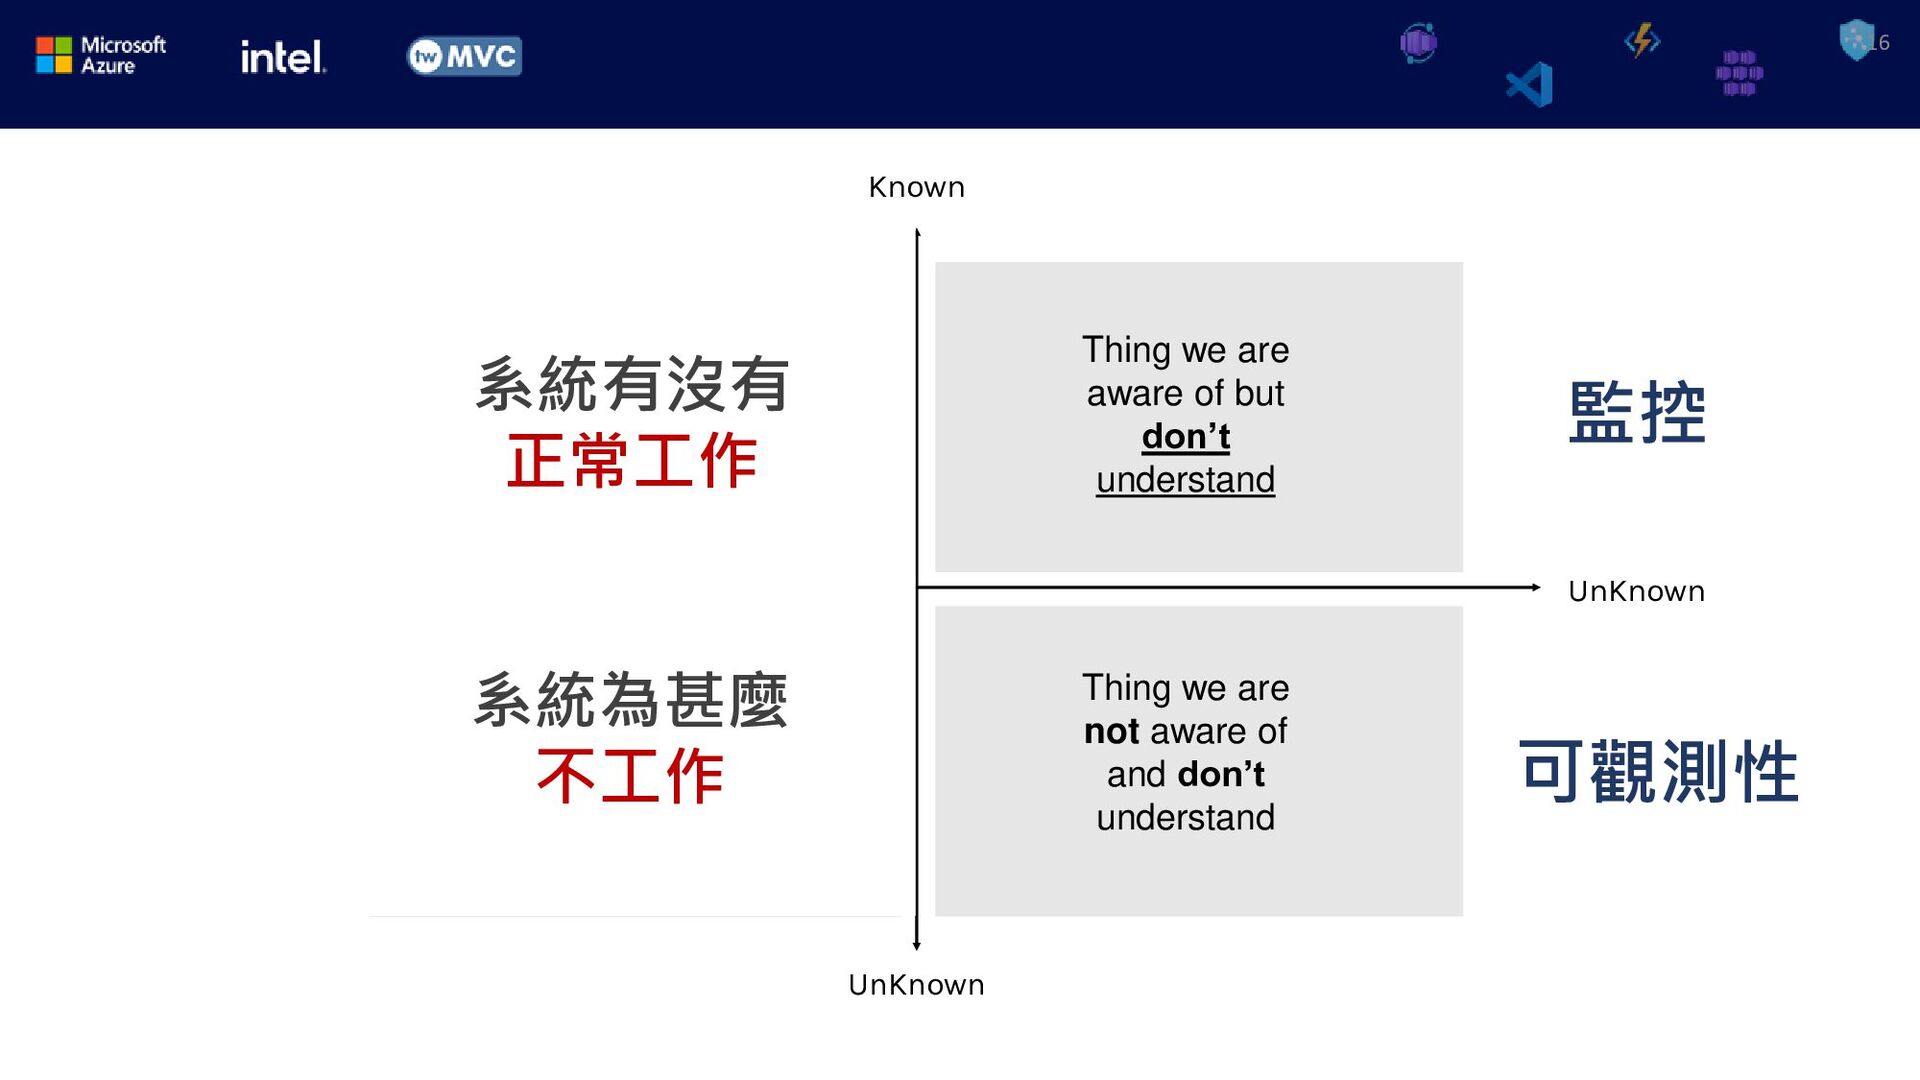
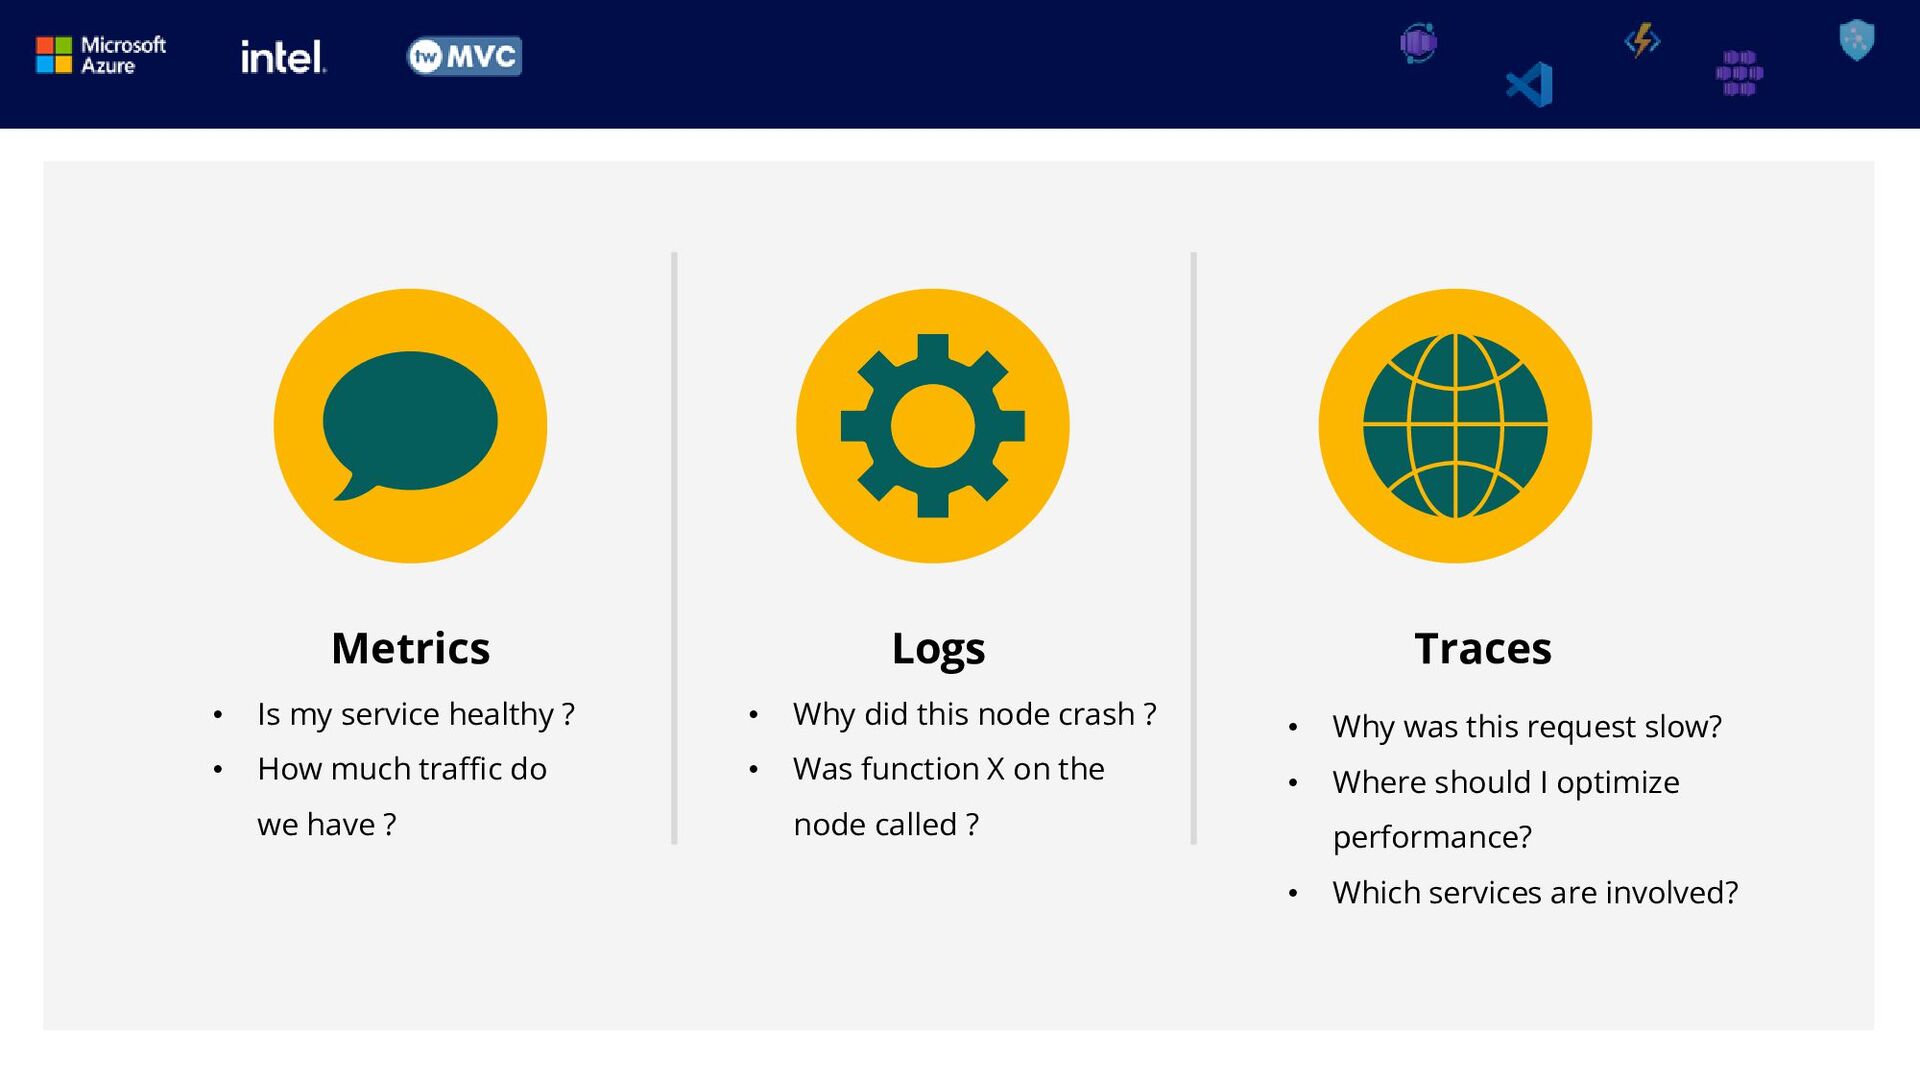
- 可觀測性 vs 監控
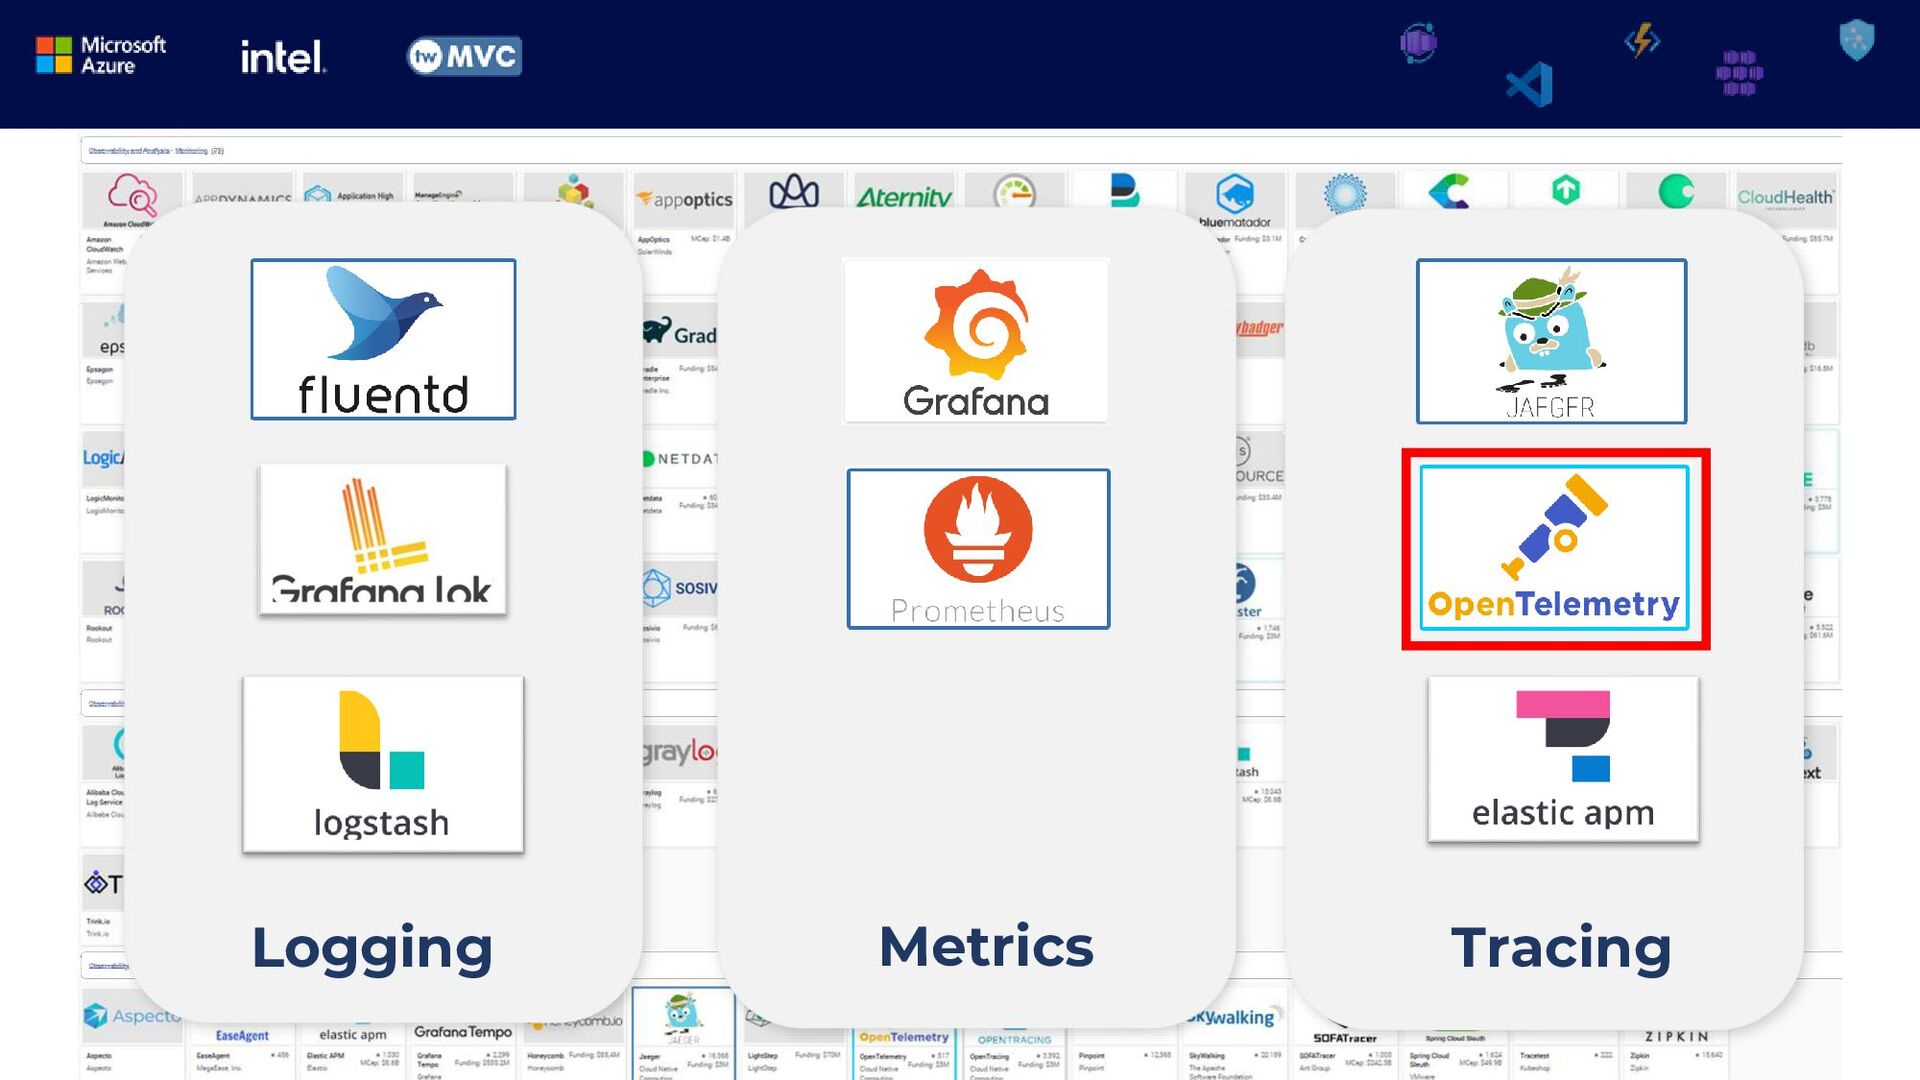
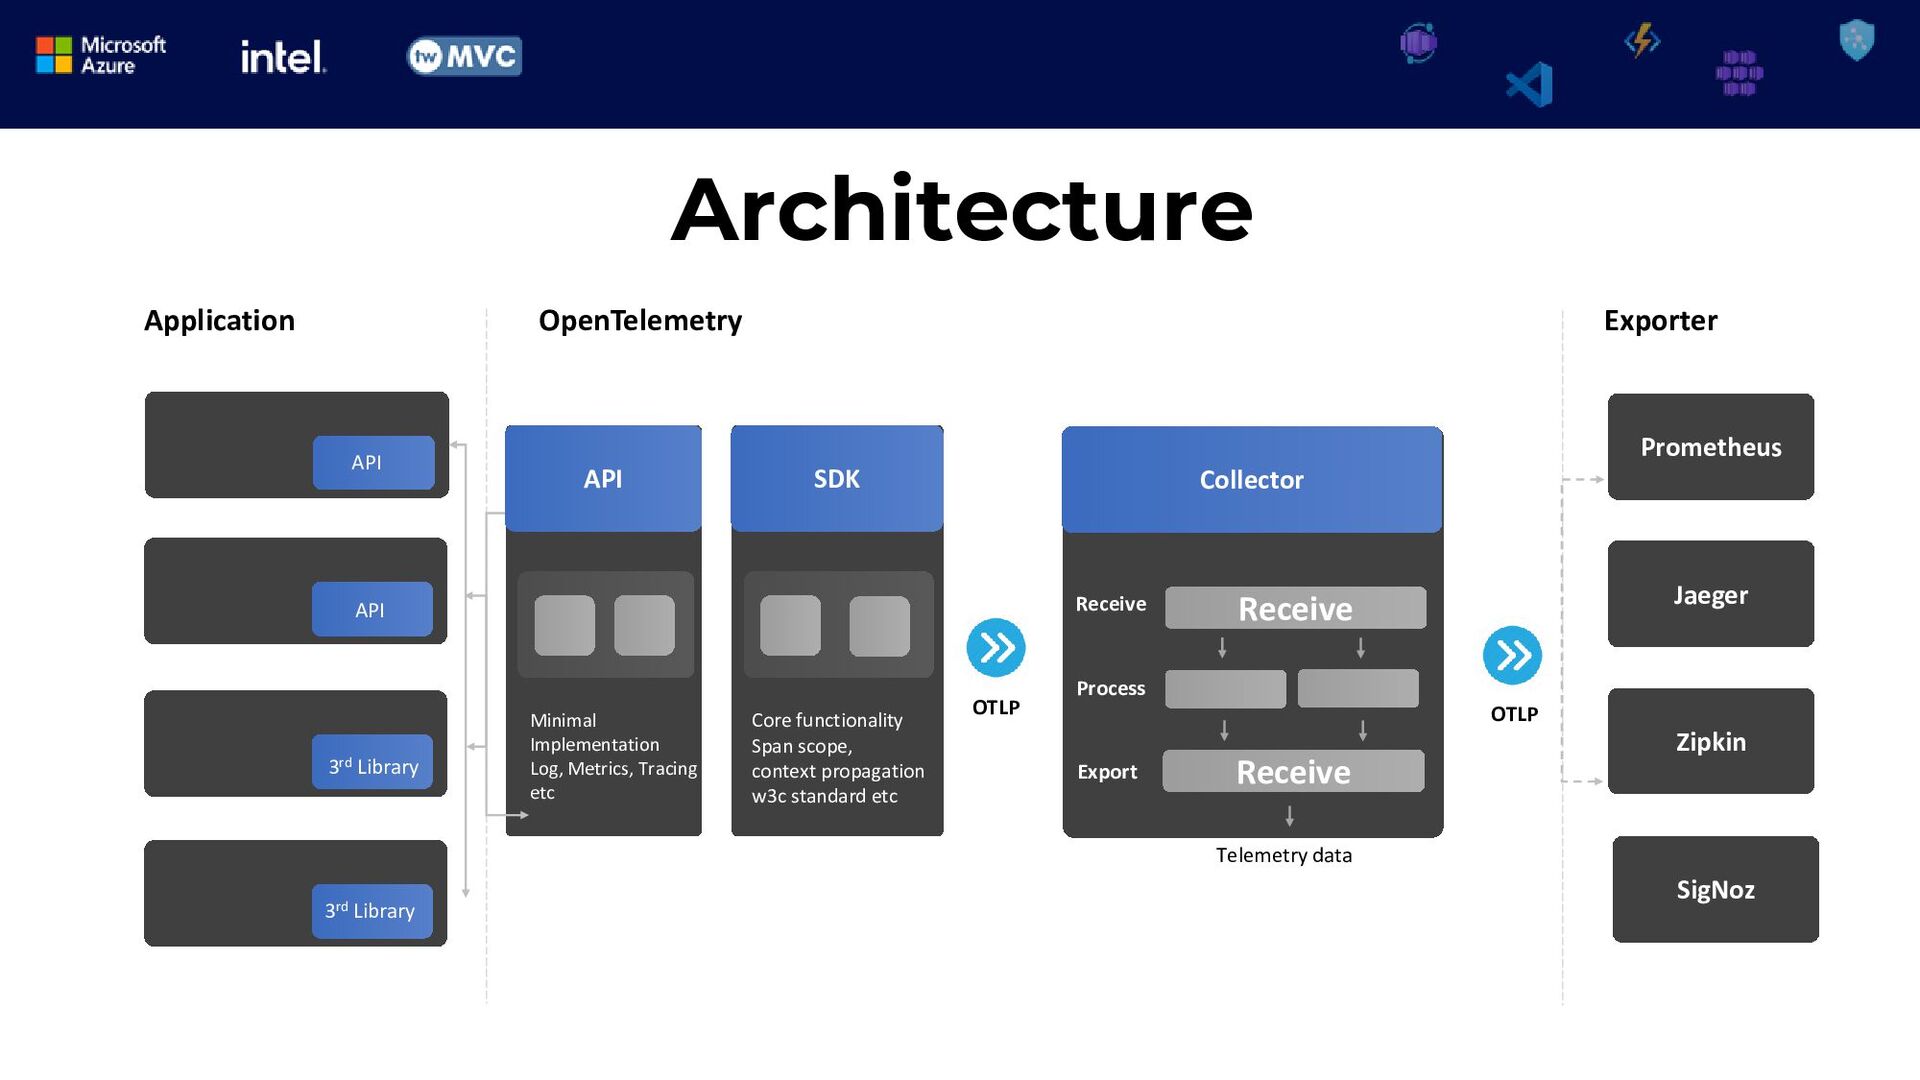
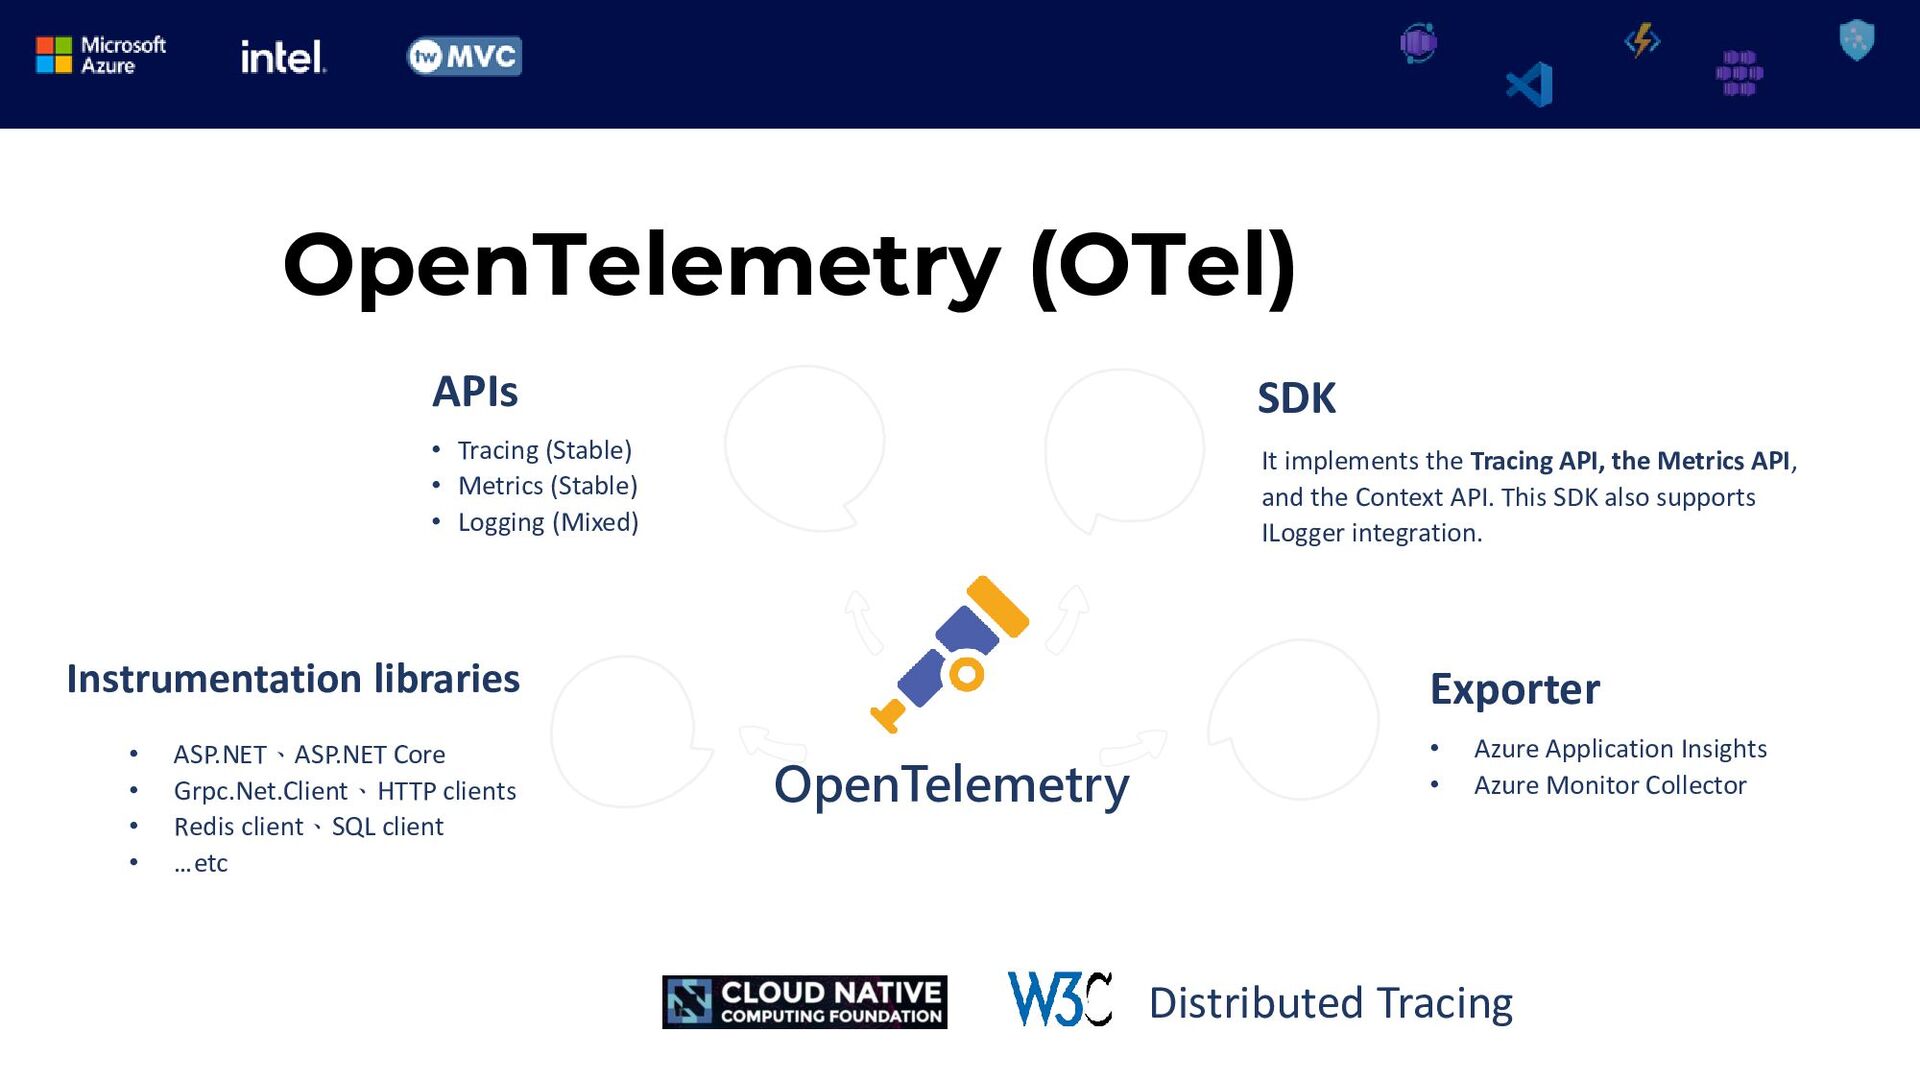
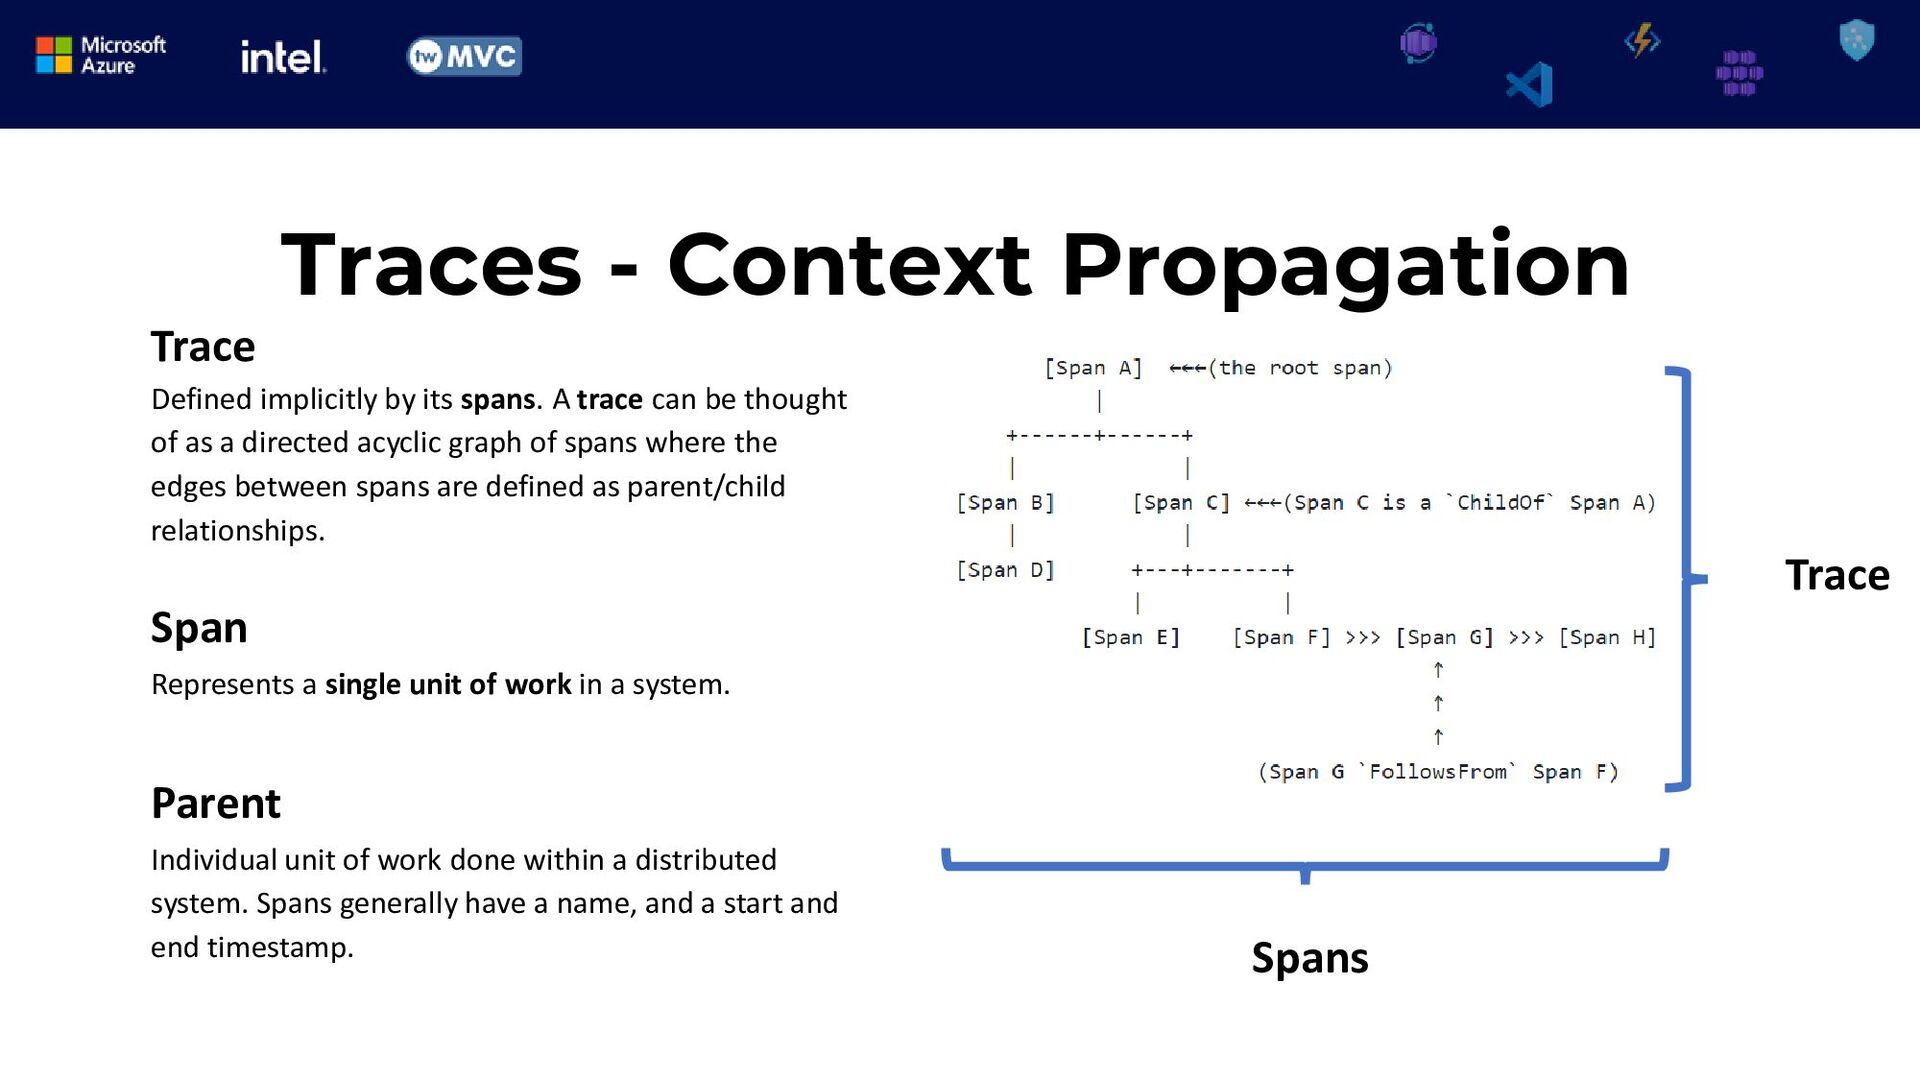
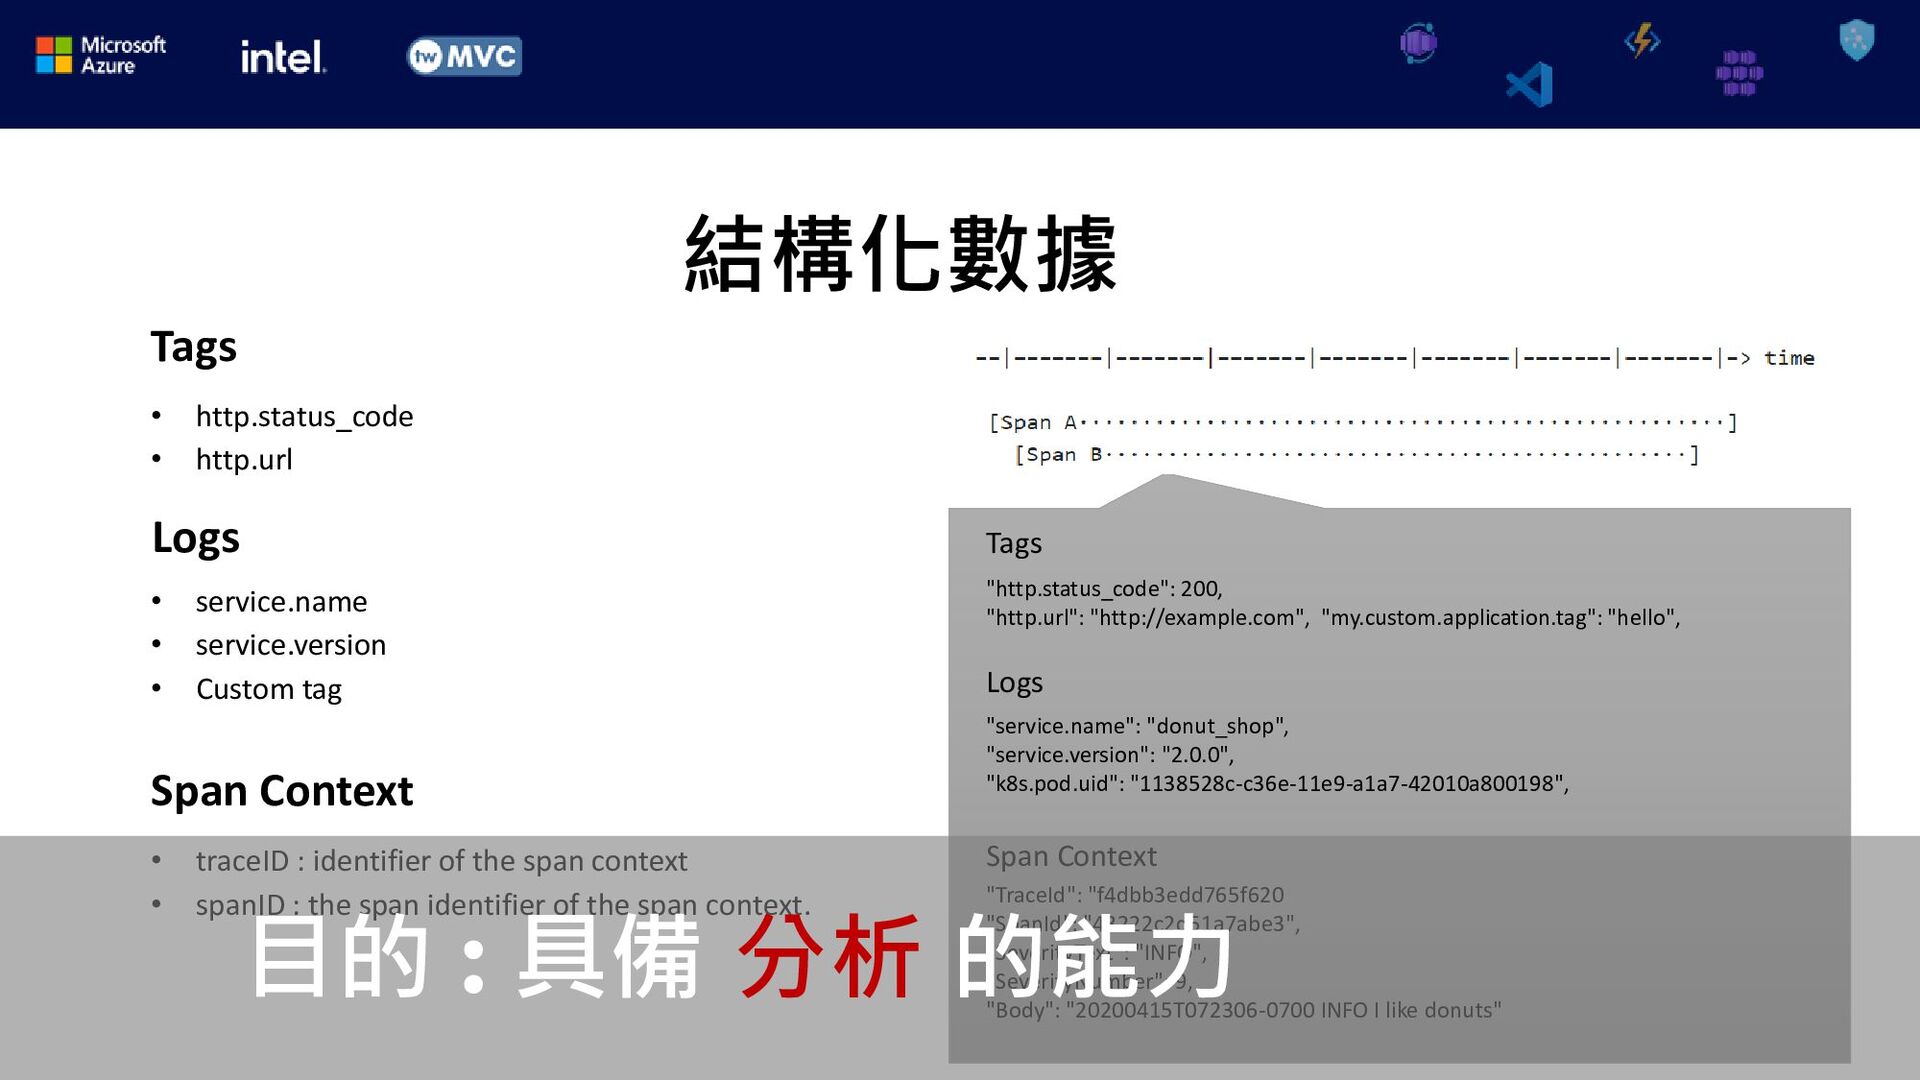
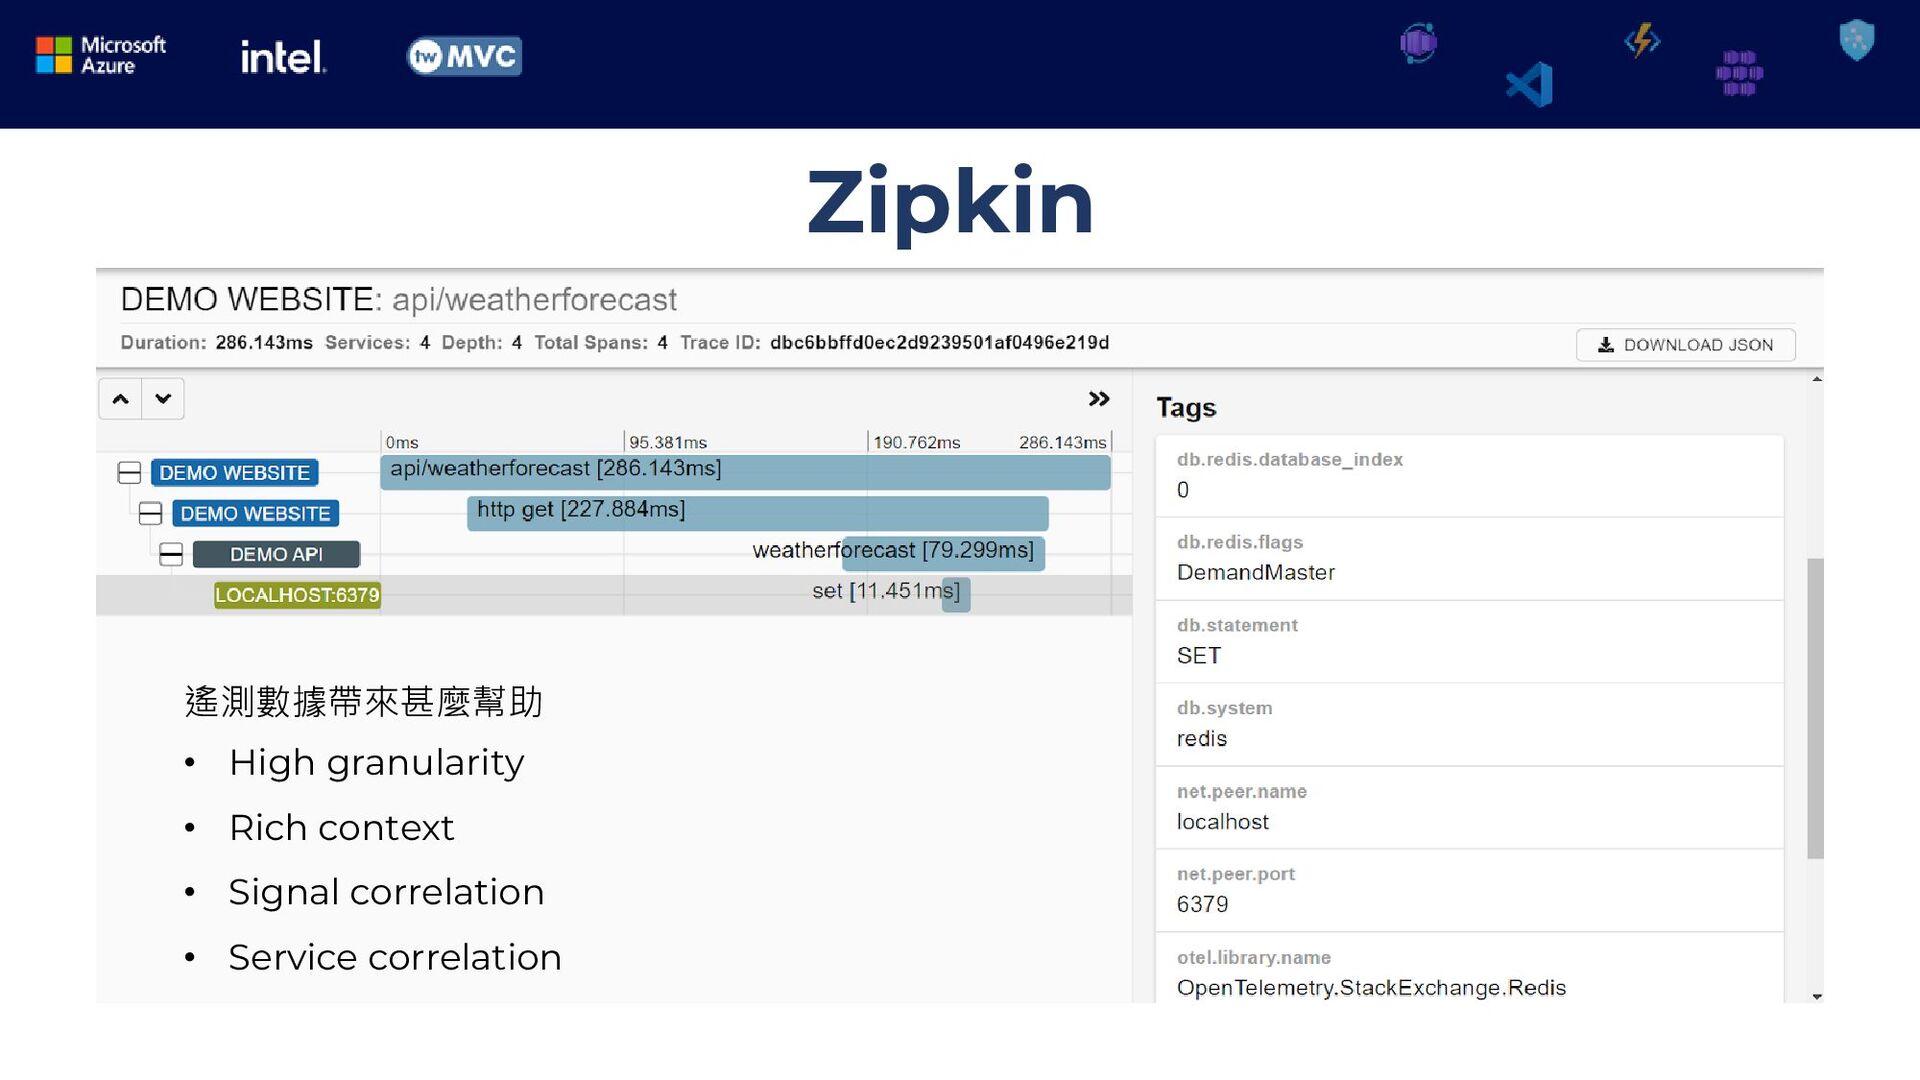
- 鏈路追蹤工具:OpenTelemetry