Upgrade to Pro — share decks privately, control downloads, hide ads and more …

再不使用 APM 就芭比Q 了

Marcus
December 18, 2022

再不使用 APM 就芭比Q 了

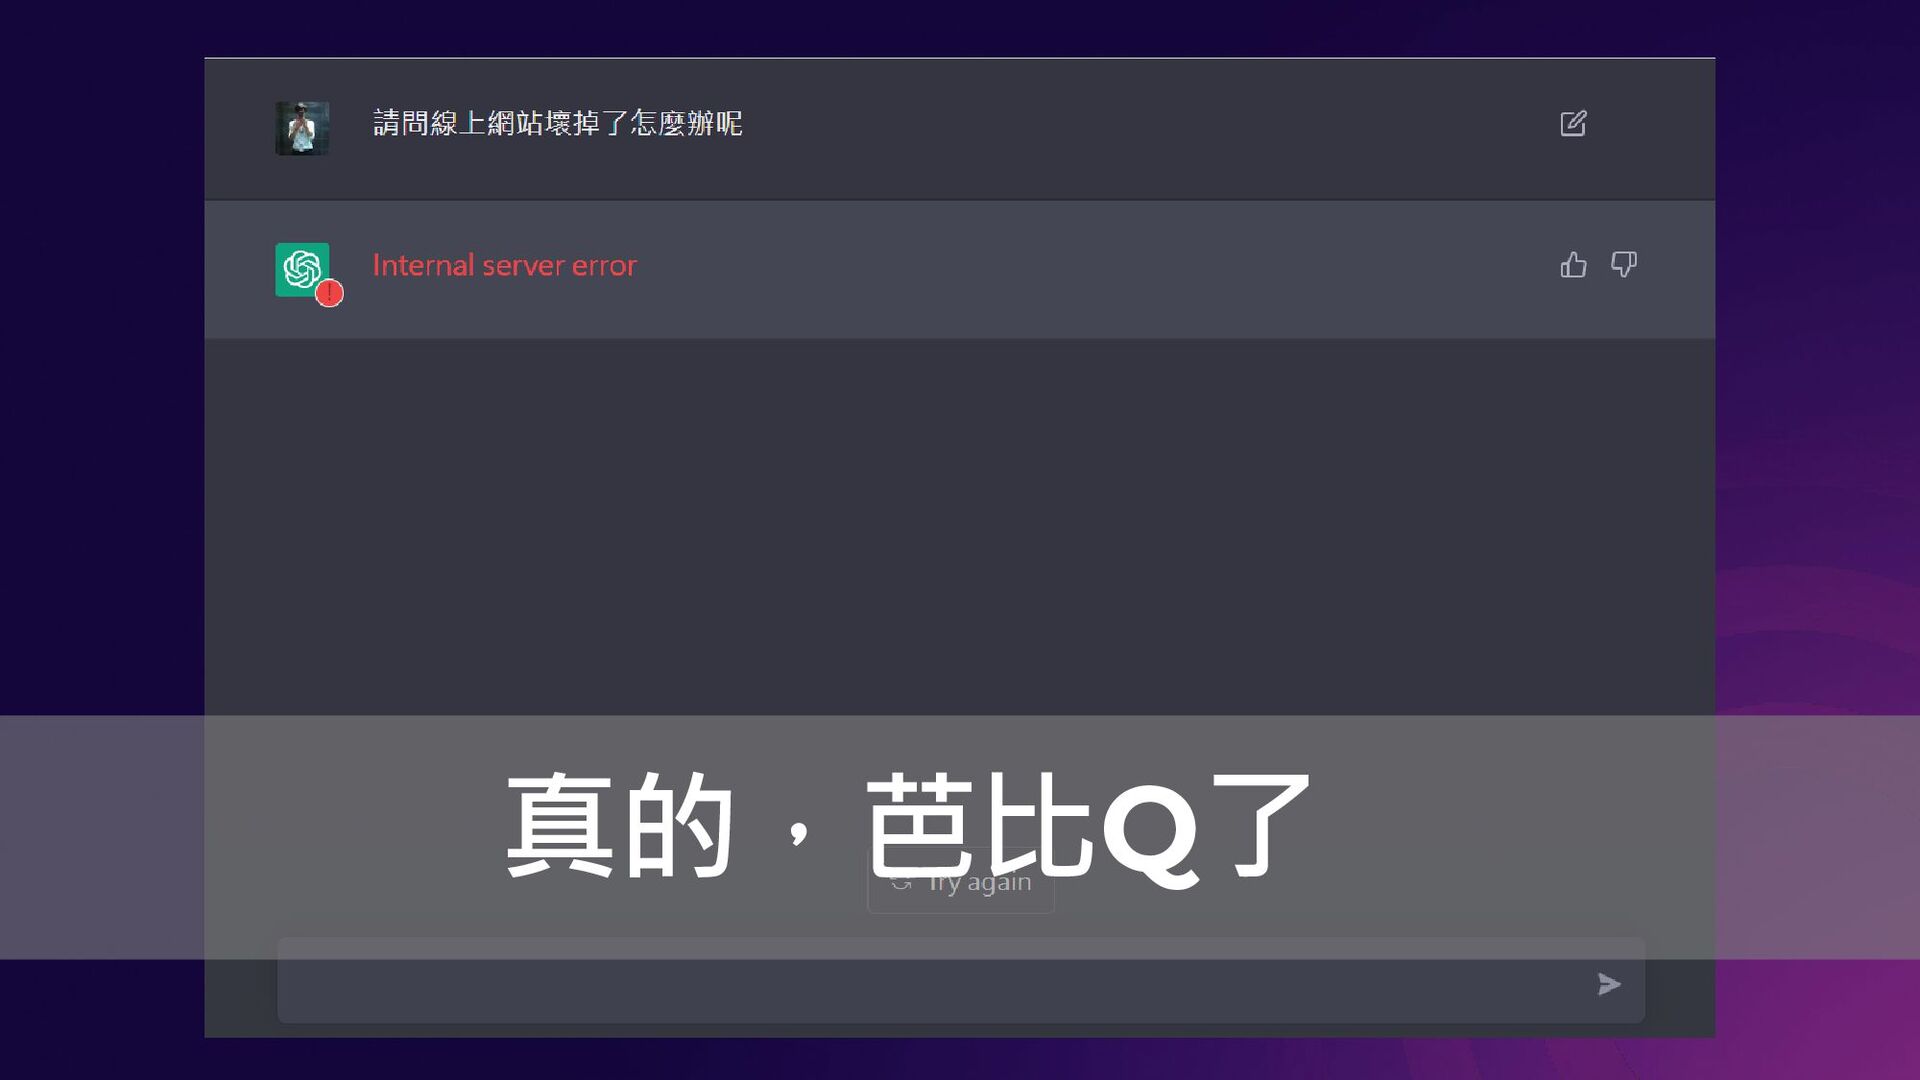
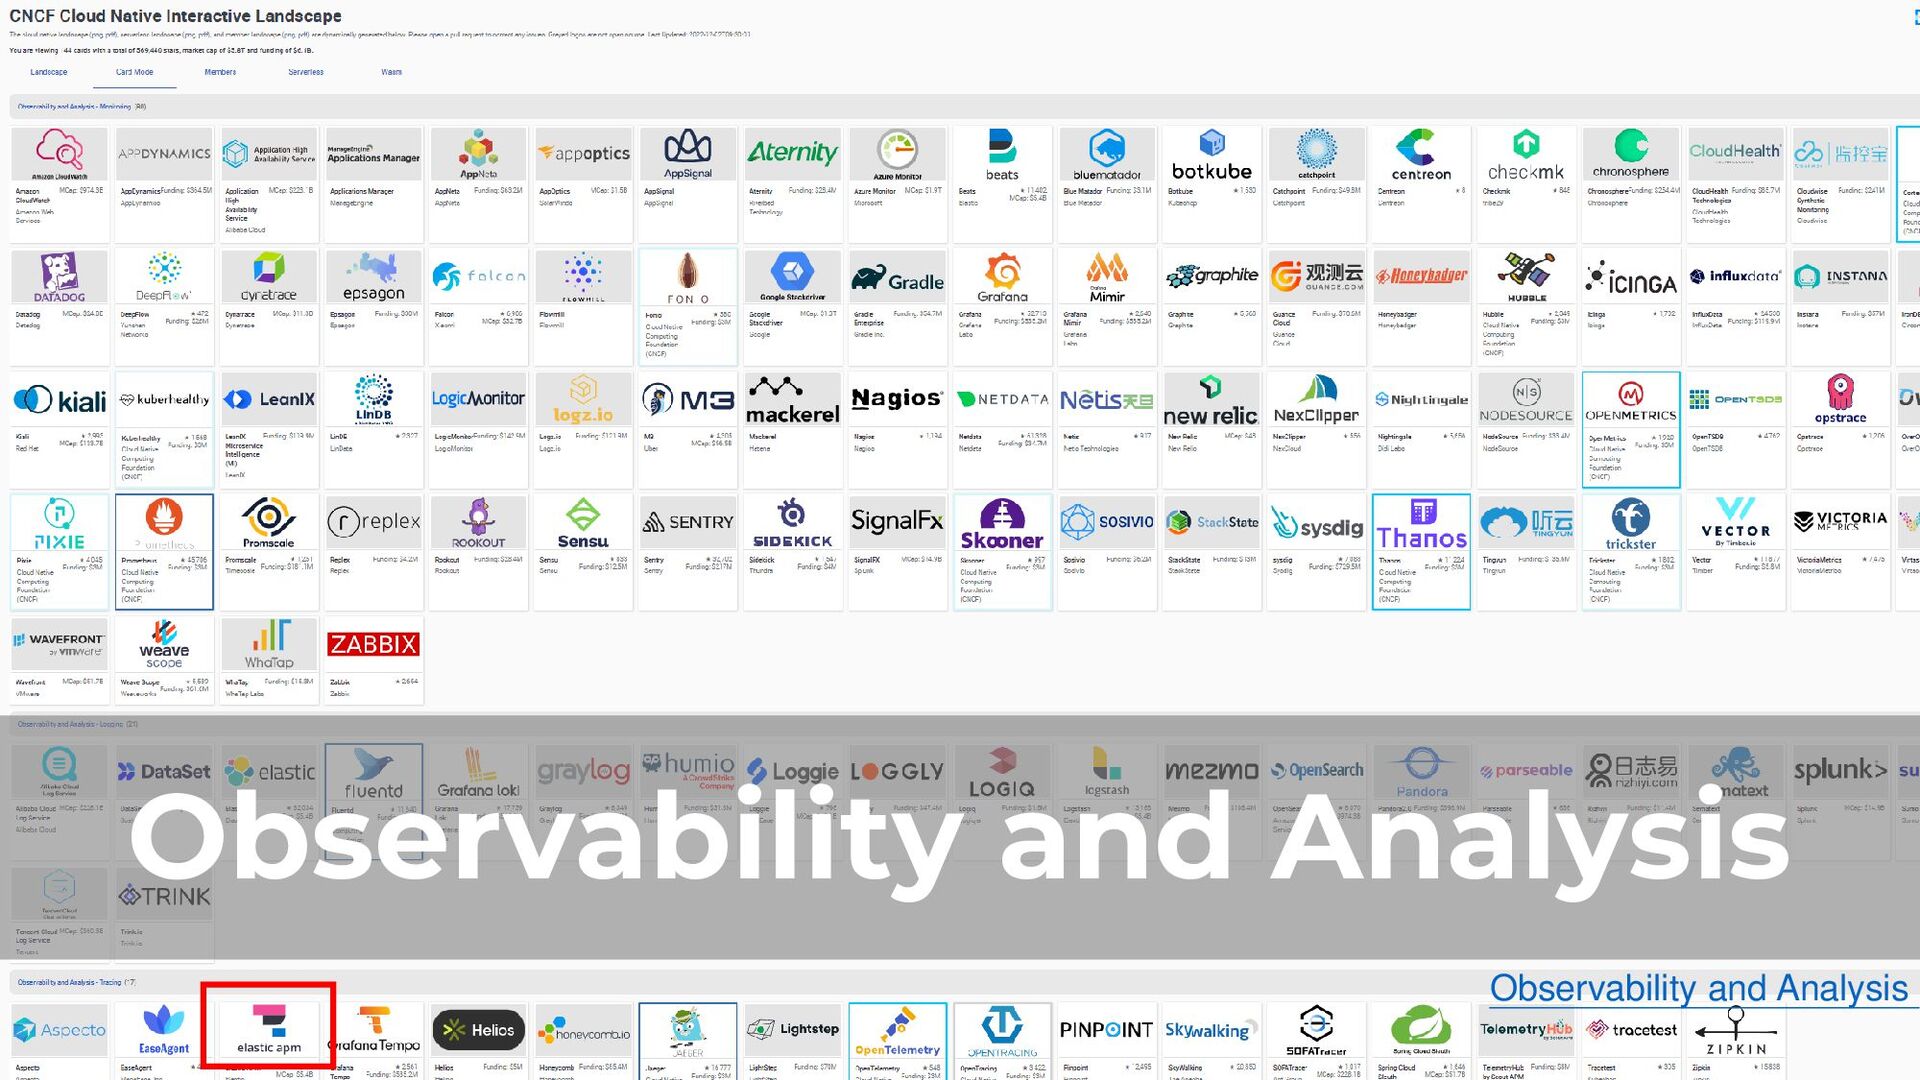
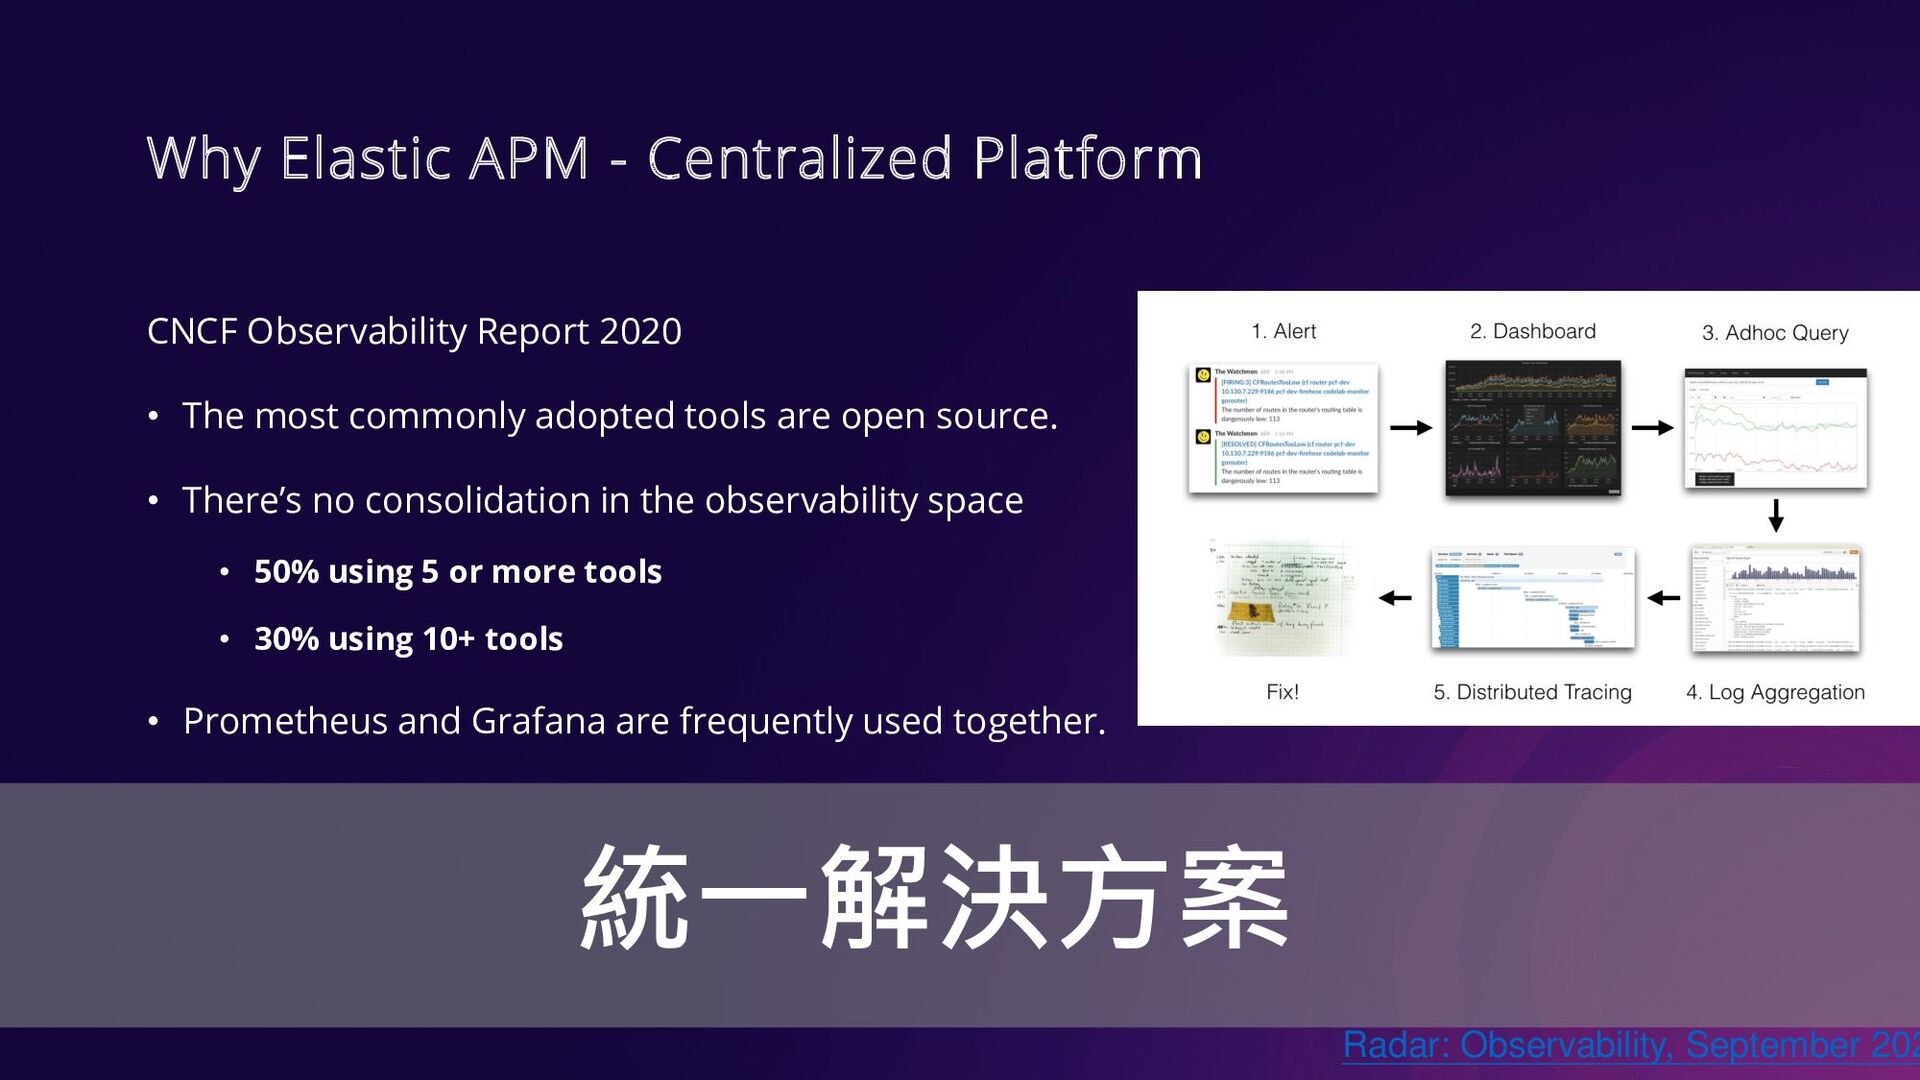
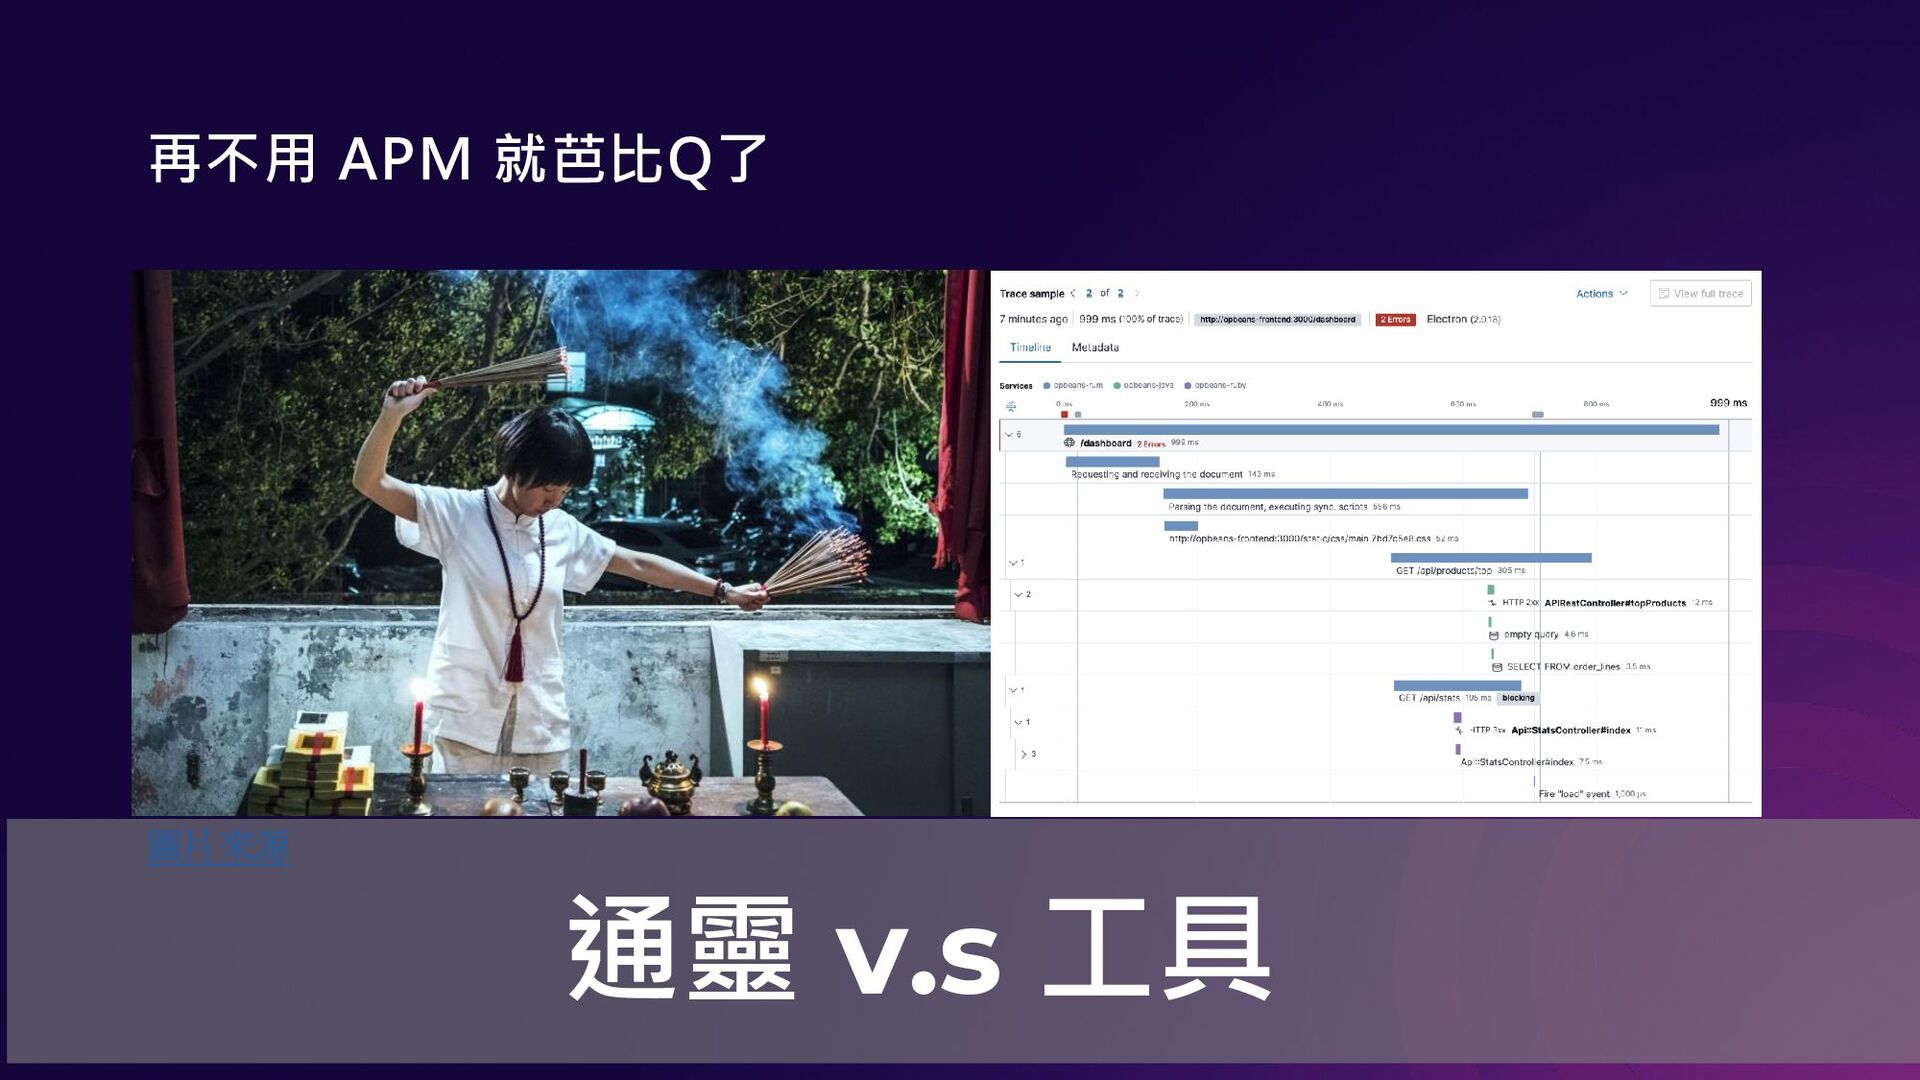
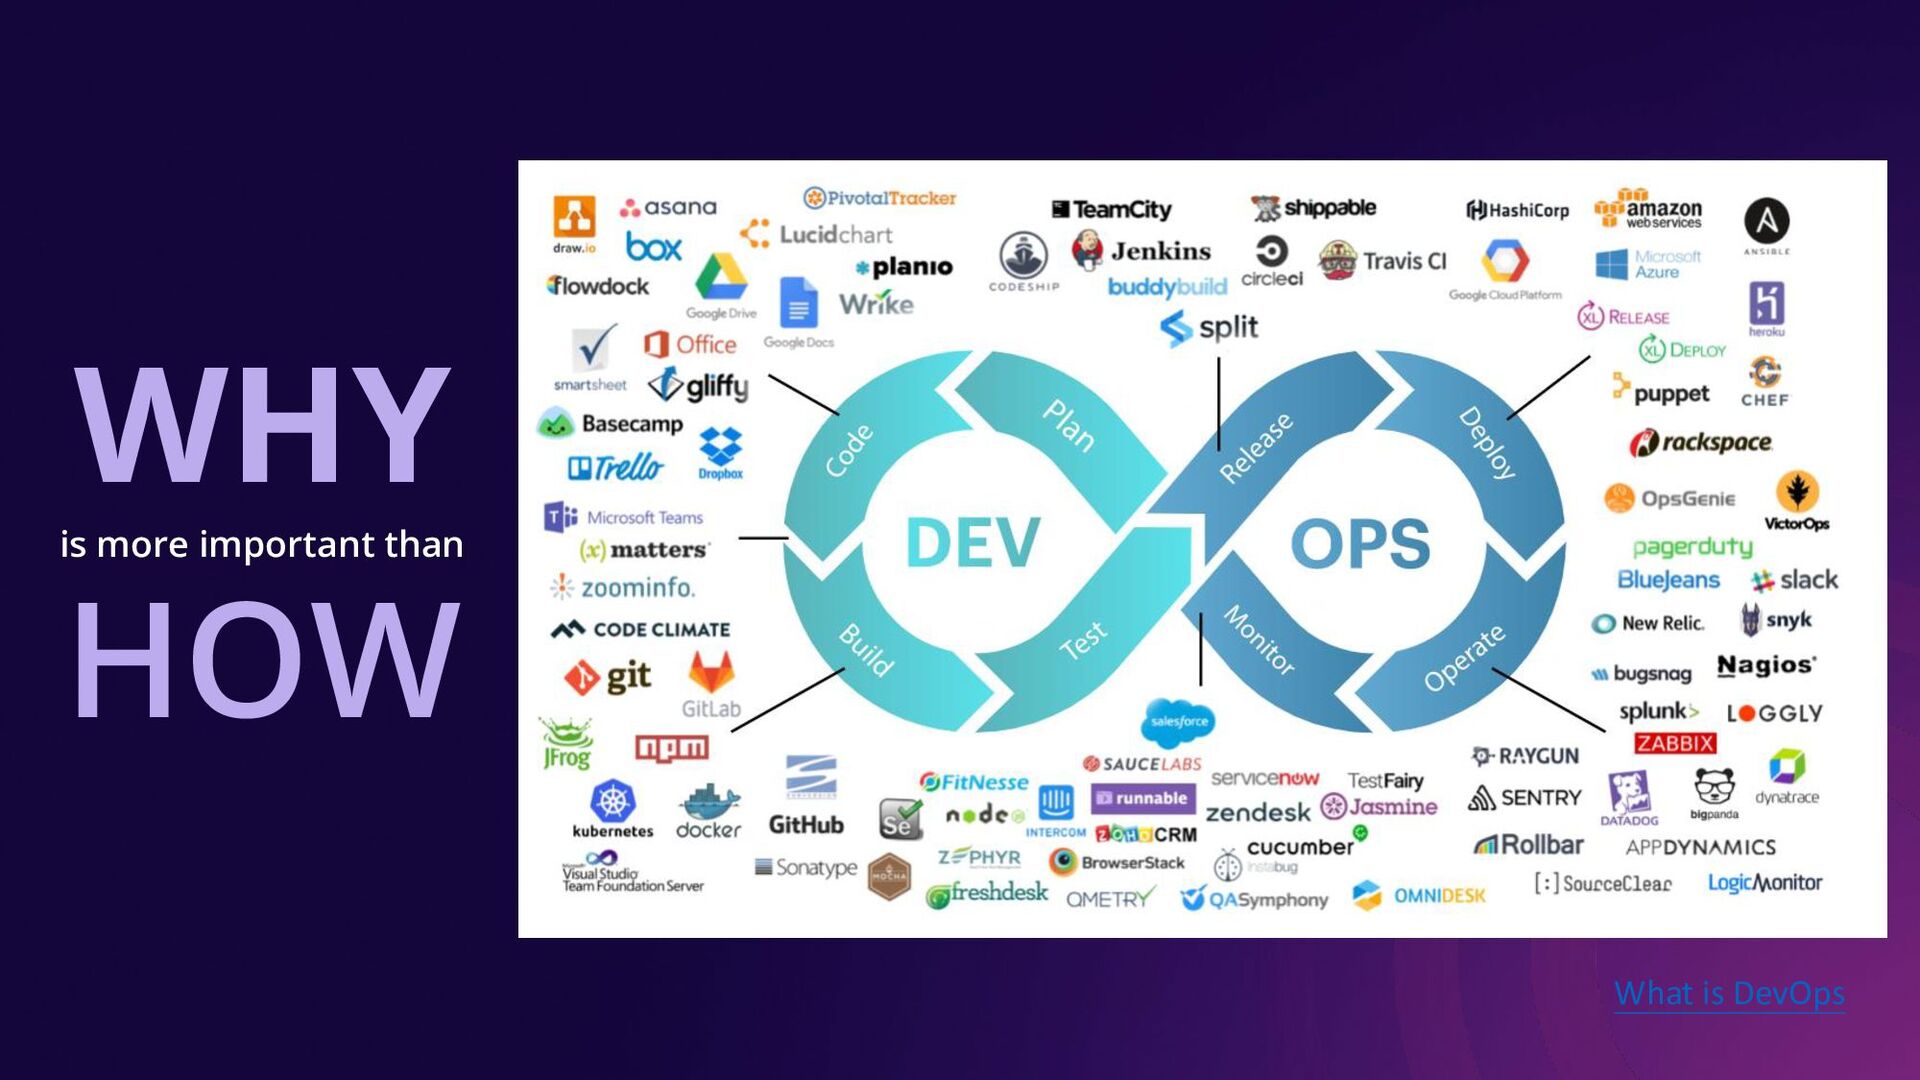
隨著科技與技術不斷的進步與創新,軟體架構從單體式(Monolithic)到 SOA(Service Oriented Architecture) 再到微服務(Micro Service),在應用程式服務顆粒度切分得更細的情況下,當系統發生問題時也隨著架構複雜度變高更難定位問題,有沒有更好的方案可以解決呢 ?

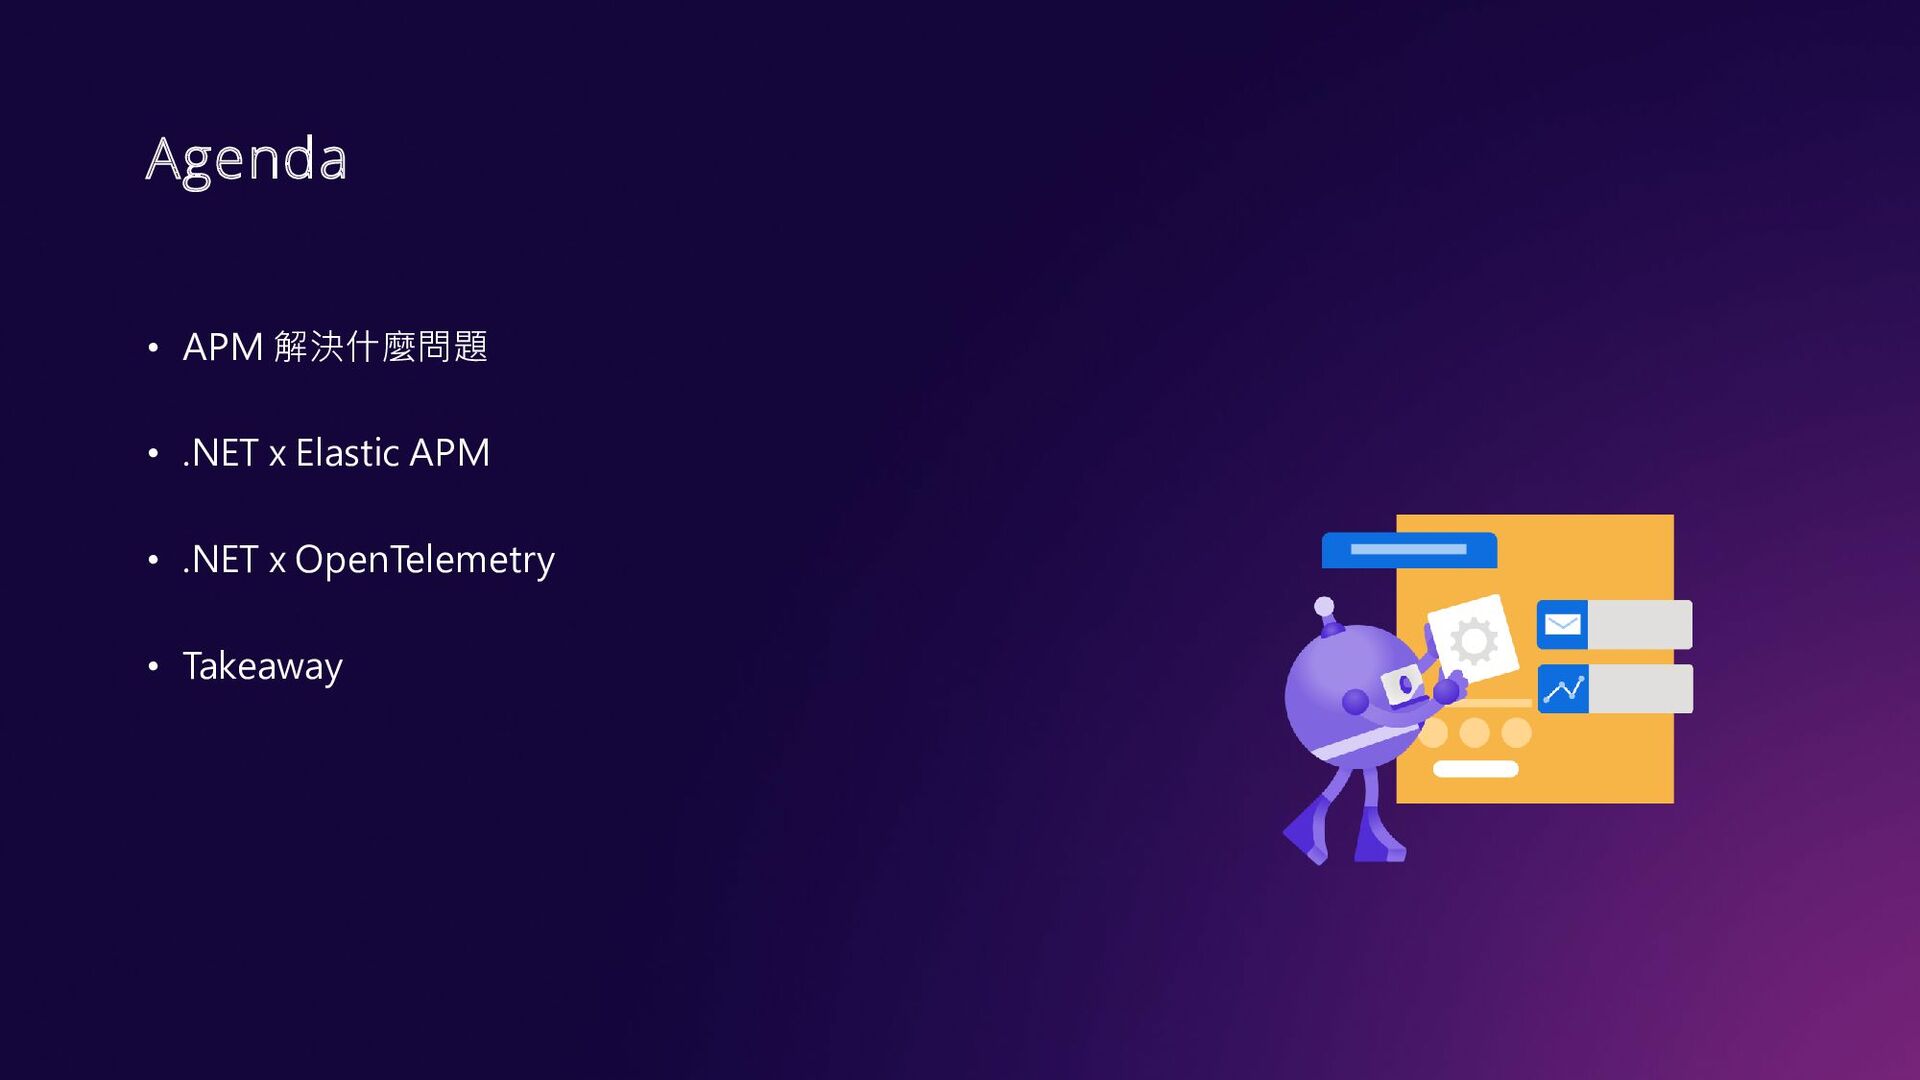
這個議程將會用淺顯易懂的方式,帶你一起探究下列議題
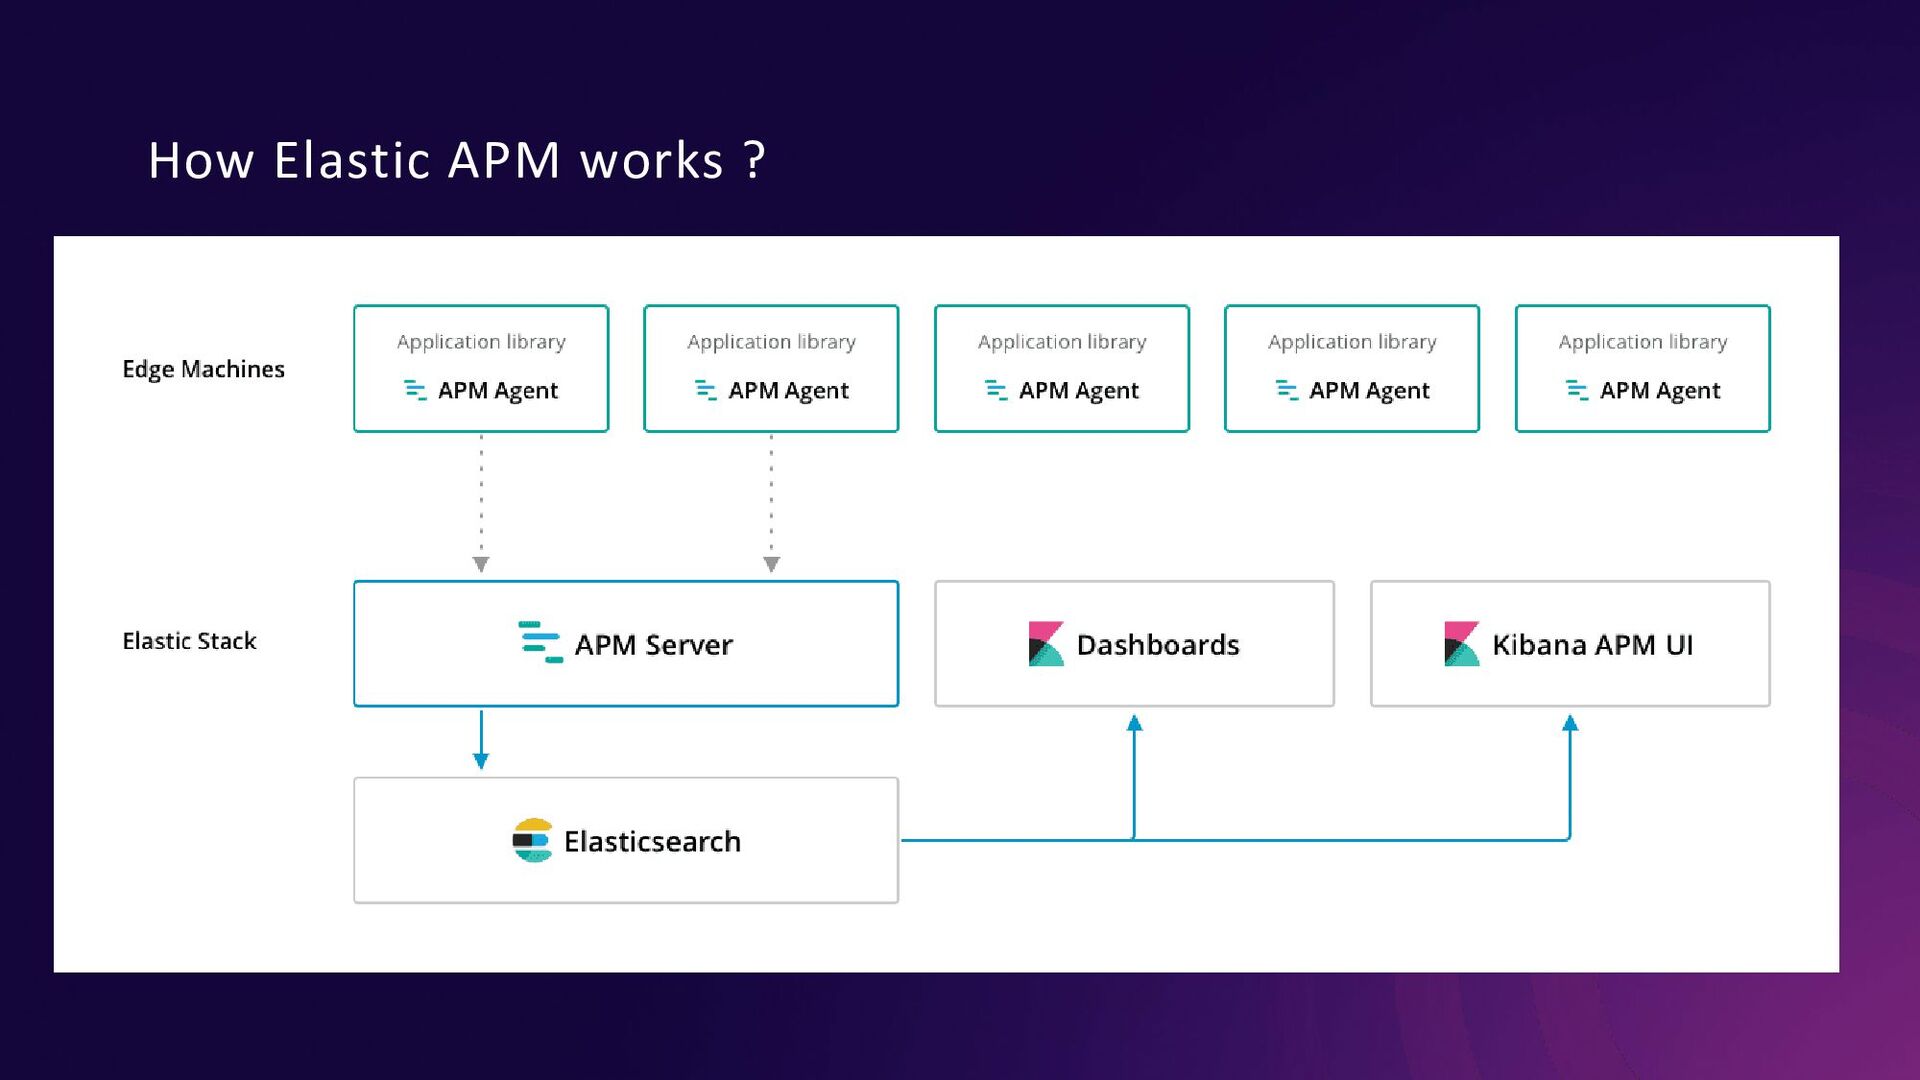
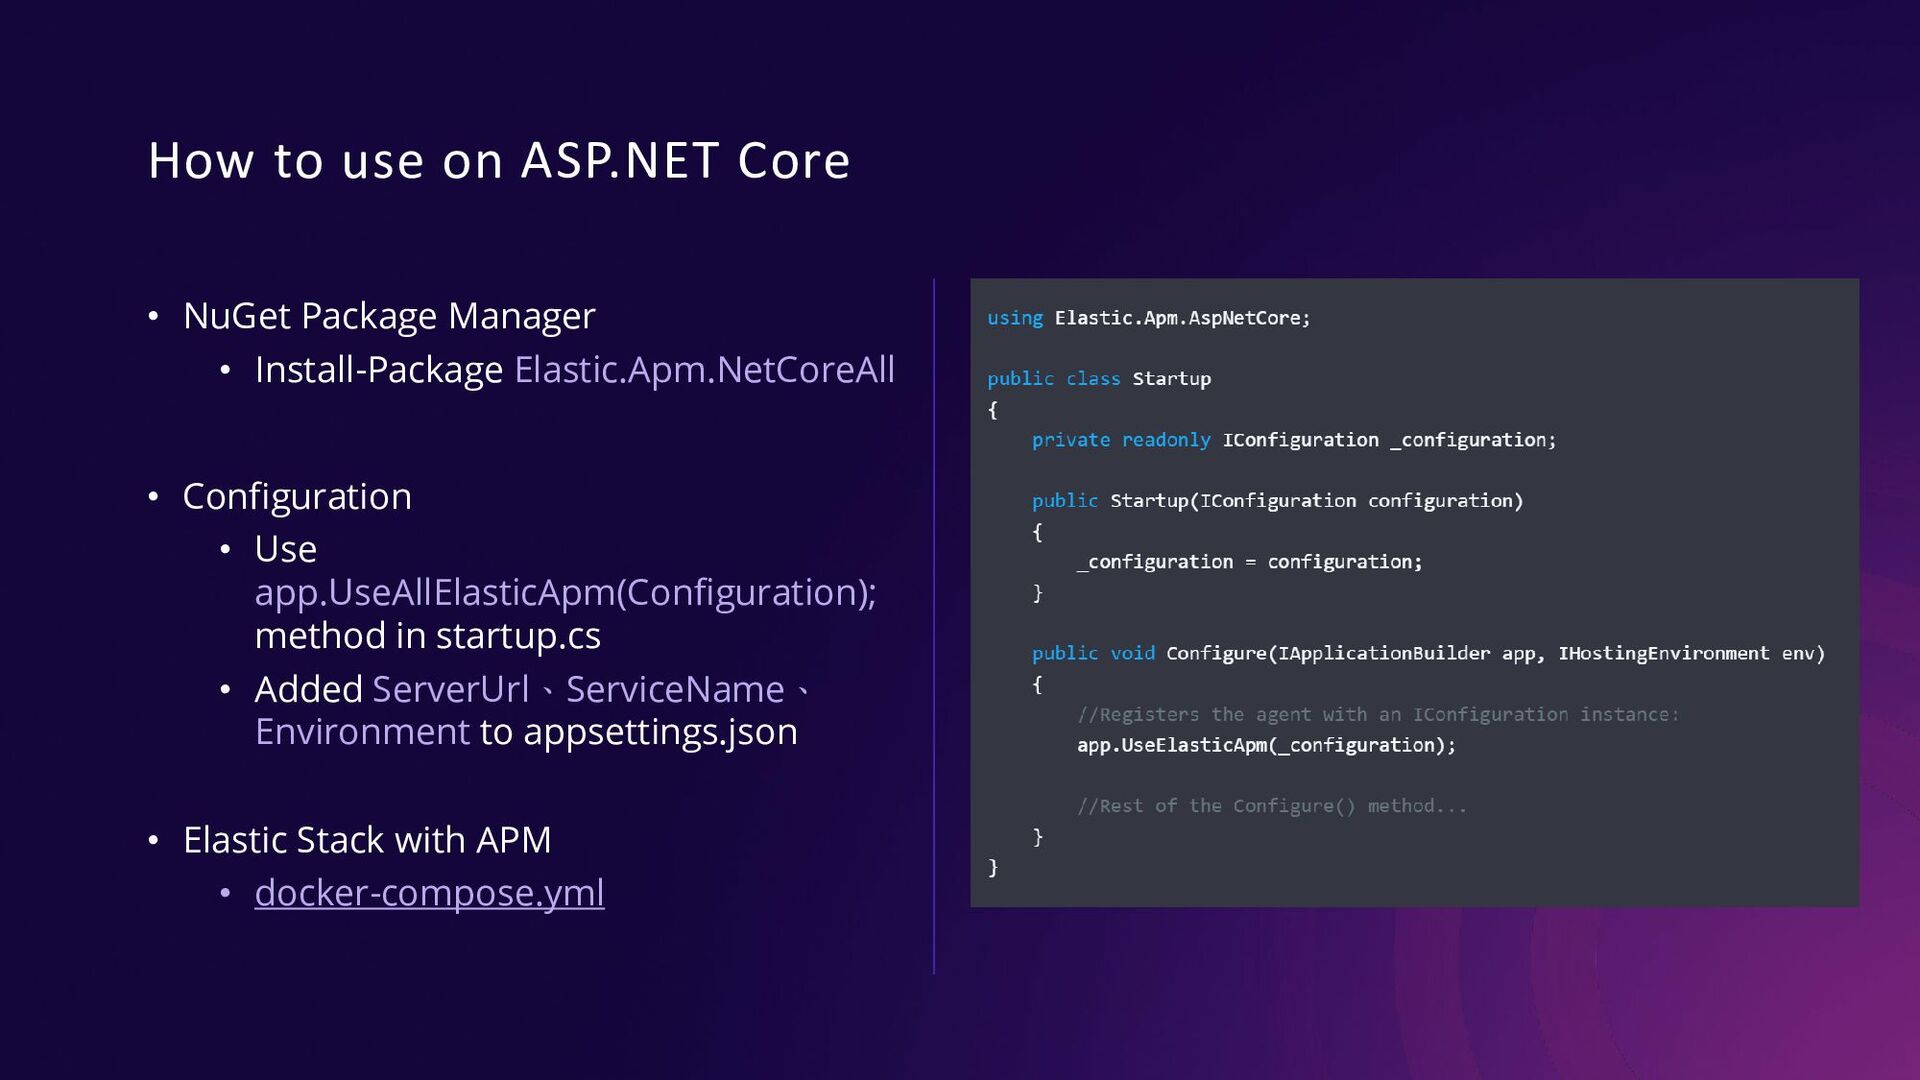
1. .NET 如何與 Elastic APM 整合
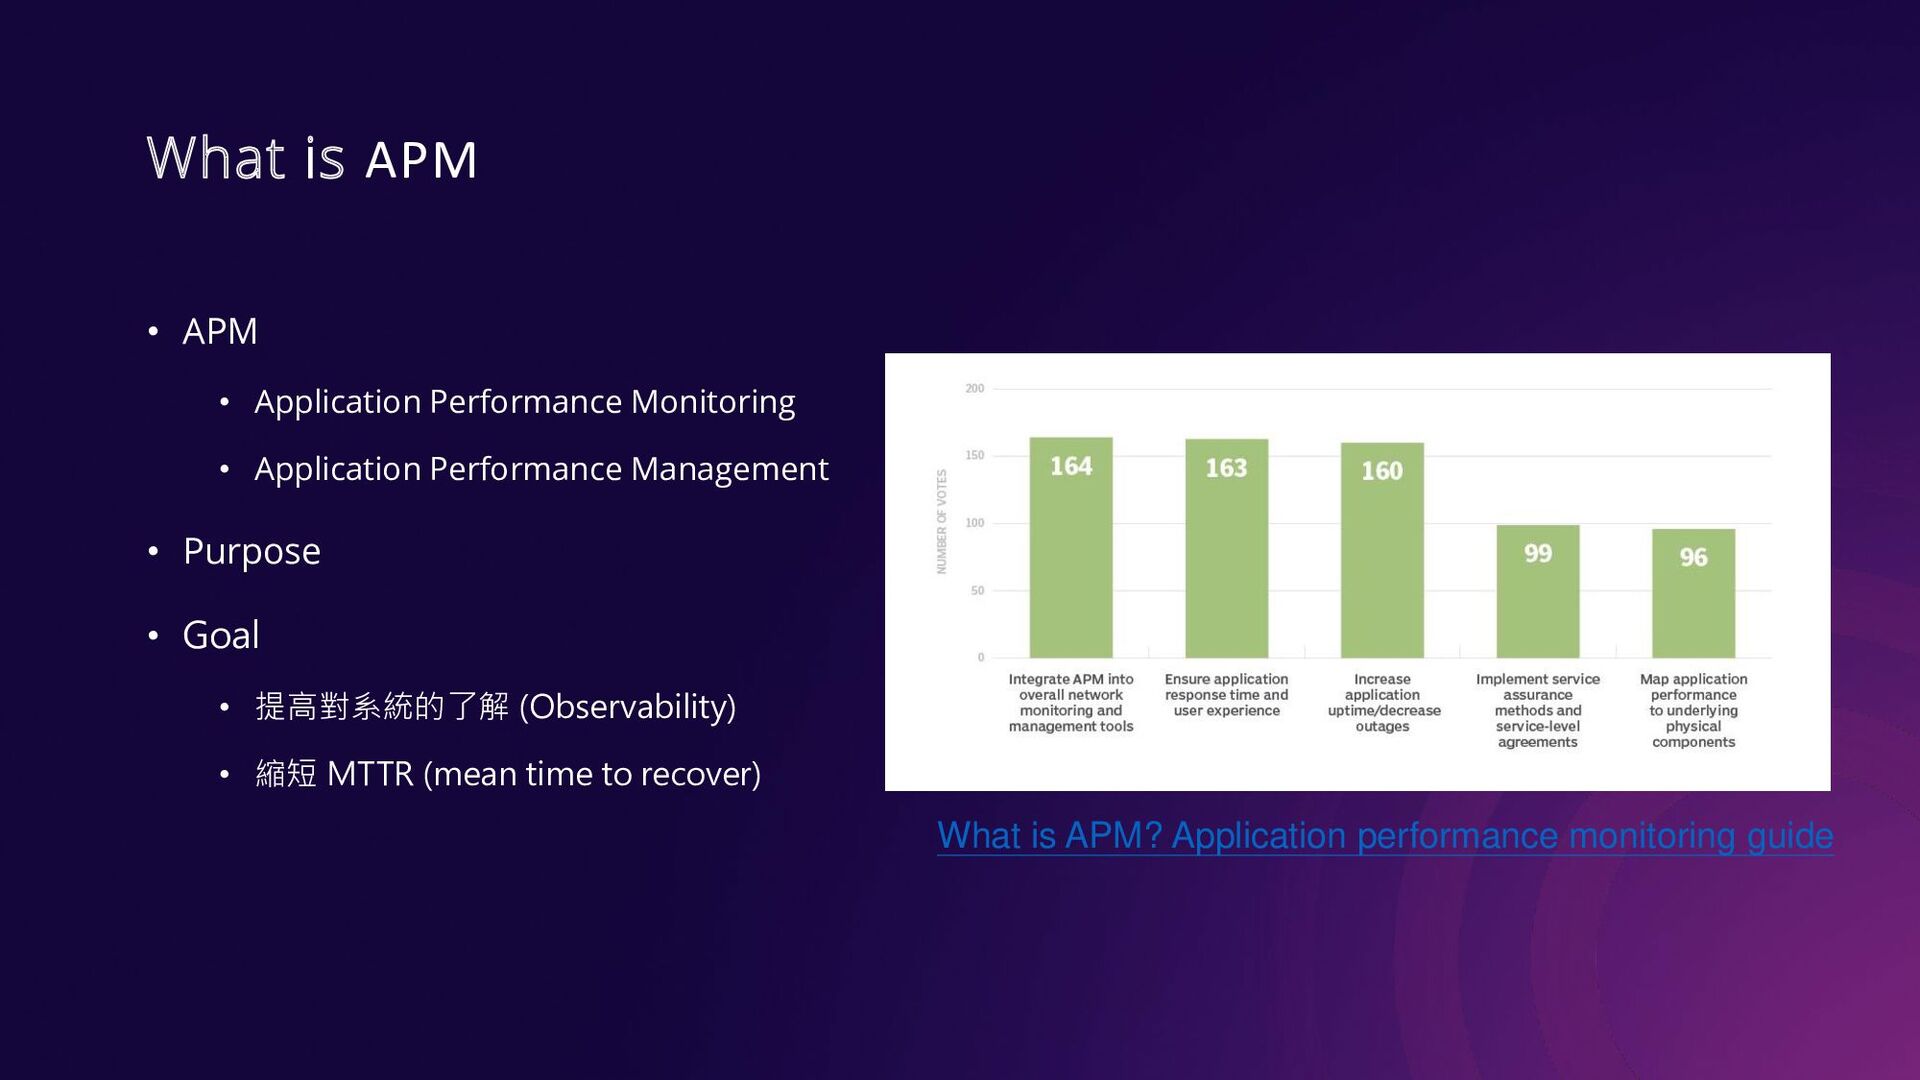
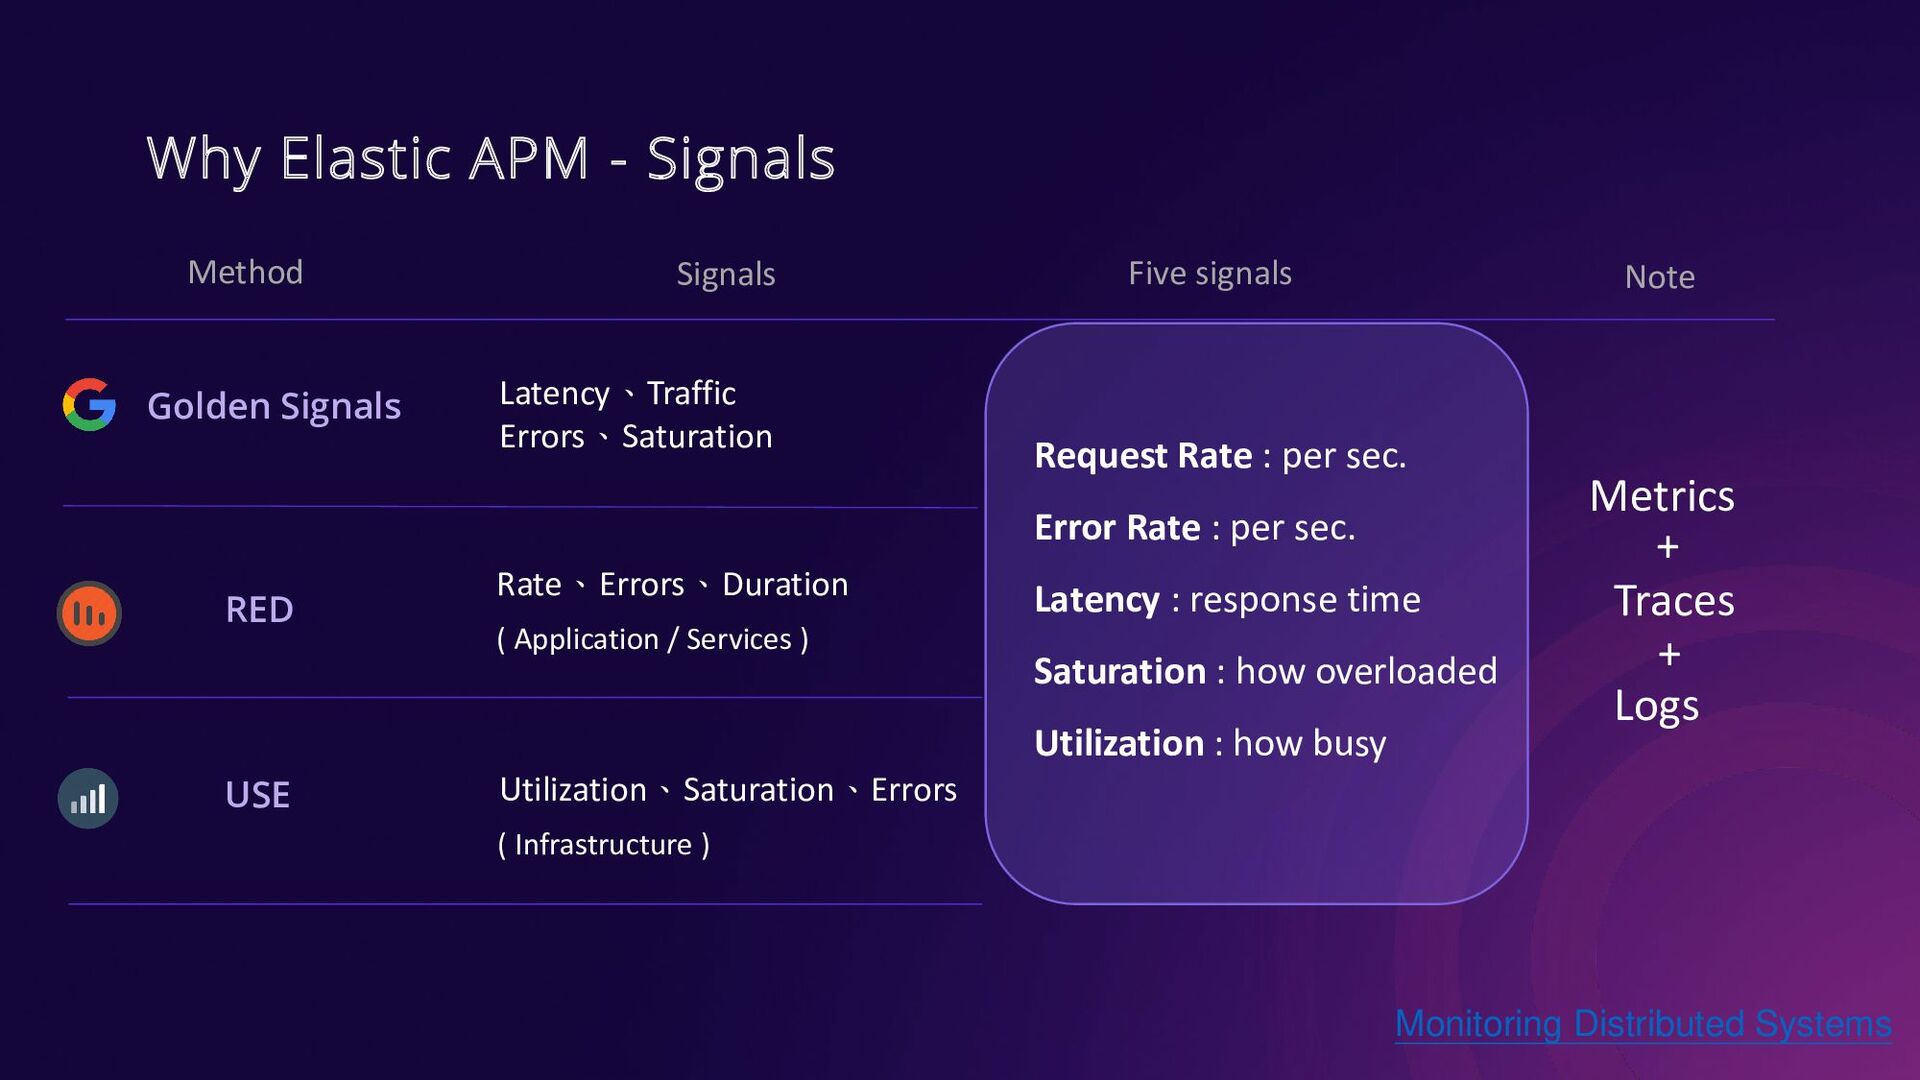
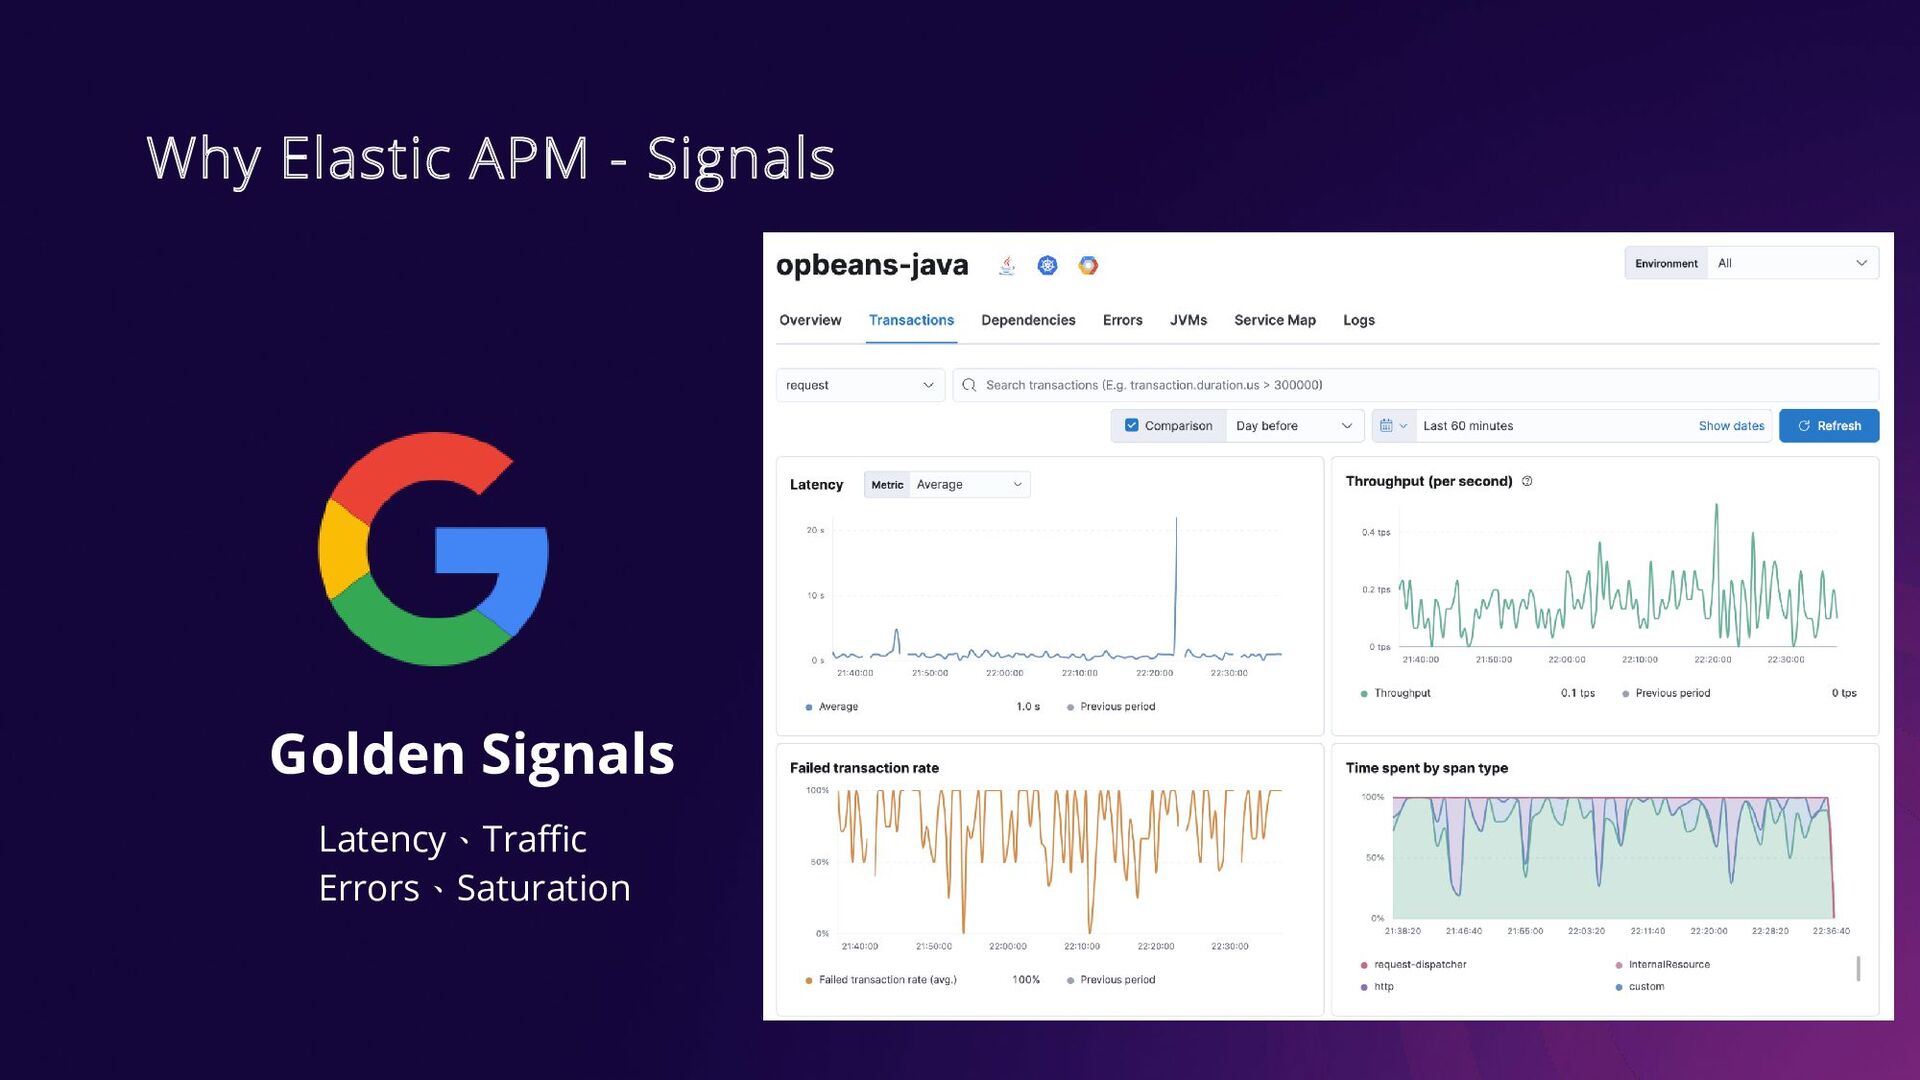
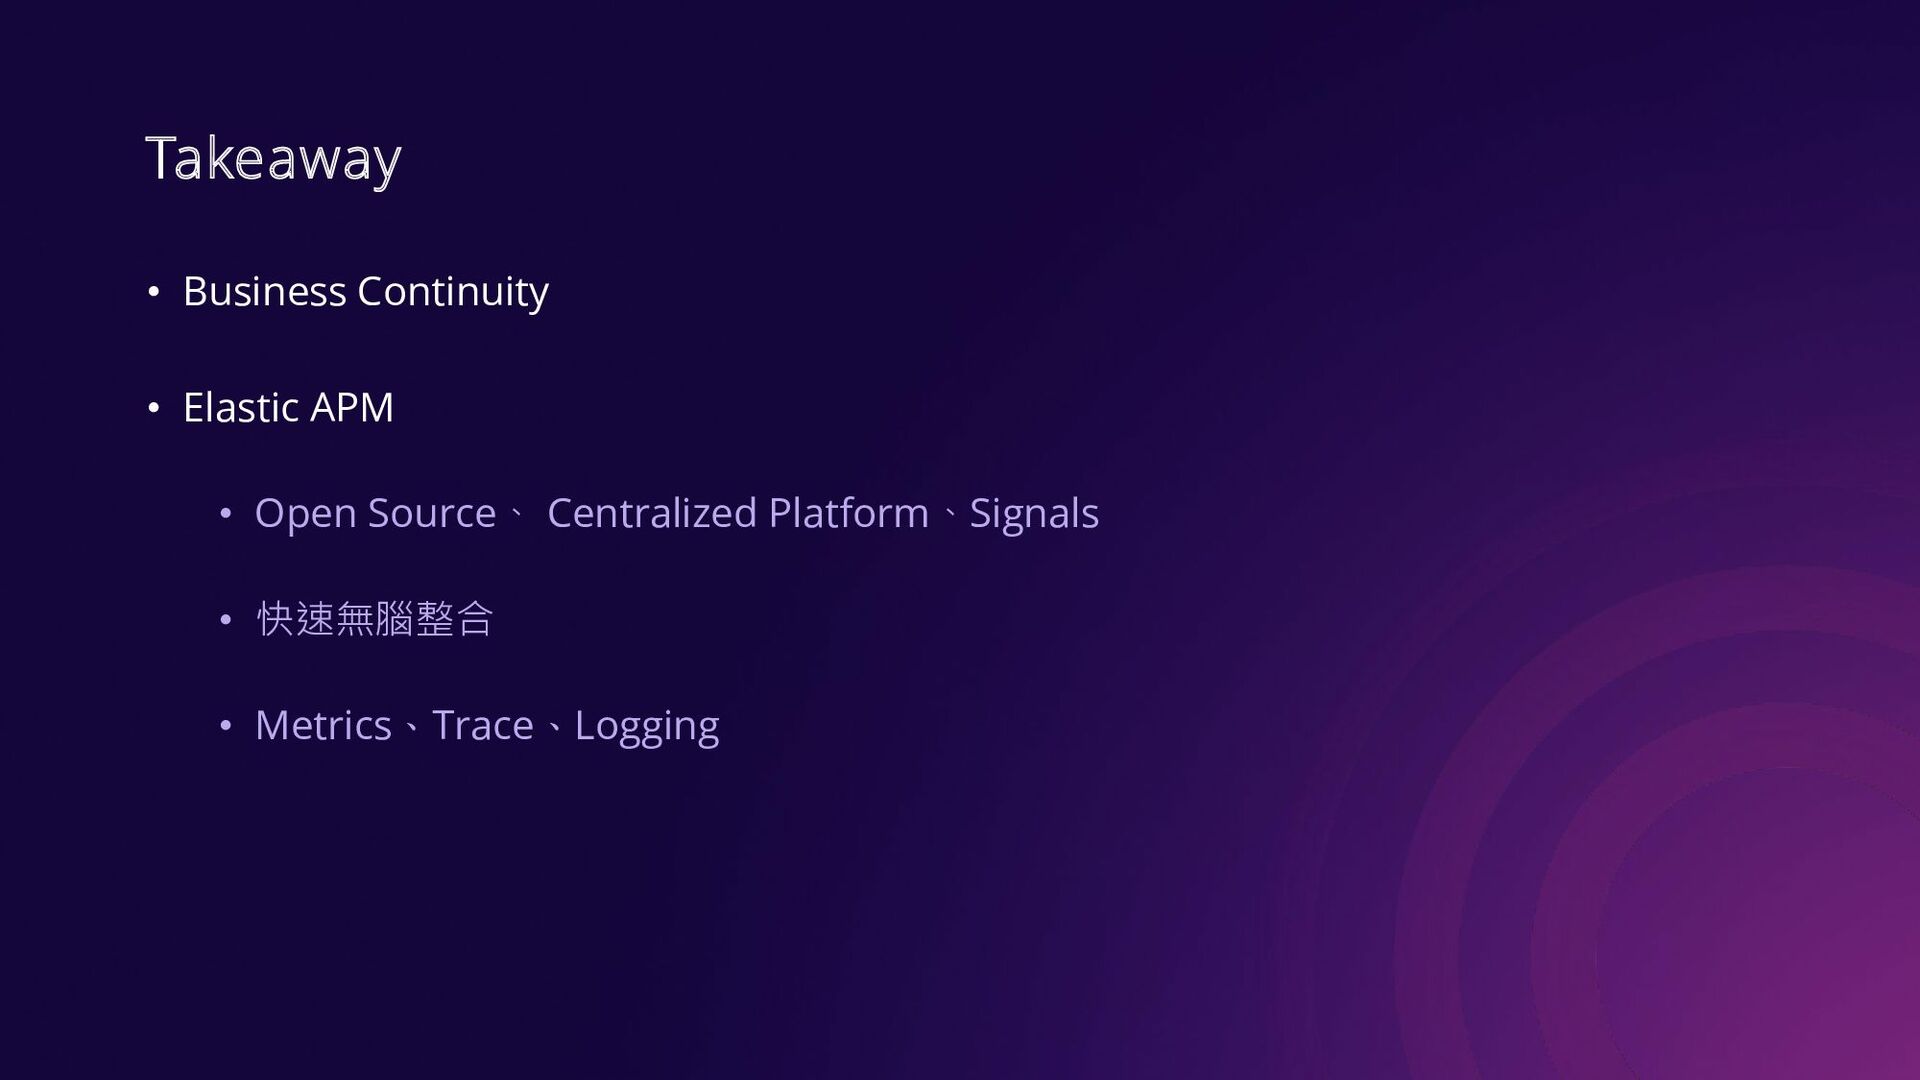
2. Elastic APM 內建的監控數據可以為團隊帶來哪些幫助
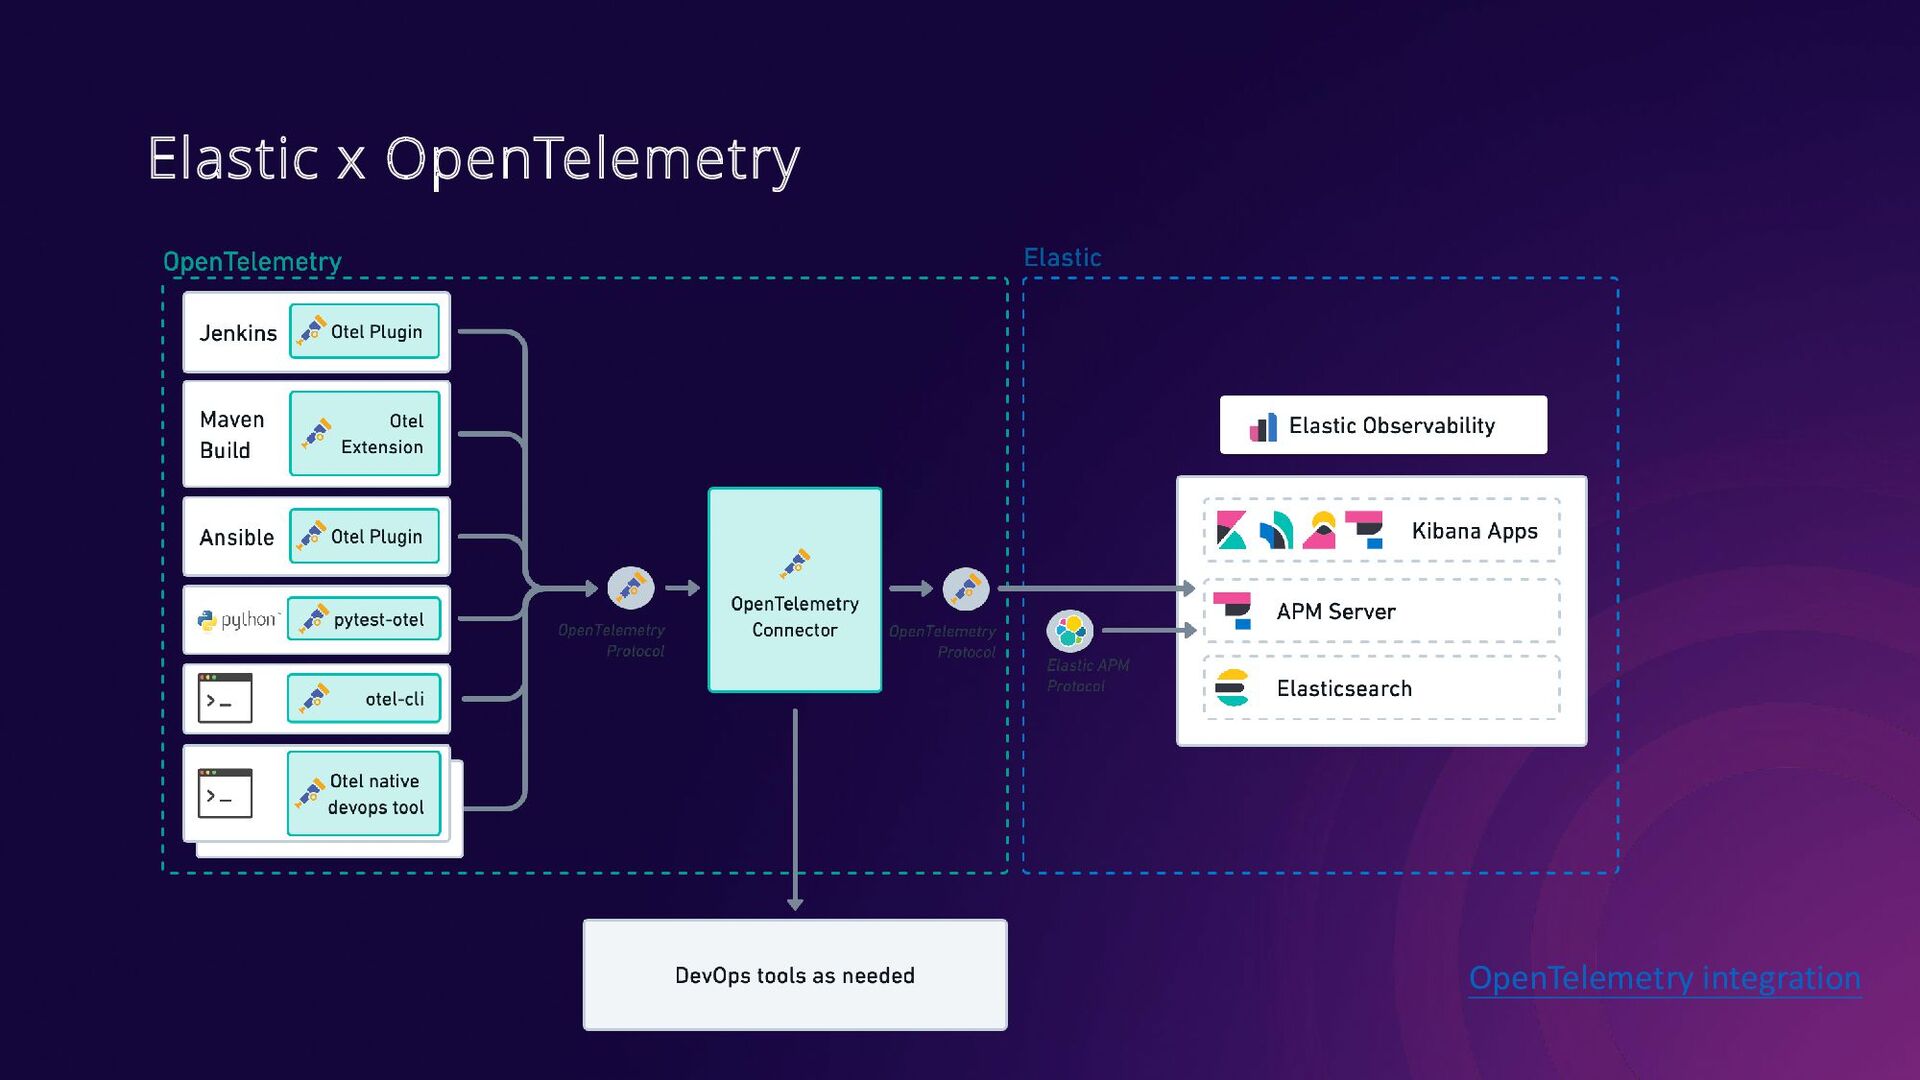
3. 如何與現代化遙測標準 OpenTelemetry 整合
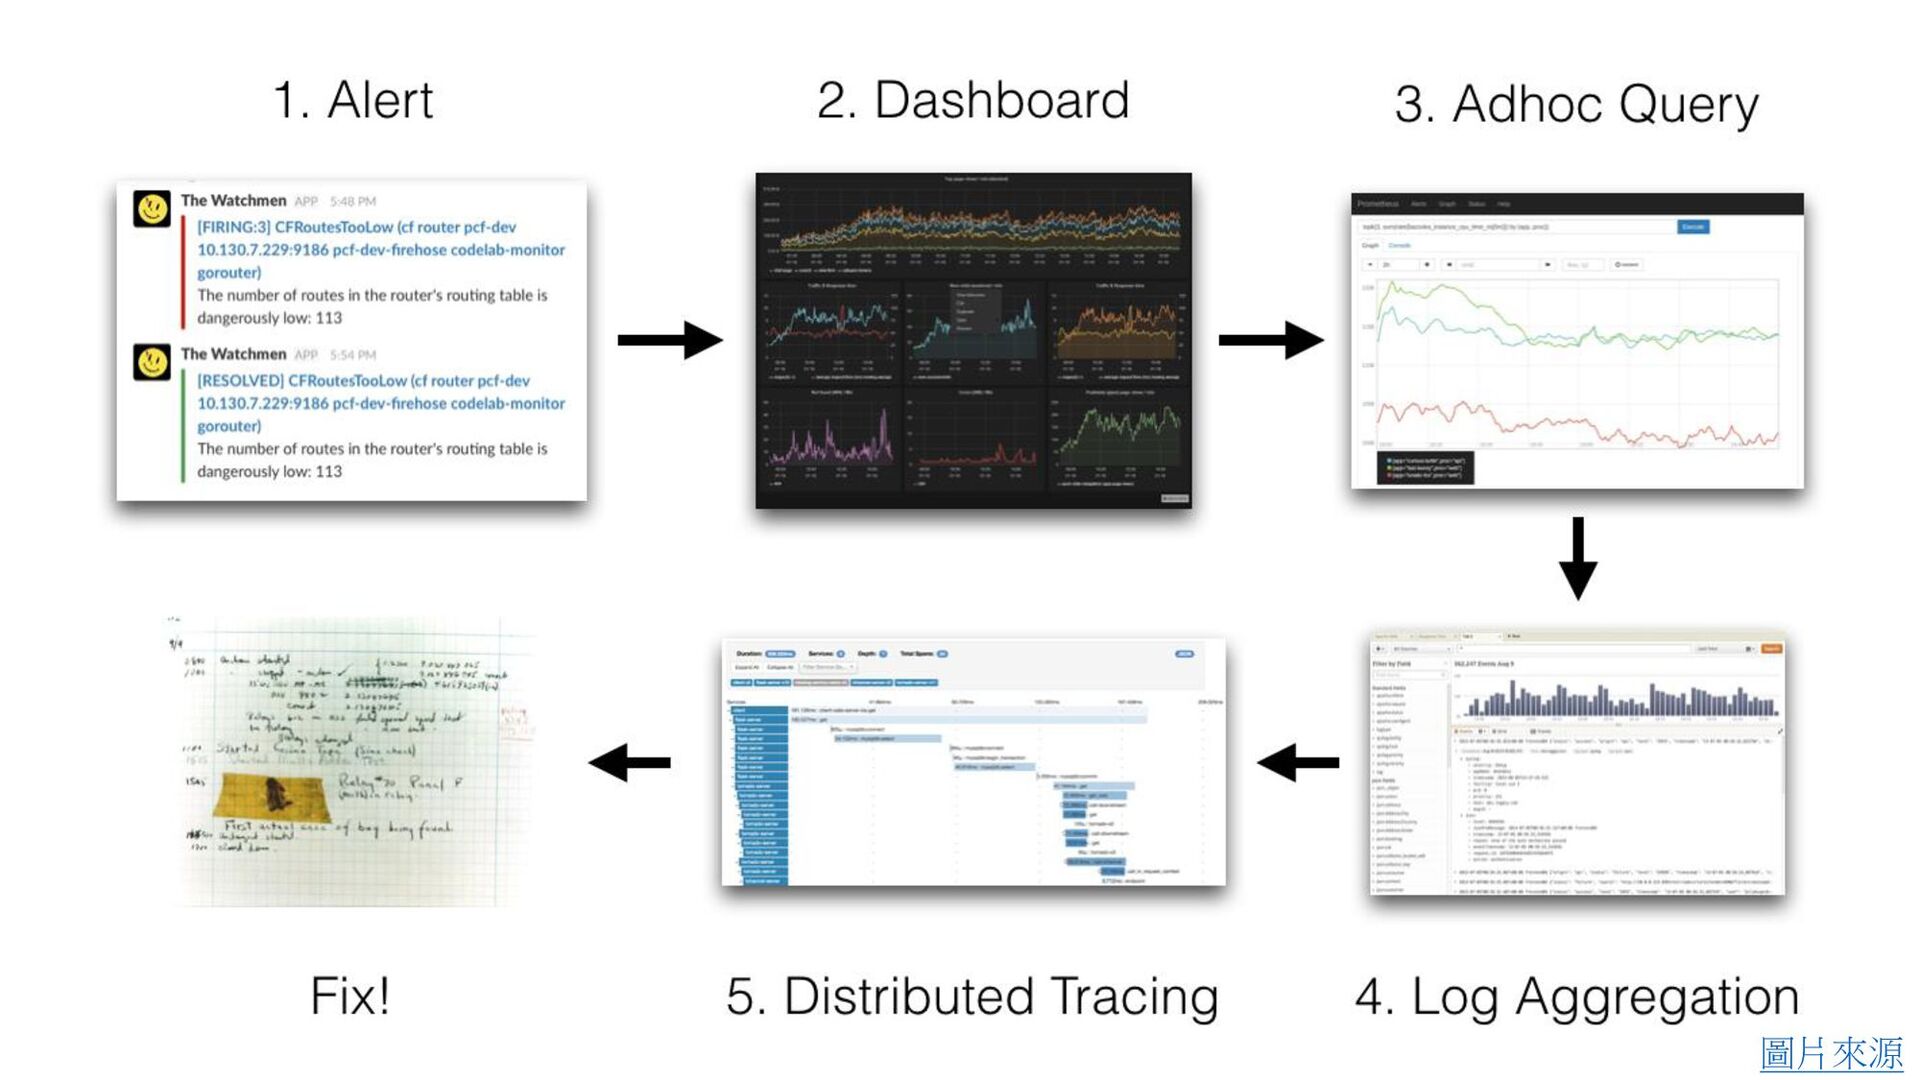
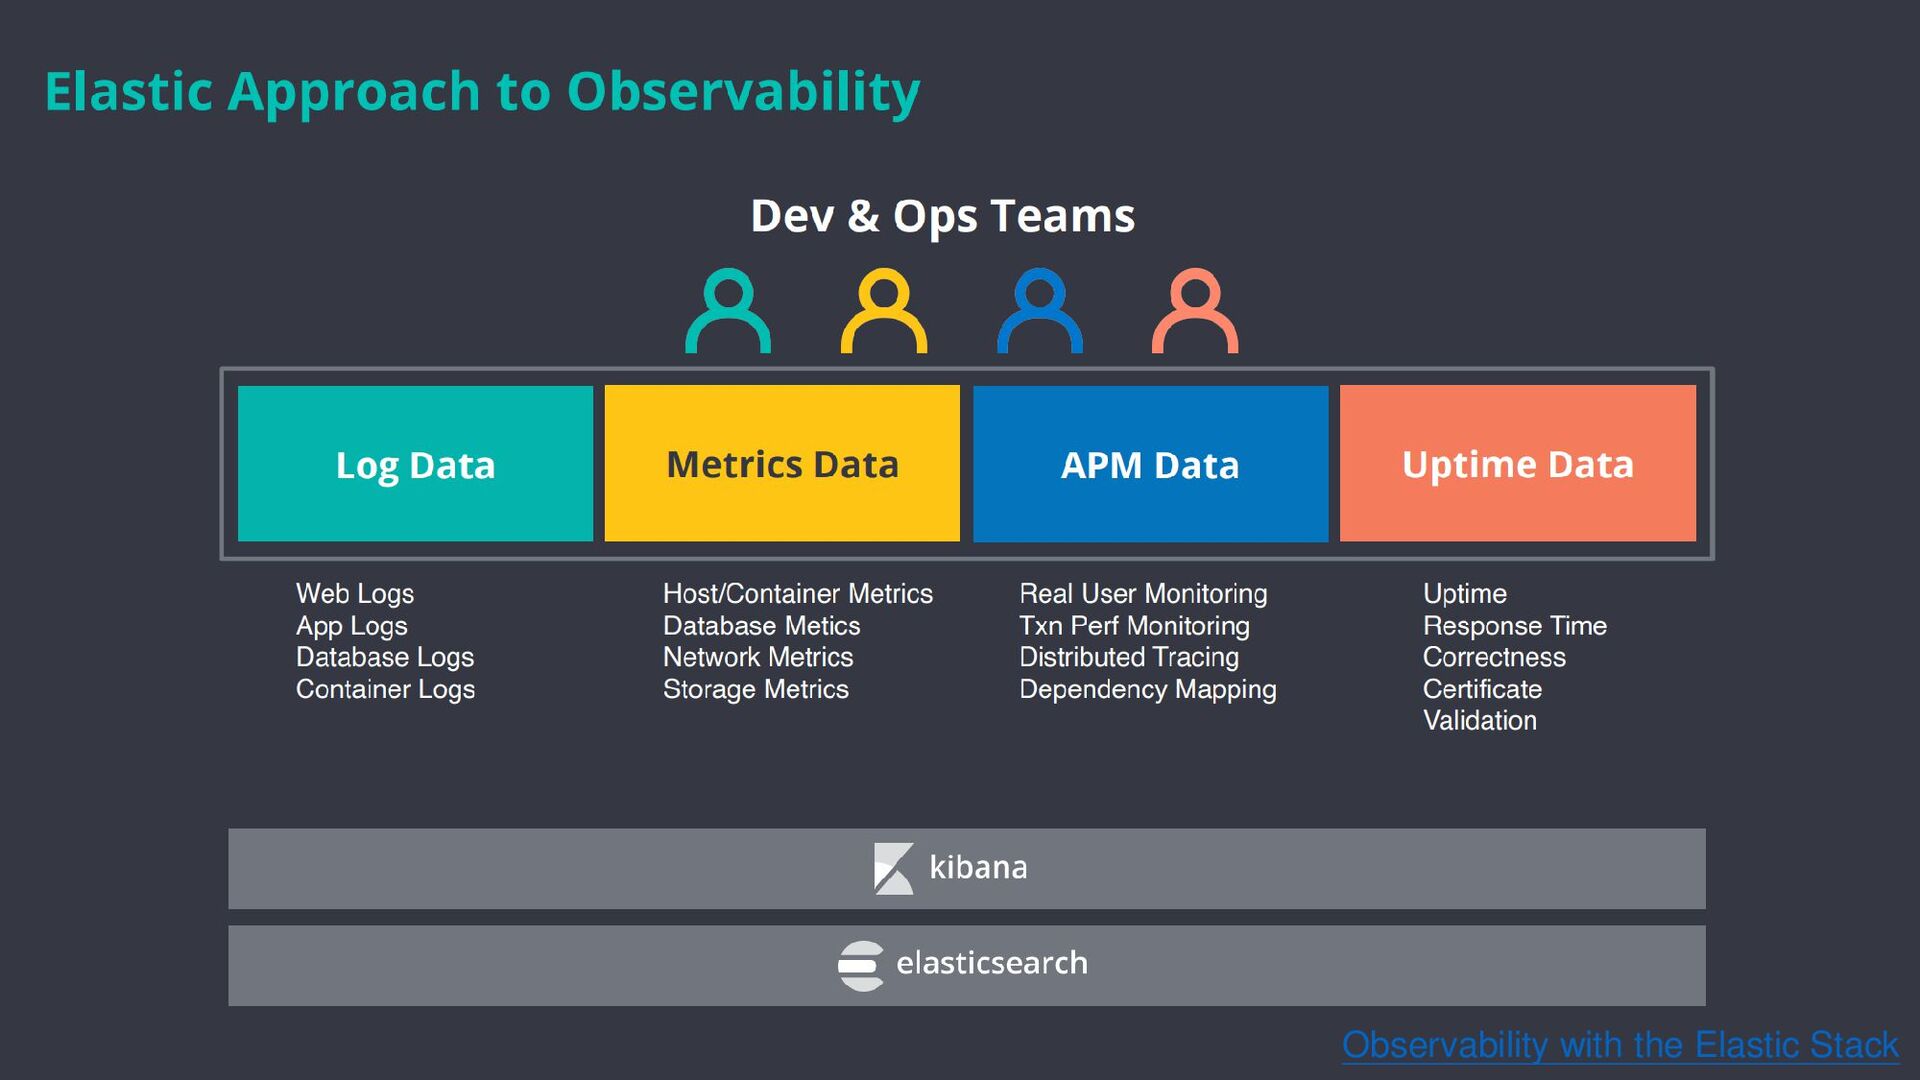
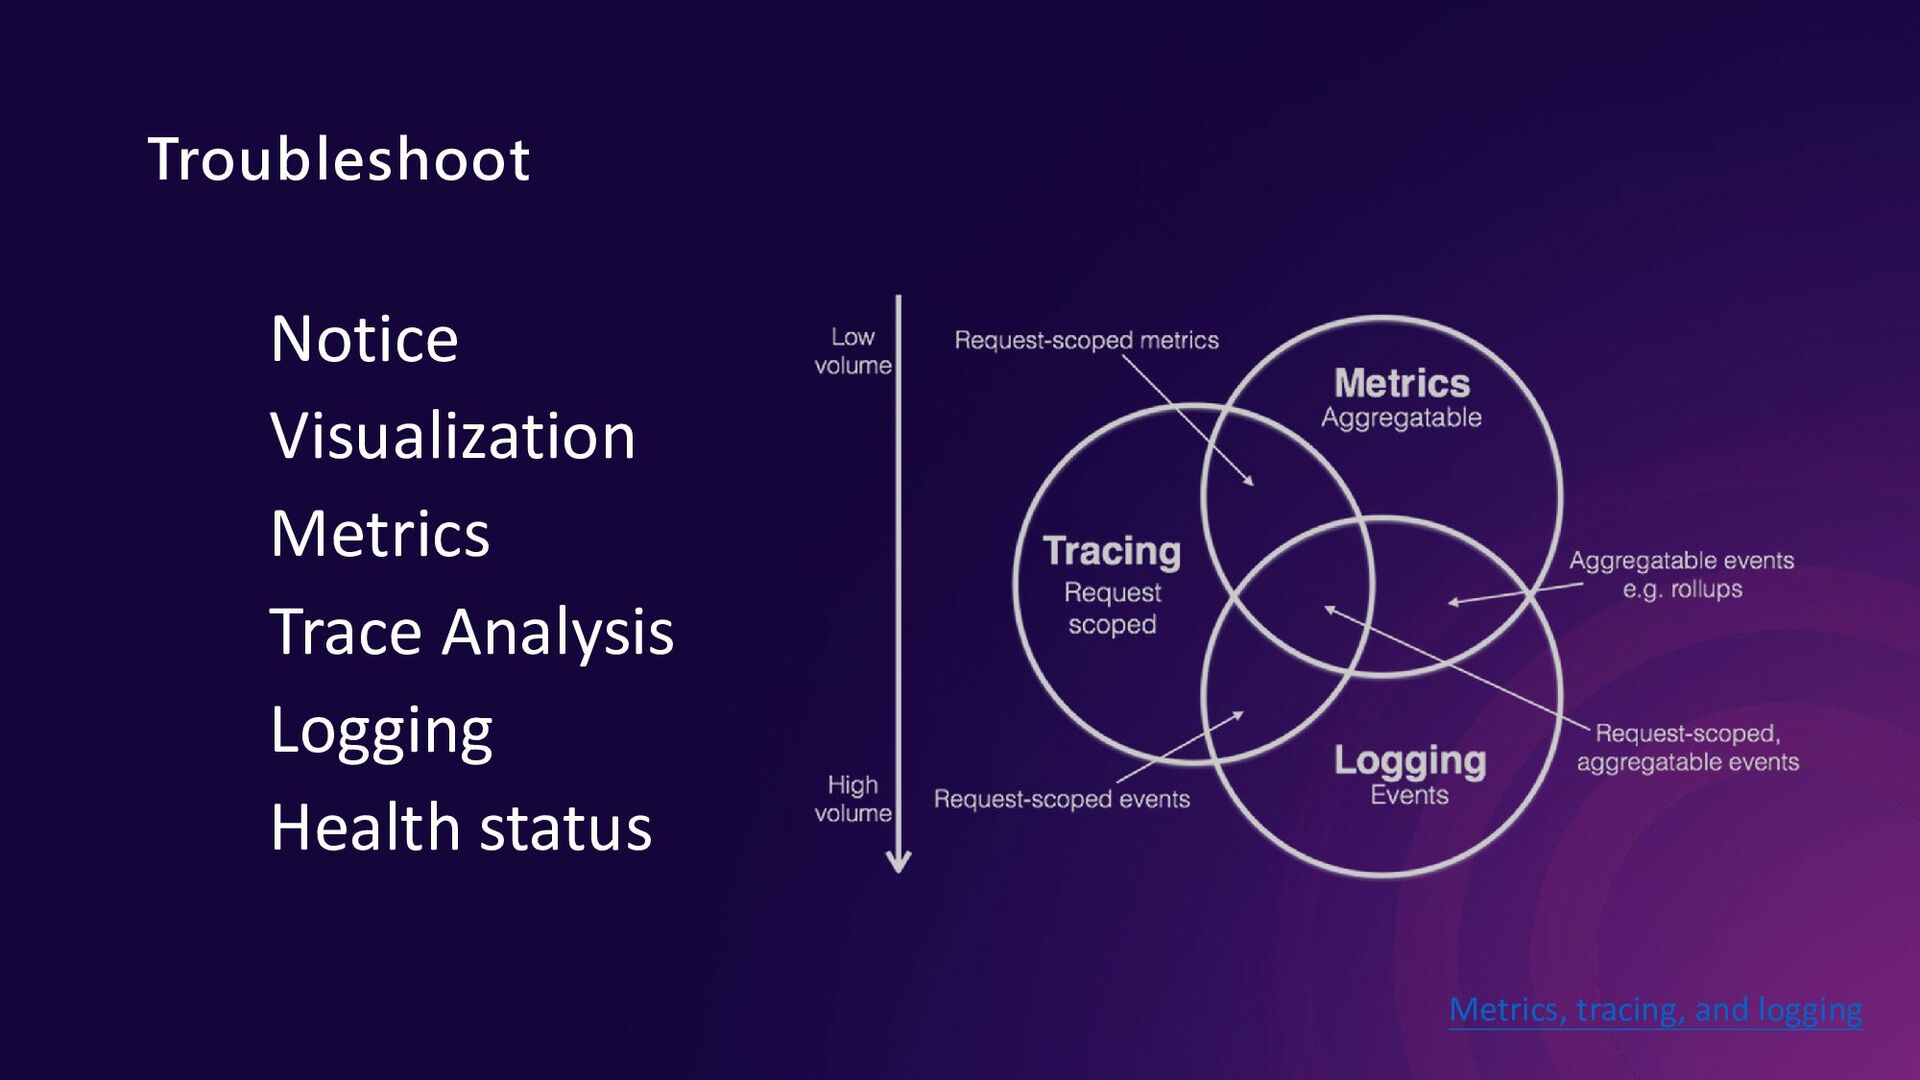
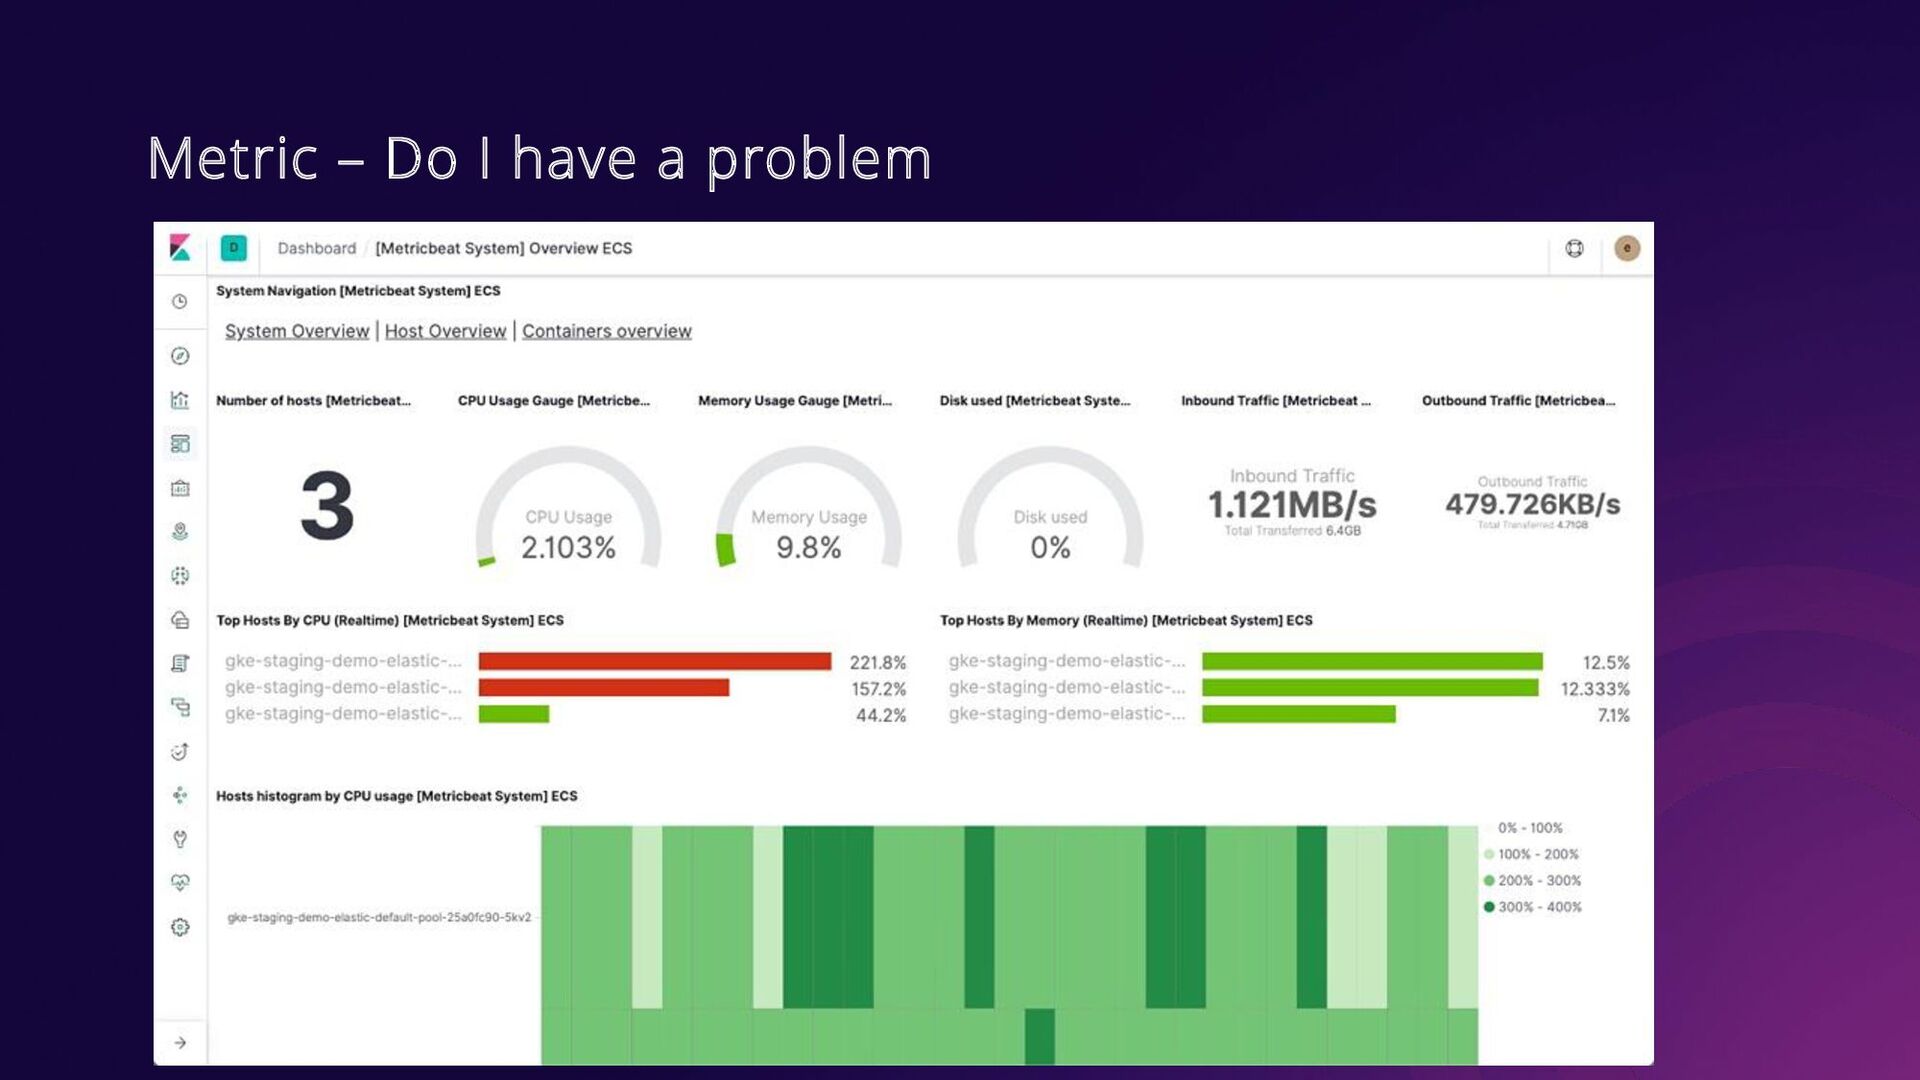
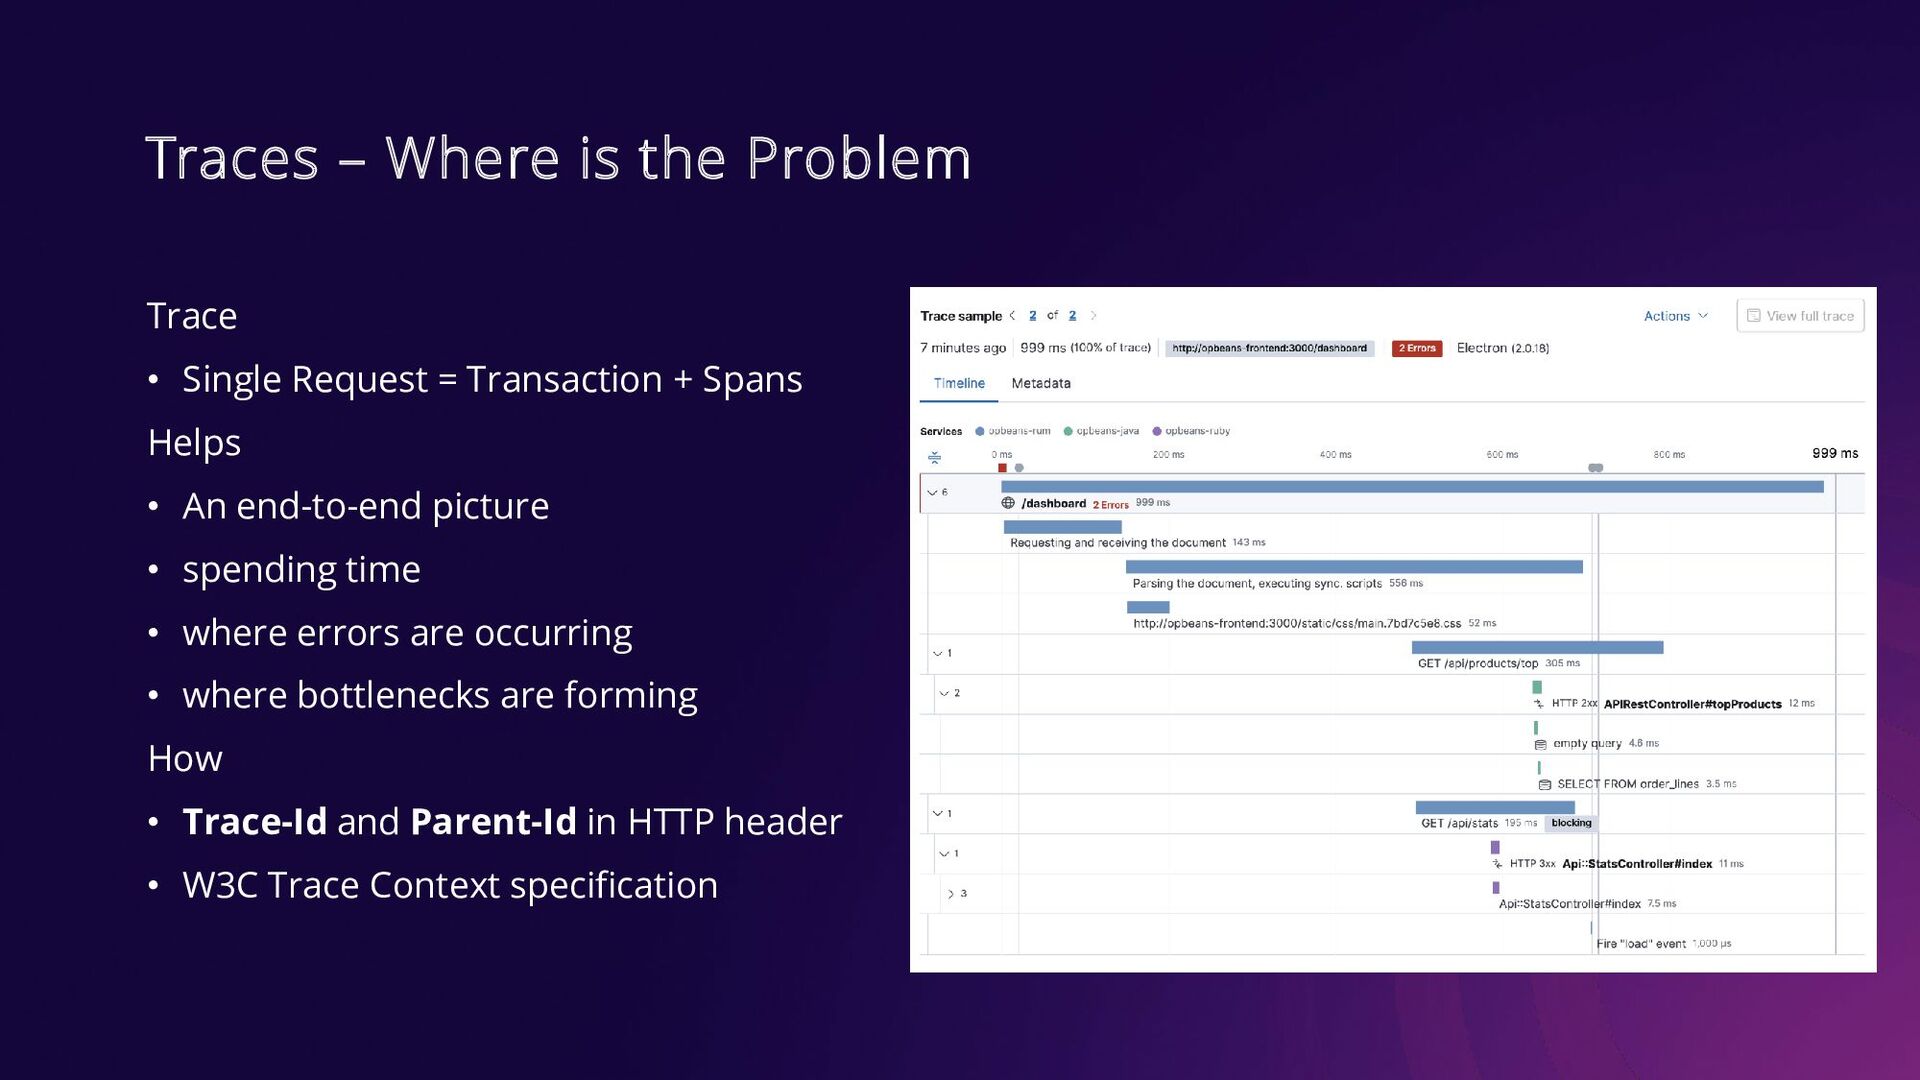
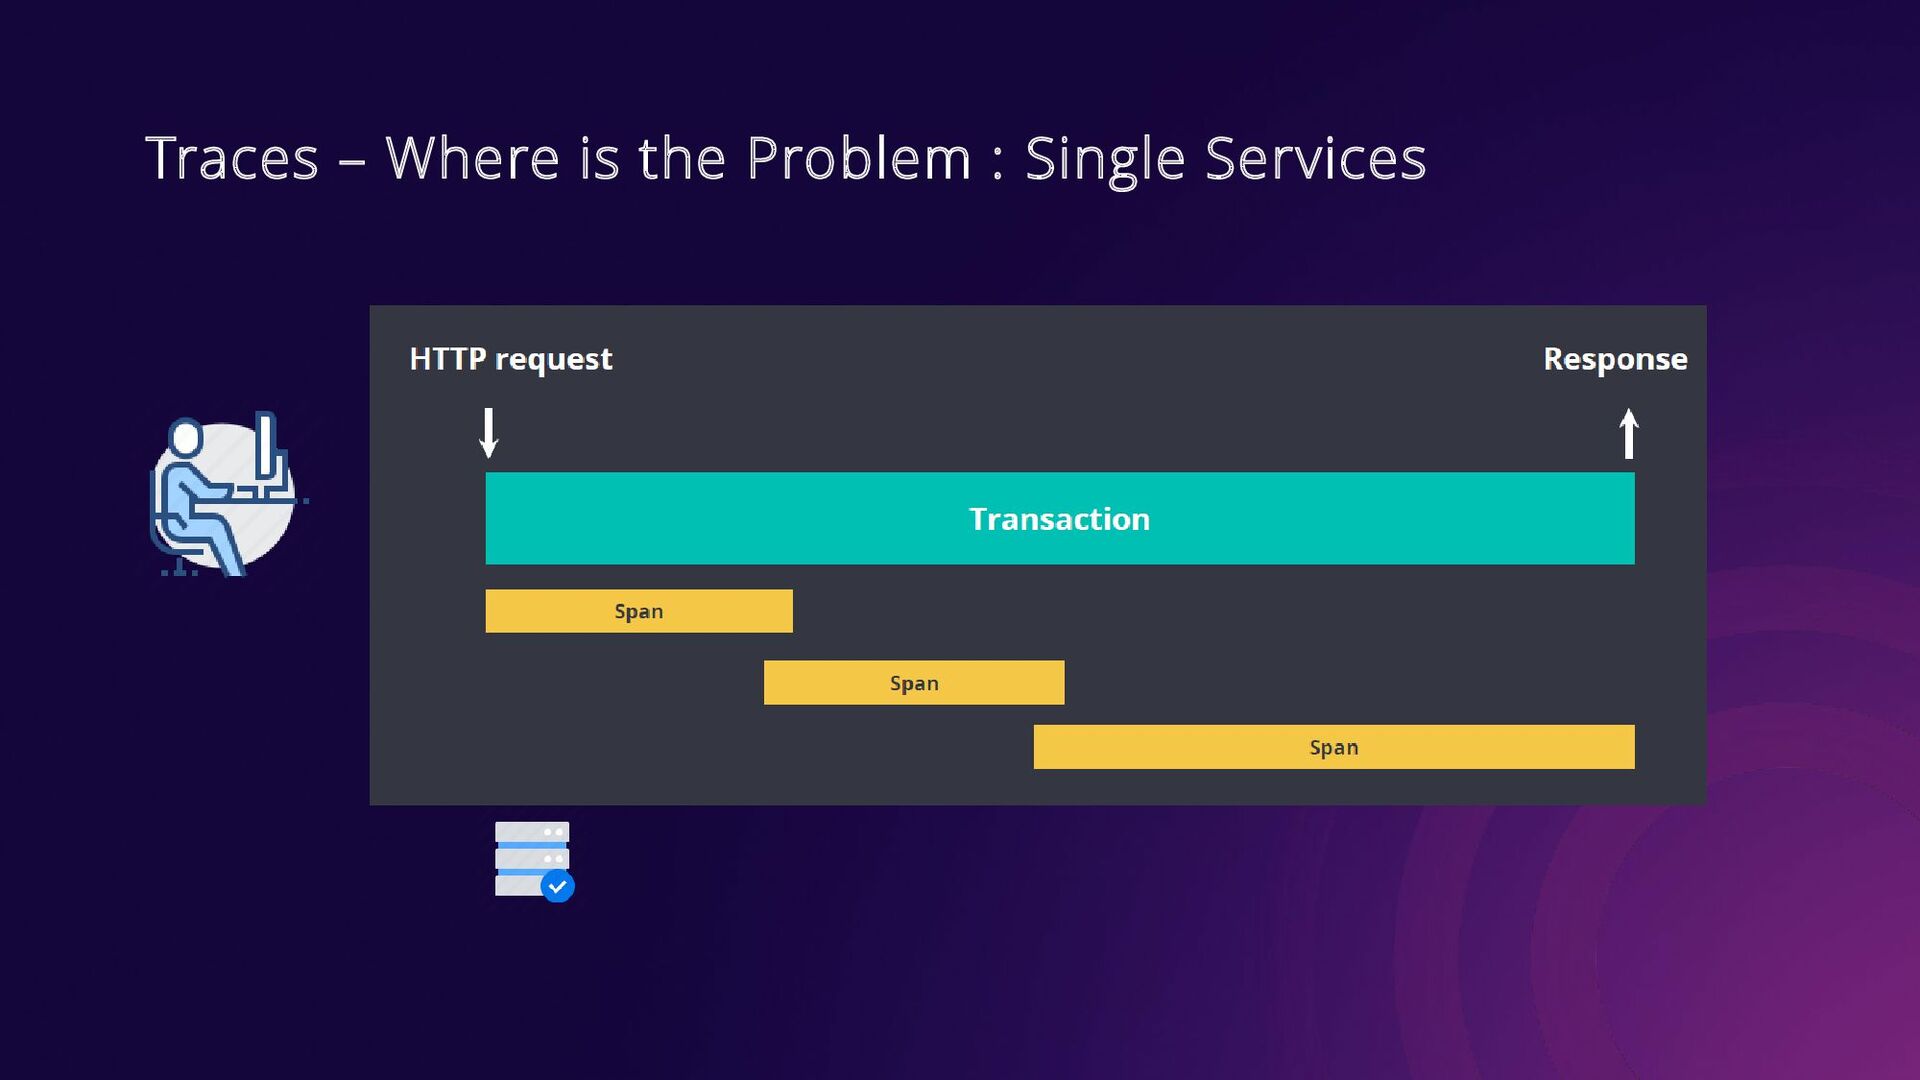
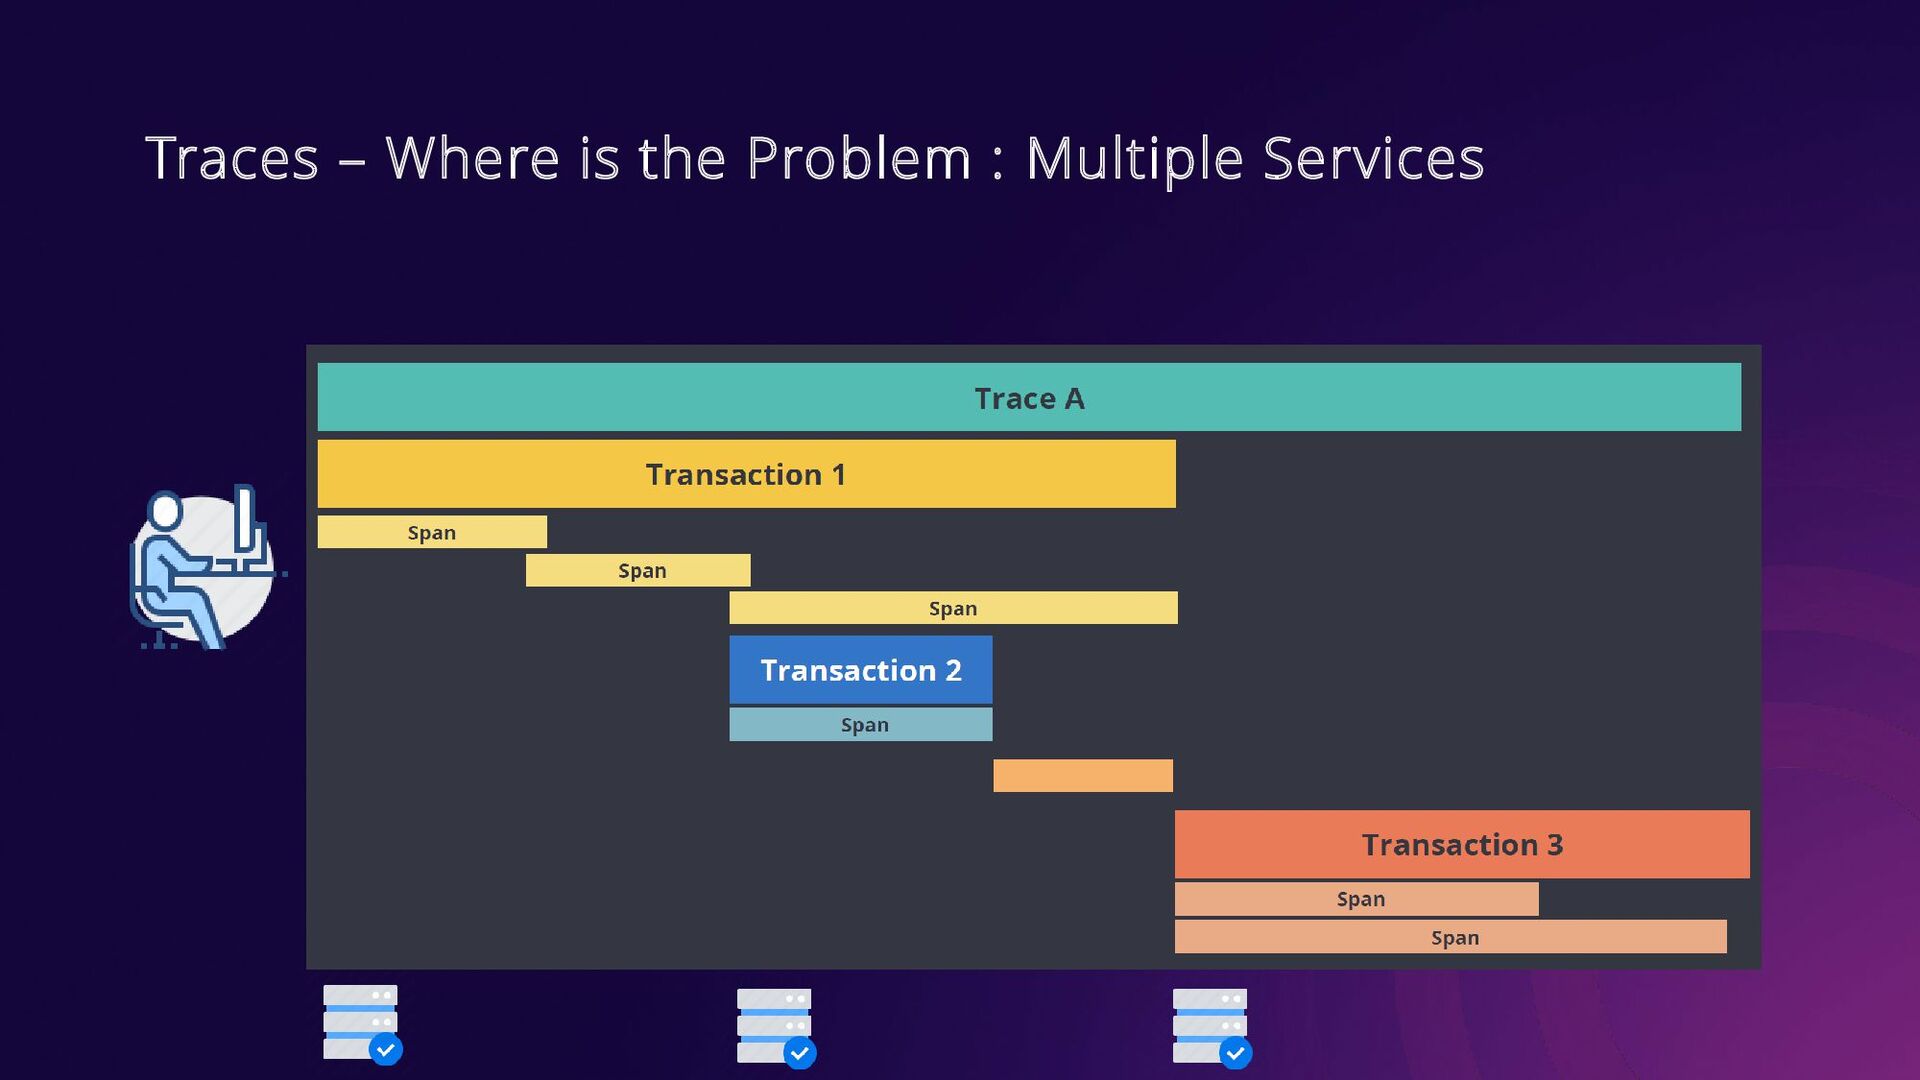
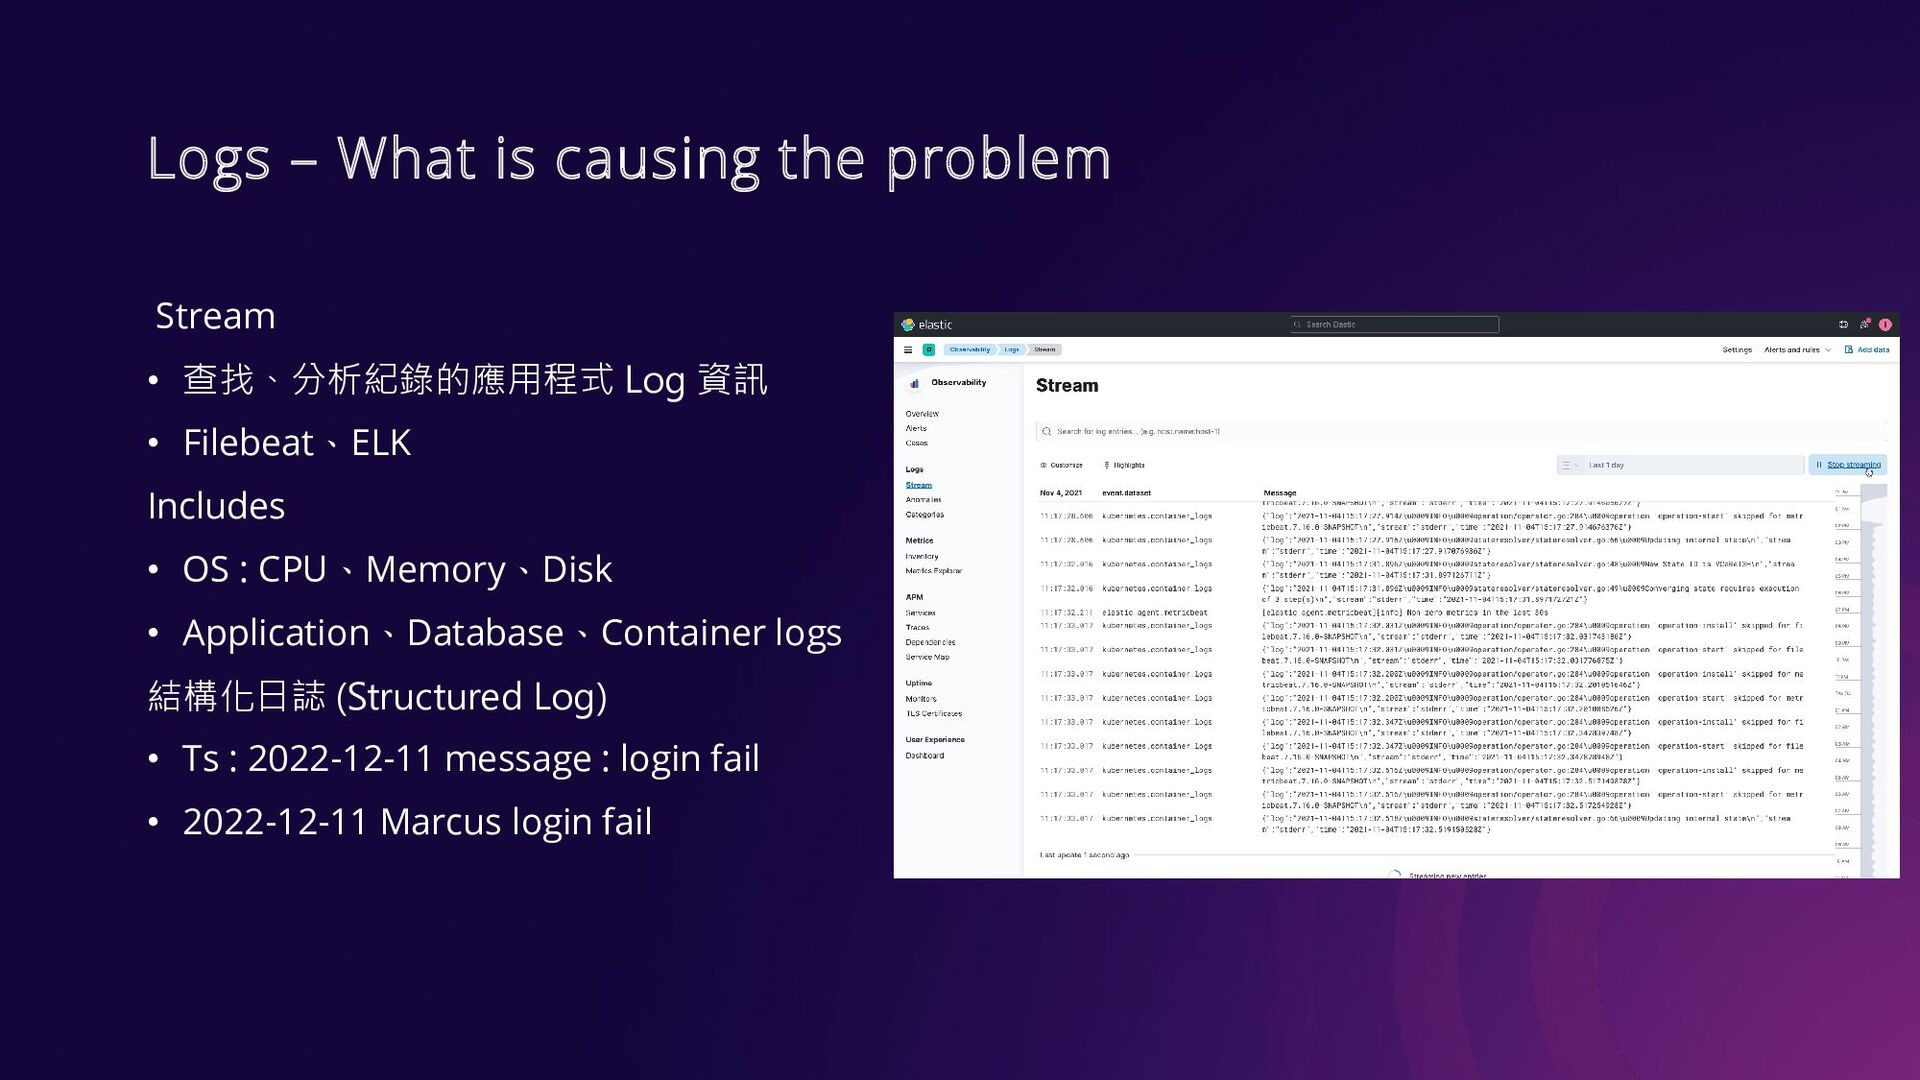
透過 Elastic APM 快速了解問題的脈絡(Tracing),找到可能的系統效能瓶頸,讓發生線上問題時團隊可以更快速定位問題並止血,分享在這過程學習到的經驗以及小小心得。

Marcus

December 18, 2022
Tweet

More Decks by Marcus

Other Decks in Technology

Transcript

  1. I’m Marcus Hello! Blog : m@rcus 學習筆記 Fb : 學習筆記

    ▸ 專注在後端開發的工程師 ▸ 分享學習技術於 Blog & fb 粉絲團
  2. BCP (Business continuity plans) • 目的 • 公司在有限資源下必須持續進行的業務有哪些,並規劃如何持續進行這些業務。 • 業務解決方案,包括人員和流程以及技術

    • 流程 • Identify Business Critical Process / Data • Understand Business Impacts • Define and Implement BC Solution • Create Organizational Discipline • 項目 • Backup • Disaster Recovery • High Availability • Etc…
  3. BCP (Business continuity plans) Backup Disaster Recovery High Availability •

    Backup site / technology • Frequency • Data transformations • Scalability • Backup site / technology • Data transformations • Recovery process • Scalability • Communications • RTO、RPO • Failover process features • Failover technology • Monitoring • Failover routing • Communications • Post-incident data synchronization • SLA、SLO、SLI
  4. What is APM • APM • Application Performance Monitoring •

    Application Performance Management • Purpose • Goal • 提高對系統的了解 (Observability) • 縮短 MTTR (mean time to recover) What is APM? Application performance monitoring guide
  5. Why Elastic APM - Centralized Platform CNCF Observability Report 2020

    • The most commonly adopted tools are open source. • There’s no consolidation in the observability space • 50% using 5 or more tools • 30% using 10+ tools • Prometheus and Grafana are frequently used together. 統一解決方案 Radar: Observability, September 202
  6. Why Elastic APM - Signals Latency、Traffic Errors、Saturation Rate、Errors、Duration Utilization、Saturation、Errors (

    Application / Services ) ( Infrastructure ) Method Signals Five signals Note Request Rate : per sec. Error Rate : per sec. Latency : response time Saturation : how overloaded Utilization : how busy Metrics Traces Logs + + Golden Signals RED USE Monitoring Distributed Systems
  7. Traces – Where is the Problem Trace • Single Request

    = Transaction + Spans Helps • An end-to-end picture • spending time • where errors are occurring • where bottlenecks are forming How • Trace-Id and Parent-Id in HTTP header • W3C Trace Context specification
  8. Logs – What is causing the problem Stream • 查找、分析紀錄的應用程式

    Log 資訊 • Filebeat、ELK Includes • OS : CPU、Memory、Disk • Application、Database、Container logs 結構化日誌 (Structured Log) • Ts : 2022-12-11 message : login fail • 2022-12-11 Marcus login fail
  9. • NuGet Package Manager • Install-Package Elastic.Apm.NetCoreAll • Configuration •

    Use app.UseAllElasticApm(Configuration); method in startup.cs • Added ServerUrl、ServiceName、 Environment to appsettings.json • Elastic Stack with APM • docker-compose.yml How to use on ASP.NET Core
  10. Takeaway • Business Continuity • Elastic APM • Open Source、

    Centralized Platform、Signals • 快速無腦整合 • Metrics、Trace、Logging