Upgrade to Pro — share decks privately, control downloads, hide ads and more …

SYD Rancher Meetup June 17

SYD Rancher Meetup June 17

Rancher, Prometheus and inclusive monitoring. Associated source code: https://github.com/martinbaillie/rancher-meetup-prometheus

Martin Baillie

June 30, 2017
Tweet

More Decks by Martin Baillie

Other Decks in Technology

Transcript

  1. Tonight's Demo Environment: RancherOS: Fast, ultra-lightweight container OS GCP: 3

    Sydney zones as of last week.. $400 credit! try.rancher.com: Join hosts to your own free Rancher sandbox
  2. Inclusive Monitoring (I've seen this also called "whitebox monitoring") Is

    about not just monitoring at the edge: - CPU, Memory, Threads, Swap, Net, containerd But also instrumenting the code within. Both technology metrics - success rate, latency, saturation, pool size, db calls And equally important... business metrics! - e.g. insurance context: self-service logins, policies bought, quotes made, claims lodged, refunds given
  3. Rancher and the Prometheus ecosystem can help with that The

    demo will show these tools: Allowing developers to ship metrics, alerts, and dashboards alongside their code artefacts Having them auto-discovered (zero conf!) Achieving automatic monitoring of infrastructure, UIs and a microservice architecture as it changes Stored as code, shippable to multiple environments immutably
  4. Prometheus Is a monitoring [eco]system and time-series database Originally written

    by ex-Googlers @ Soundcloud Inspired by Google's Borgmon monitoring system Prometheus is to Borgmon what Kubernetes is to Borg...I guess Even though Borgmon remains internal to Google, the idea of treating time-series data as a data source for generating alerts is now accessible to everyone[SRE book on Prometheus] “ “
  5. Prometheus A community OSS project (no single company) With clear

    goals Measured acceptance of PRs And a careful eye on potential scope creep Second accepted project to the CNCF (after K8s) Enterprise support by RobustPerception.io Written (mostly) in Golang One of the most well-architected Go codebases I've studied </opinion>
  6. Key Features A powerful query language (Turing complete! ) Ef

    cient storage and dimensional data model Scalable telemetry (pull-based) monitoring Metric instrumenting libraries in many languages Tons of pre-canned exporters for existing systems Industry-leading visualisation by way of Grafana Alerting with many integrations via Alertmanager Simple APIs, easy deployment (static Golang binaries, Docker) and all con guration as code
  7. Pull-based Architecture pull metrics HDD / SSD Pushgateway Short-lived jobs

    Jobs / Exporters Storage Retrieval PromQL Prometheus Server Node Service Discovery find targets Prometheus Server Alertmanager push alerts Web UI Grafana API clients PagerDuty Email DNS Kubernetes Consul ... Custom integration notify ...
  8. As an aside: Metric != Log Metrics are not a

    panacea. You will need multiple complementary tools for successful debugging. Metrics cheap, low cardinality store lots Logs expensive, high cardinality store few Metrics for which service in a distributed system issue is. Log for digging deeper e.g. which request. Also, Metric != Trace You will still likely need distributed tracing in your microservice architecture (see OpenTracing, Zipkin)
  9. Metric Exporters and Client Libraries (not exhaustive) Server, SNMP, Dovecot,

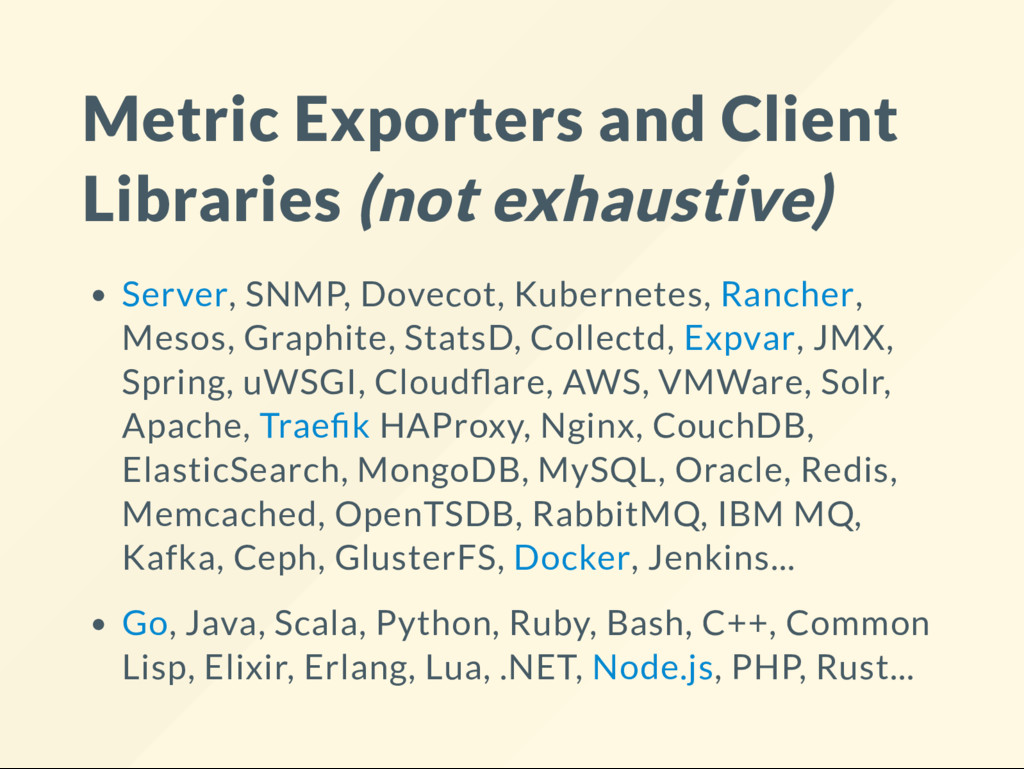
    Kubernetes, Rancher, Mesos, Graphite, StatsD, Collectd, Expvar, JMX, Spring, uWSGI, Cloud are, AWS, VMWare, Solr, Apache, Trae k HAProxy, Nginx, CouchDB, ElasticSearch, MongoDB, MySQL, Oracle, Redis, Memcached, OpenTSDB, RabbitMQ, IBM MQ, Kafka, Ceph, GlusterFS, Docker, Jenkins... Go, Java, Scala, Python, Ruby, Bash, C++, Common Lisp, Elixir, Erlang, Lua, .NET, Node.js, PHP, Rust...
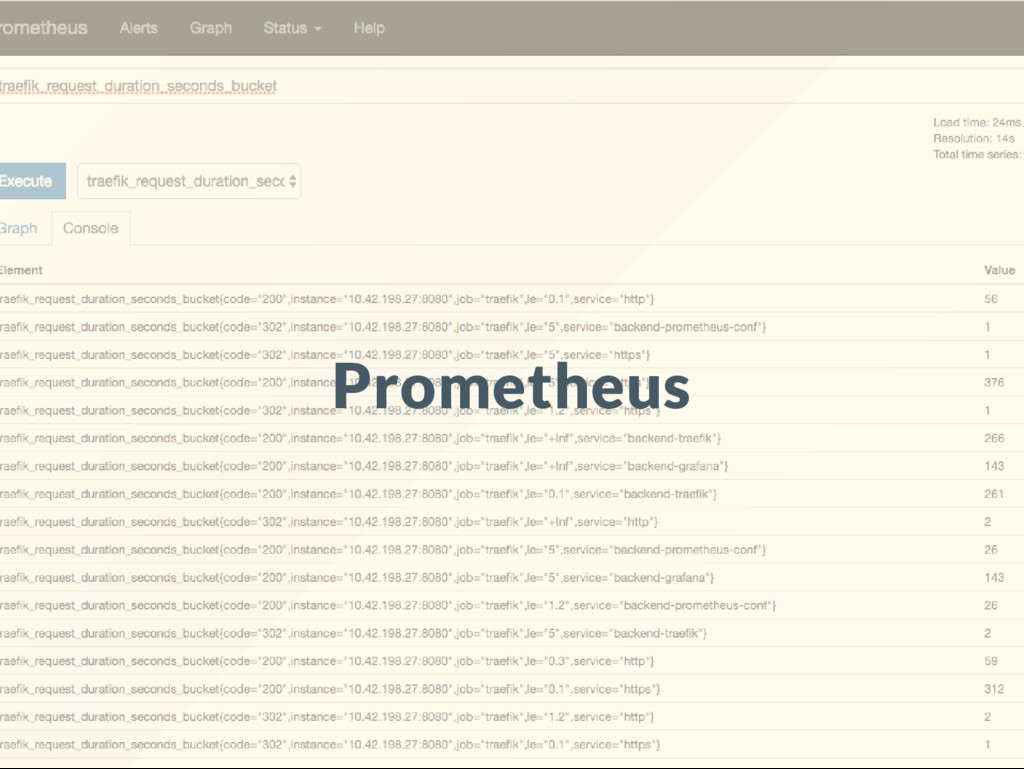
  10. Metric Instrumentation Example: time taken to service a HTTP request?

    Golang var requestDuration = prometheus.NewSummaryVec( prometheus.SummaryOpts{ Name: "request_duration_seconds", Help: "Request duration in seconds", }, []string{}) func my_handler(w http.ResponseWriter, r *http.Request) { defer func(begin time.Time) { requestDuration.With(nil).Observe( time.Since(begin).Seconds()) }(time.Now()) // Your code here
  11. Even less LOC in other langs Python Decorators REQUEST_DURATION =

    Summary('request_duration_seconds', 'Request duration in seconds') @REQUEST_DURATION.time() def my_handler(request): pass # Your code here Java Annotations @RequestMapping @PrometheusTimeMethod(name = "request_duration_seconds", help="Request duration in seconds") public myHandler() { // Your code here
  12. Eggs In One Basket Or: How I don't like hedging

    my bets in this industry 1. Just like how using Rancher as my container management does not preclude me from using: Kubernetes, Mesos, Swarm as my orchestrator 2. Or how annotating my microservice code with OpenTracing does not preclude me from using: Zipkin, AppDash, Jaegar as my tracer Prometheus libraries are open too! Instrument code using them; export to Graphite, Collectd, Nagios etc.
  13. Alert On What Matters ALERT HostDiskWillFillIn2Hours IF sum(predict_linear(node_filesystem_free[30m], 2*3600)) <

    0 LABELS { severity = "page" } ANNOTATIONS { summary="{{$labels.instance}} disk will fill in 2 hrs" ALERT RancherContainerInstanceUnhealthy IF rancher_service_health_status{health_state != "healthy"} == 1 FOR 5m LABELS { severity="notify", method="slack" } ALERT AbnormalSelfServicePortalLoginRate # Outside its Holt-Winters exponentially smoothed forecast IF abs(job:portal_logins:rate1m - job:portal_logins:holt_winters_rate5m) > abs(0.6 * job:portal_logins:holt_winters_rate5m)
  14. Alertmanager Handles alerts sent by Prometheus (or other clients) Takes

    care of: Grouping alerts of similar nature by category De-duplication of the same alerts Silencing alerts. Keep signal to noise ratio low! Routing alerts to receivers Email, SMS, Slack, HipChat, PagerDuty, OpsGenie, VictorOps, Webhooks
  15. Grafana Leading open-source platform for beautifully visualising time-series analytics and

    monitoring Takes care of: Querying Prometheus as a datasource Building dashboards on the exact queries you're using in Prometheus for alerts, reporting Also has hundreds of pre-canned dashboards and other datasources e.g. Graphite, ElasticSearch, CloudWatch, In uxDB, Splunk, DataDog, OpenTSDB