Upgrade to Pro — share decks privately, control downloads, hide ads and more …

Swift Charts で「良い感じ」に3変数を持つデータを表示するまでの軌跡

Avatar for Matsue Kenta Matsue Kenta
August 24, 2023
290

Swift Charts で「良い感じ」に3変数を持つデータを表示するまでの軌跡

Swift Charts で「良い感じ」に3変数を持つデータを表示するまでの軌跡

Avatar for Matsue Kenta

Matsue Kenta

August 24, 2023
Tweet

Transcript

  1. struct Record: Identifiable { var id: UUID = UUID() let

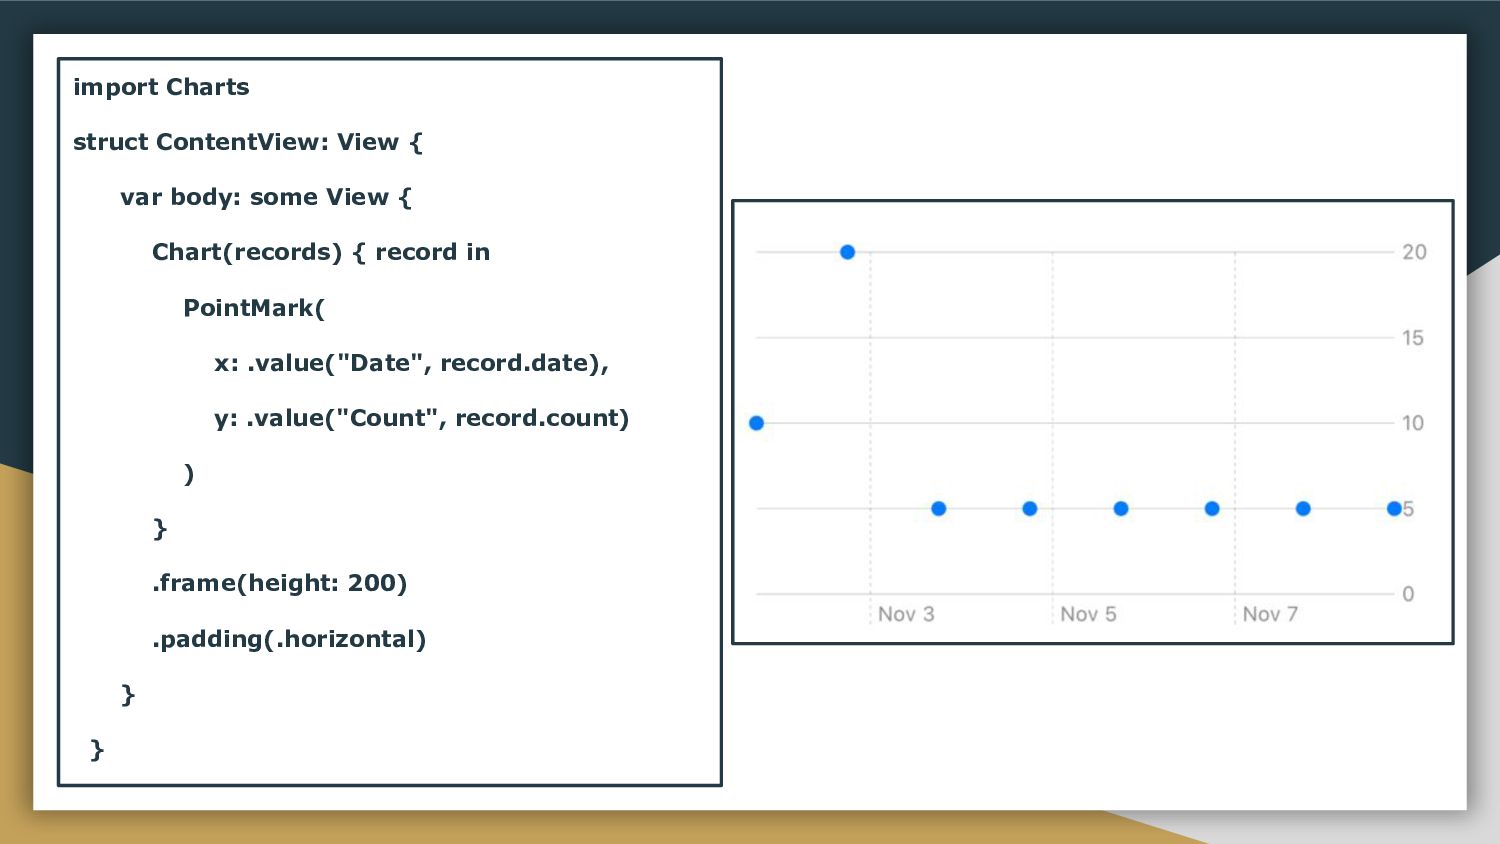
    date: Date let count: Int } var records: [Record] = [ Record(date: DateComponents(calendar: .current, year: 2022, month: 11, day: 1, hour: 18).date!, count: 10), Record(date: DateComponents(calendar: .current, year: 2022, month: 11, day: 2, hour: 18).date!, count: 20), Record(date: DateComponents(calendar: .current, year: 2022, month: 11, day: 3, hour: 18).date!, count: 5), Record(date: DateComponents(calendar: .current, year: 2022, month: 11, day: 4, hour: 18).date!, count: 5), Record(date: DateComponents(calendar: .current, year: 2022, month: 11, day: 5, hour: 18).date!, count: 5), Record(date: DateComponents(calendar: .current, year: 2022, month: 11, day: 6, hour: 18).date!, count: 5), Record(date: DateComponents(calendar: .current, year: 2022, month: 11, day: 7, hour: 18).date!, count: 5), Record(date: DateComponents(calendar: .current, year: 2022, month: 11, day: 8, hour: 18).date!, count: 5), ]
  2. import Charts struct ContentView: View { var body: some View

    { Chart(records) { record in PointMark( x: .value("Date", record.date), y: .value("Count", record.count) ) } .frame(height: 200) .padding(.horizontal) } }
  3. import Charts struct ContentView: View { var body: some View

    { Chart(records) { record in PointMark( x: .value("Date", record.date), y: .value("Count", record.count) ) } .frame(height: 200) .padding(.horizontal) } }
  4. struct ContentView: View { var body: some View { Chart(records)

    { record in PointMark( x: .value("Date", record.date), y: .value("Count", record.count) ) } .chartXAxis { AxisGridLine() } .frame(height: 200) .padding(.horizontal)
  5. struct ContentView: View { var body: some View { Chart(records)

    { record in PointMark( x: .value("Date", record.date), y: .value("Count", record.count) ) } .chartXAxis { AxisGridLine() AxisTick() AxisValueLabel(format:.dateTime.day()) }
  6. 日 種目 重量 REP 2023年8月11日 ベンチプレス 60kg 10 2023年8月11日 ベンチプレス

    60kg 10 2023年8月11日 ベンチプレス 60kg 8 2023年8月11日 ベンチプレス 50kg 10 2023年8月11日 ケーブルフライ 20kg 10
  7. var records: [Record] = [ Record(date: DateComponents(calendar: .current, year: 2023,

    month: 8, day: 11, hour: 18, minute: 10).date!, reps: 10, weight: 60), Record(date: DateComponents(calendar: .current, year: 2023, month: 8, day: 11, hour: 18, minute: 12).date!, reps: 10, weight: 60), Record(date: DateComponents(calendar: .current, year: 2023, month: 8, day: 11, hour: 18, minute: 15).date!, reps: 8, weight: 60), Record(date: DateComponents(calendar: .current, year: 2023, month: 8, day: 11, hour: 18, minute: 18).date!, reps: 10, weight: 50), ]
  8. struct ContentView: View { var body: some View { Chart(records)

    { PointMark( x: .value("Date", $0.date), y: .value("Reps", $0.reps) ) } .frame(height: 200) .padding(.horizontal) } }
  9. 方法3 Chart(records) { PointMark( x: .value("Date", $0.date), y: .value("Reps", $0.reps)

    ) .annotation(position: .overlay, alignment: .center) { Text(String(record.weight)) } .symbolSize(0) }