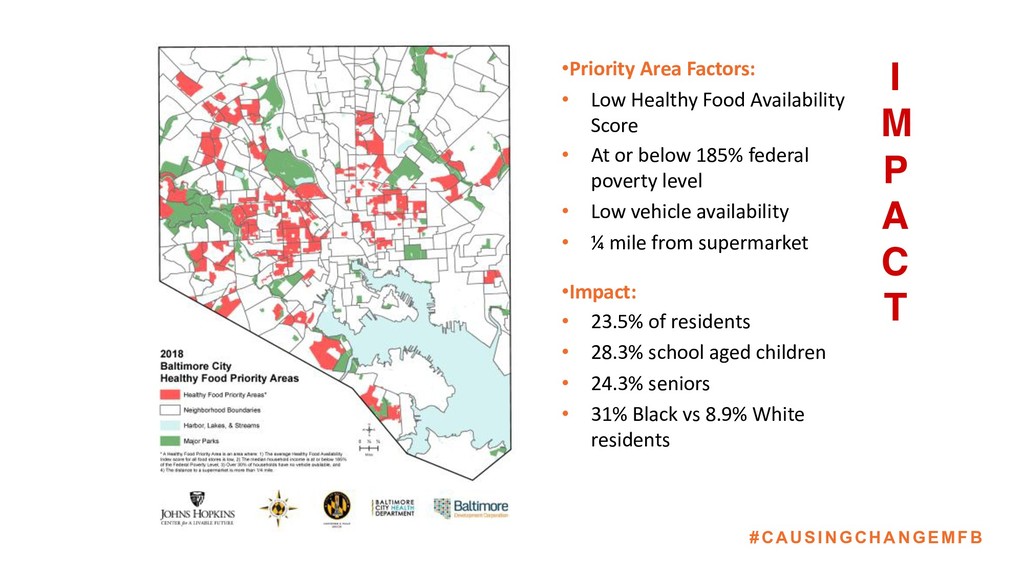
• Low Healthy Food Availability Score • At or below 185% federal poverty level • Low vehicle availability • ¼ mile from supermarket •Impact: • 23.5% of residents • 28.3% school aged children • 24.3% seniors • 31% Black vs 8.9% White residents
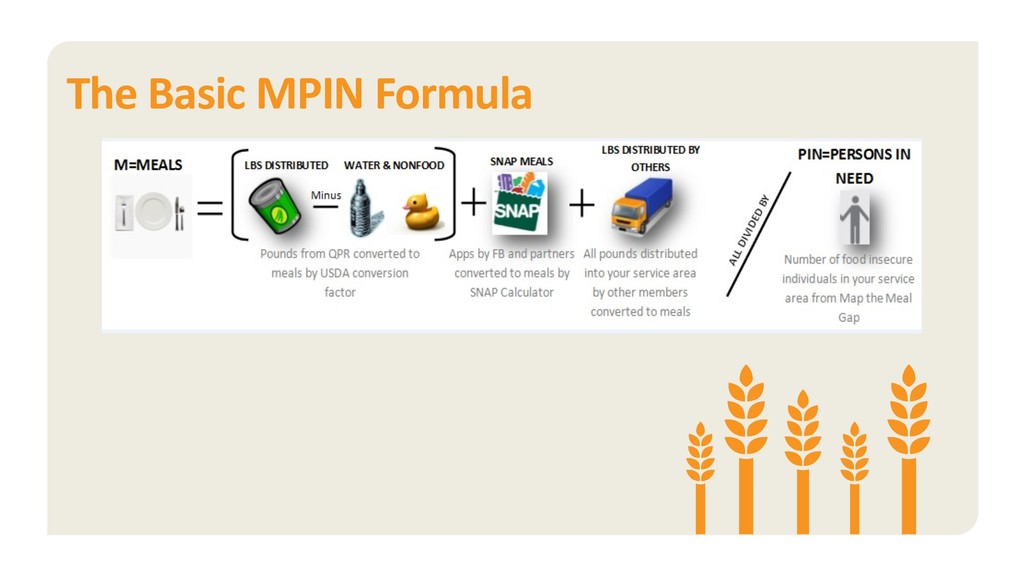
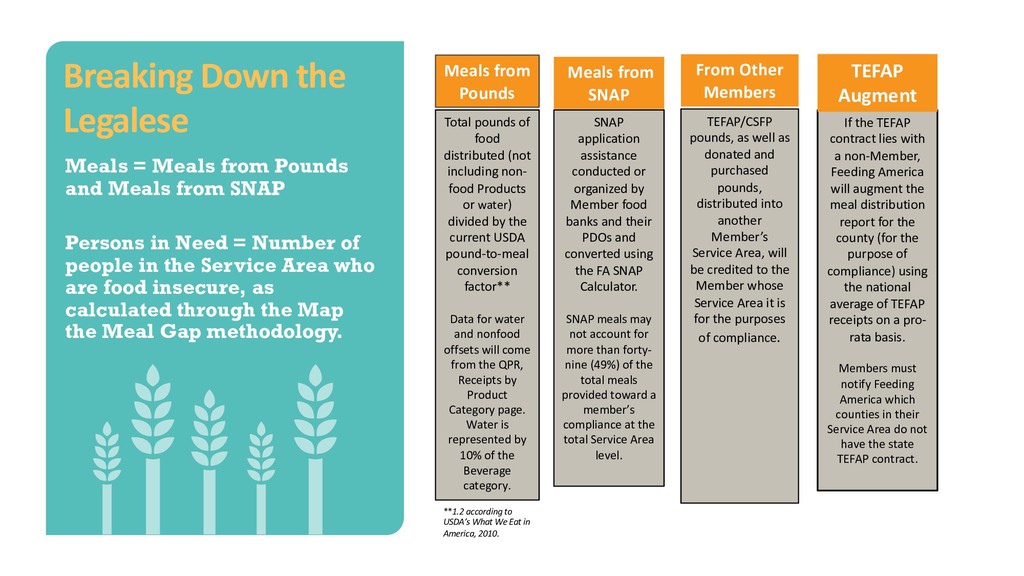
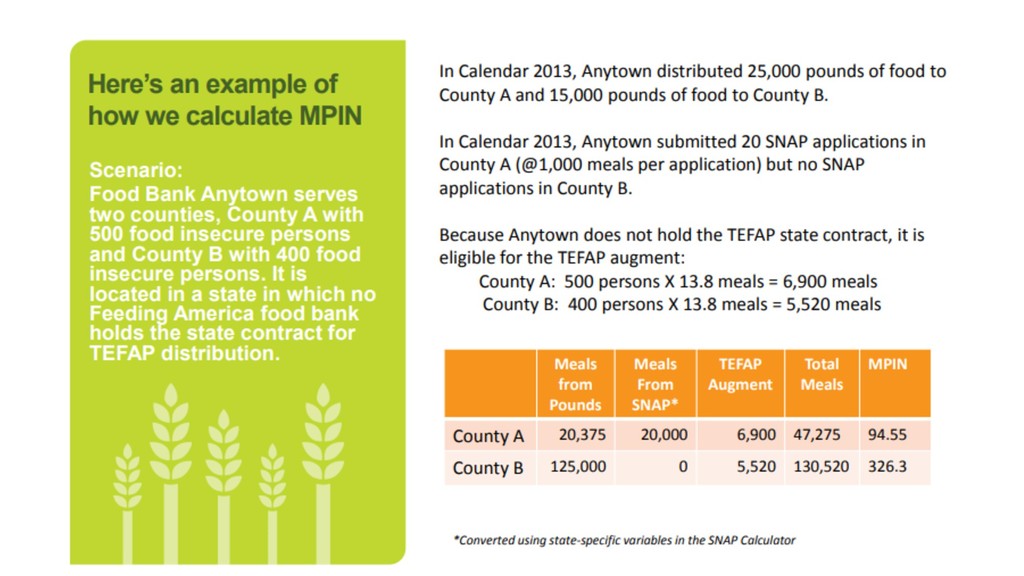
Meals from SNAP Persons in Need = Number of people in the Service Area who are food insecure, as calculated through the Map the Meal Gap methodology. **1.2 according to USDA’s What We Eat in America, 2010. Total pounds of food distributed (not including non- food Products or water) divided by the current USDA pound-to-meal conversion factor** Data for water and nonfood offsets will come from the QPR, Receipts by Product Category page. Water is represented by 10% of the Beverage category. SNAP application assistance conducted or organized by Member food banks and their PDOs and converted using the FA SNAP Calculator. SNAP meals may not account for more than forty- nine (49%) of the total meals provided toward a member’s compliance at the total Service Area level. TEFAP/CSFP pounds, as well as donated and purchased pounds, distributed into another Member’s Service Area, will be credited to the Member whose Service Area it is for the purposes of compliance. If the TEFAP contract lies with a non-Member, Feeding America will augment the meal distribution report for the county (for the purpose of compliance) using the national average of TEFAP receipts on a pro- rata basis. Members must notify Feeding America which counties in their Service Area do not have the state TEFAP contract. Meals from Pounds Meals from SNAP From Other Members TEFAP Augment
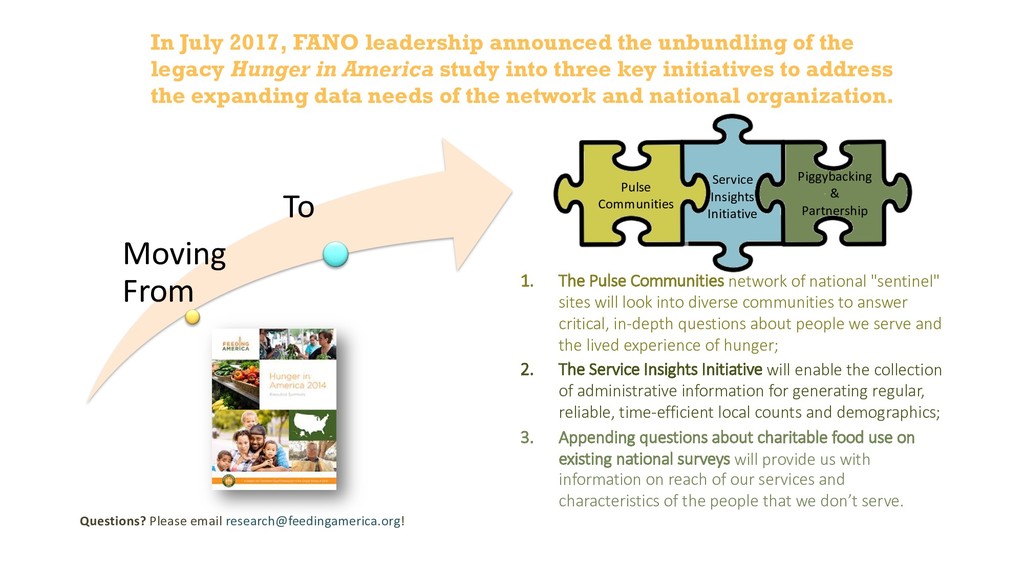
2017, FANO leadership announced the unbundling of the legacy Hunger in America study into three key initiatives to address the expanding data needs of the network and national organization. 1. The Pulse Communities network of national "sentinel" sites will look into diverse communities to answer critical, in-depth questions about people we serve and the lived experience of hunger; 2. The Service Insights Initiative will enable the collection of administrative information for generating regular, reliable, time-efficient local counts and demographics; 3. Appending questions about charitable food use on existing national surveys will provide us with information on reach of our services and characteristics of the people that we don’t serve. Moving From To Questions? Please email [email protected]!
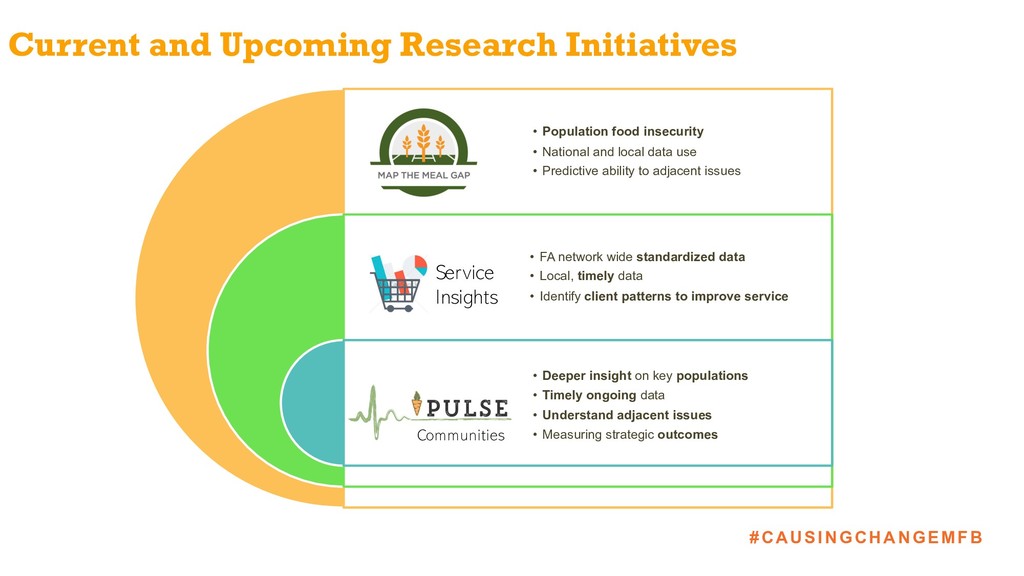
• National and local data use • Predictive ability to adjacent issues • FA network wide standardized data • Local, timely data • Identify client patterns to improve service • Deeper insight on key populations • Timely ongoing data • Understand adjacent issues • Measuring strategic outcomes Communities Service Insights
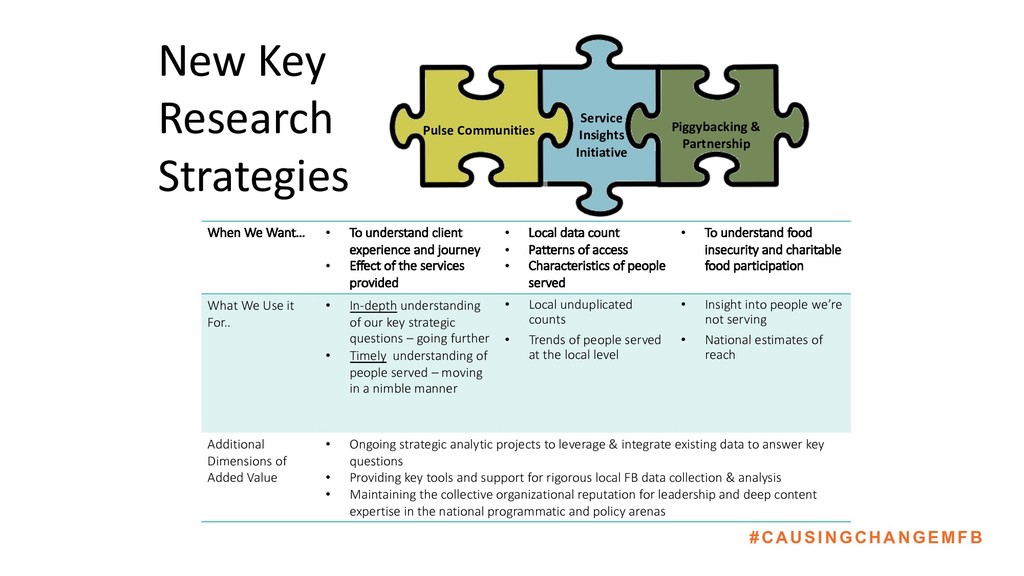
We Want… • To understand client experience and journey • Effect of the services provided • Local data count • Patterns of access • Characteristics of people served • To understand food insecurity and charitable food participation What We Use it For.. • In-depth understanding of our key strategic questions – going further • Timely understanding of people served – moving in a nimble manner • Local unduplicated counts • Trends of people served at the local level • Insight into people we’re not serving • National estimates of reach Additional Dimensions of Added Value • Ongoing strategic analytic projects to leverage & integrate existing data to answer key questions • Providing key tools and support for rigorous local FB data collection & analysis • Maintaining the collective organizational reputation for leadership and deep content expertise in the national programmatic and policy arenas New Key Research Strategies
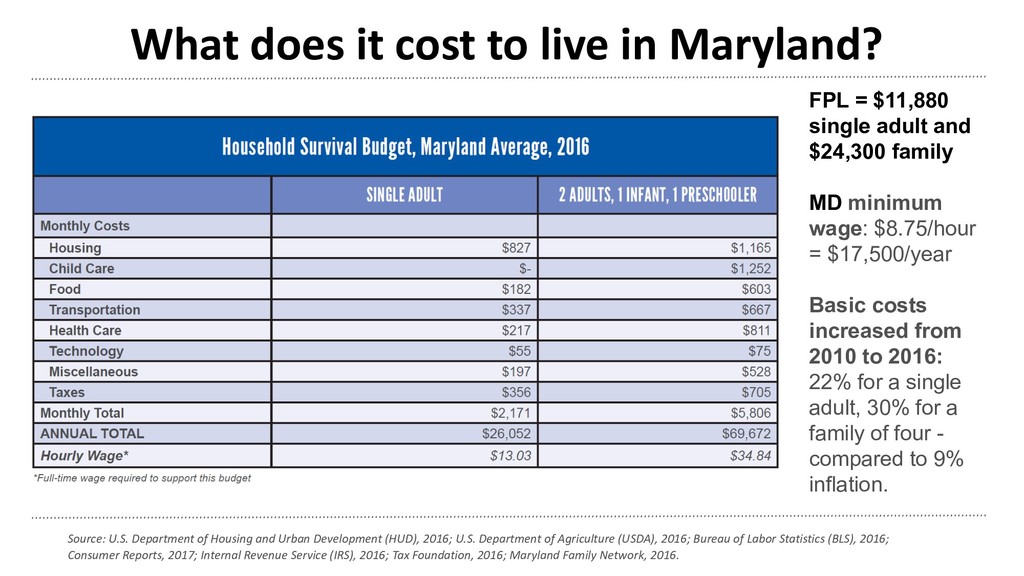
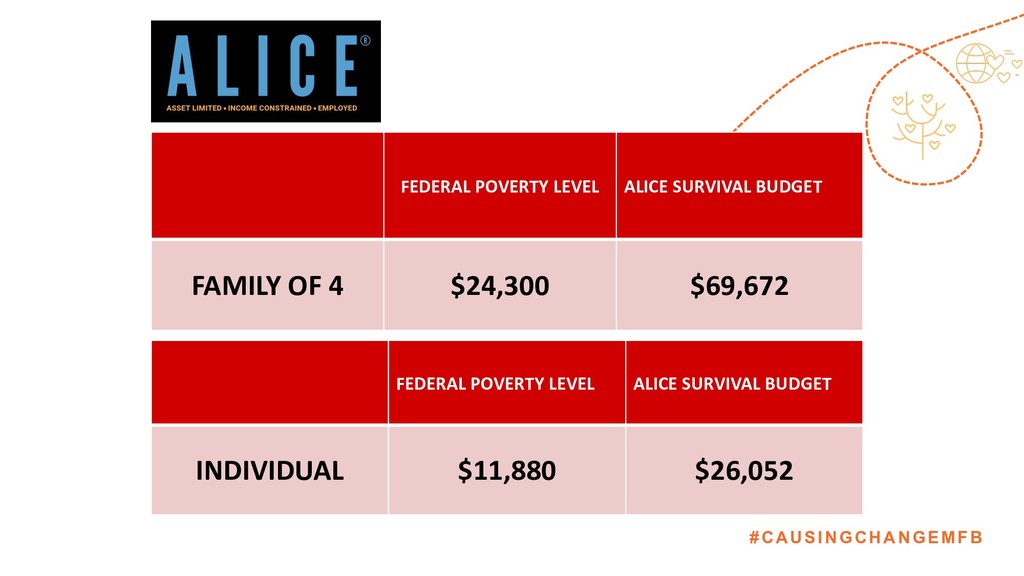
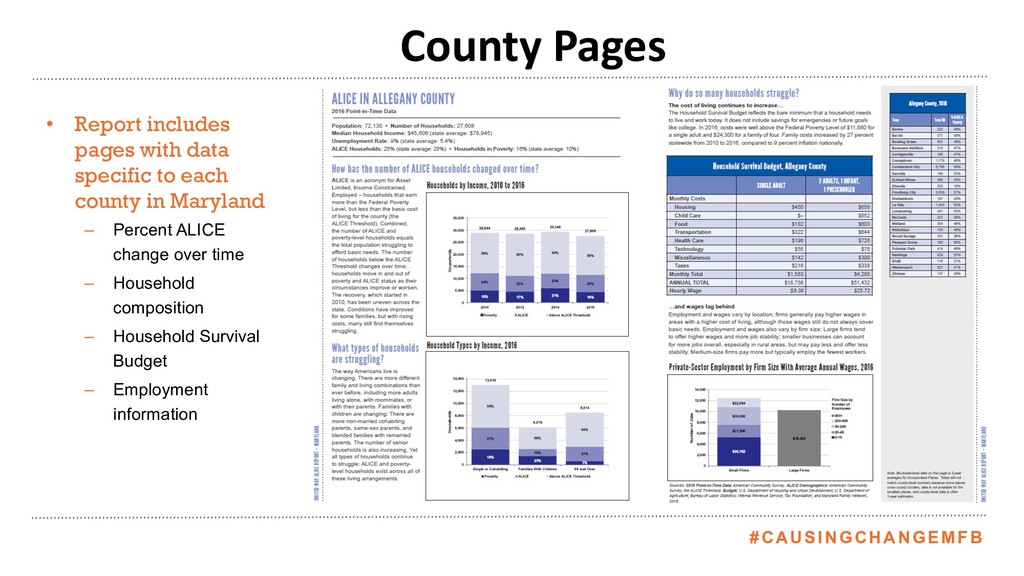
Department of Housing and Urban Development (HUD), 2016; U.S. Department of Agriculture (USDA), 2016; Bureau of Labor Statistics (BLS), 2016; Consumer Reports, 2017; Internal Revenue Service (IRS), 2016; Tax Foundation, 2016; Maryland Family Network, 2016. FPL = $11,880 single adult and $24,300 family MD minimum wage: $8.75/hour = $17,500/year Basic costs increased from 2010 to 2016: 22% for a single adult, 30% for a family of four - compared to 9% inflation.
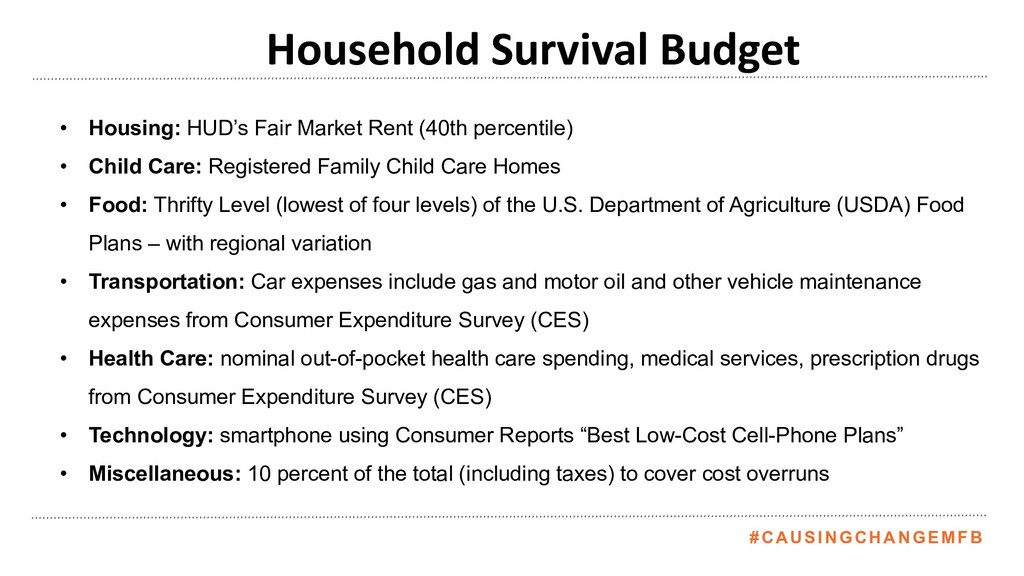
(40th percentile) • Child Care: Registered Family Child Care Homes • Food: Thrifty Level (lowest of four levels) of the U.S. Department of Agriculture (USDA) Food Plans – with regional variation • Transportation: Car expenses include gas and motor oil and other vehicle maintenance expenses from Consumer Expenditure Survey (CES) • Health Care: nominal out-of-pocket health care spending, medical services, prescription drugs from Consumer Expenditure Survey (CES) • Technology: smartphone using Consumer Reports “Best Low-Cost Cell-Phone Plans” • Miscellaneous: 10 percent of the total (including taxes) to cover cost overruns
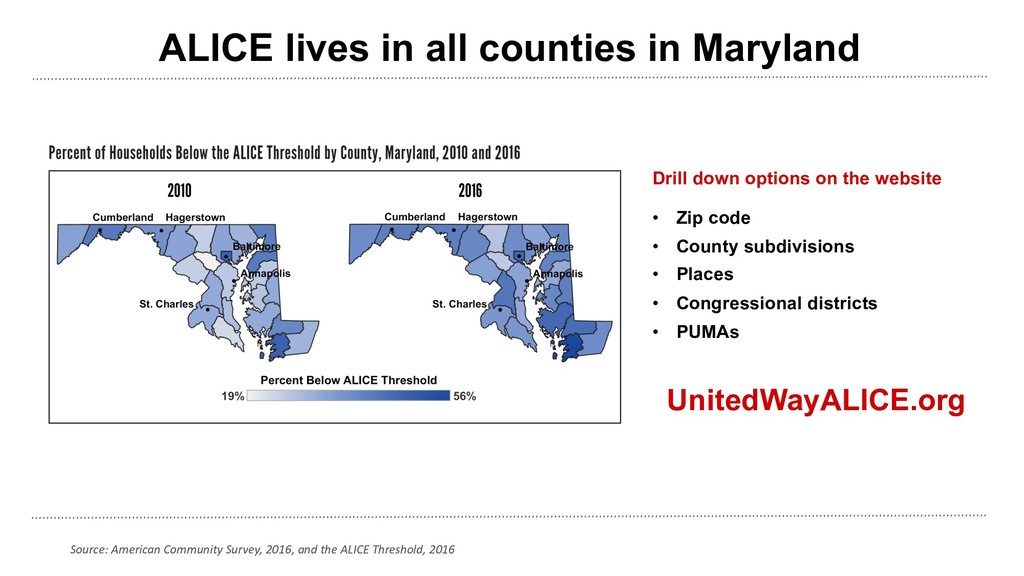
Survey, 2016, and the ALICE Threshold, 2016 Drill down options on the website • Zip code • County subdivisions • Places • Congressional districts • PUMAs UnitedWayALICE.org
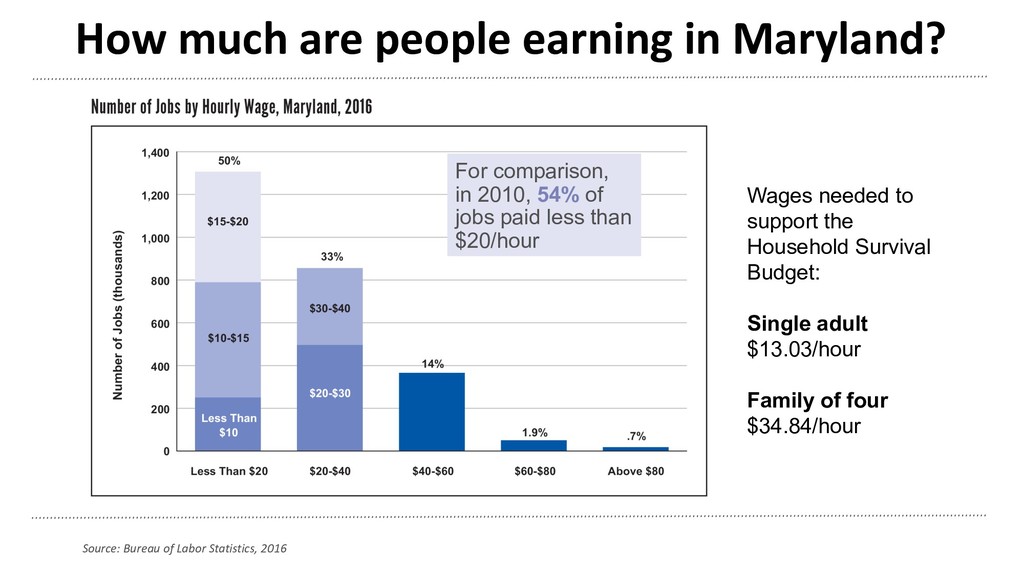
Labor Statistics, 2016 Wages needed to support the Household Survival Budget: Single adult $13.03/hour Family of four $34.84/hour For comparison, in 2010, 54% of jobs paid less than $20/hour
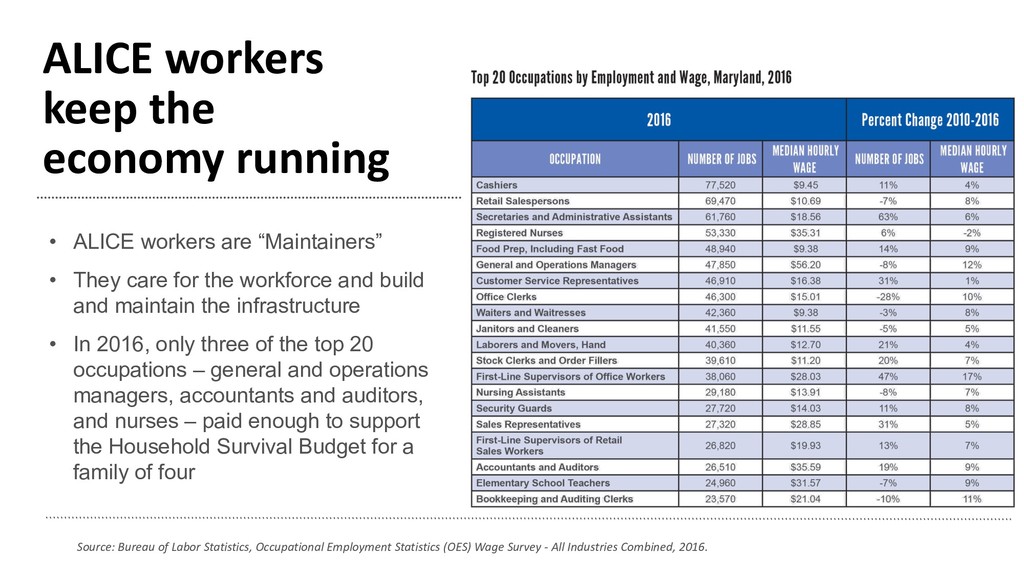
Statistics, Occupational Employment Statistics (OES) Wage Survey - All Industries Combined, 2016. • ALICE workers are “Maintainers” • They care for the workforce and build and maintain the infrastructure • In 2016, only three of the top 20 occupations – general and operations managers, accountants and auditors, and nurses – paid enough to support the Household Survival Budget for a family of four
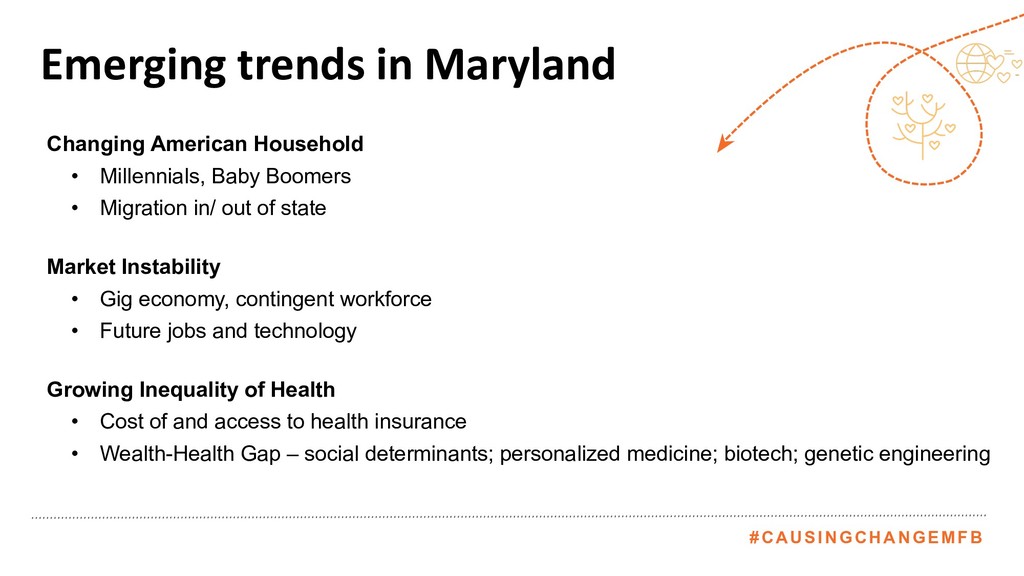
Baby Boomers • Migration in/ out of state Market Instability • Gig economy, contingent workforce • Future jobs and technology Growing Inequality of Health • Cost of and access to health insurance • Wealth-Health Gap – social determinants; personalized medicine; biotech; genetic engineering
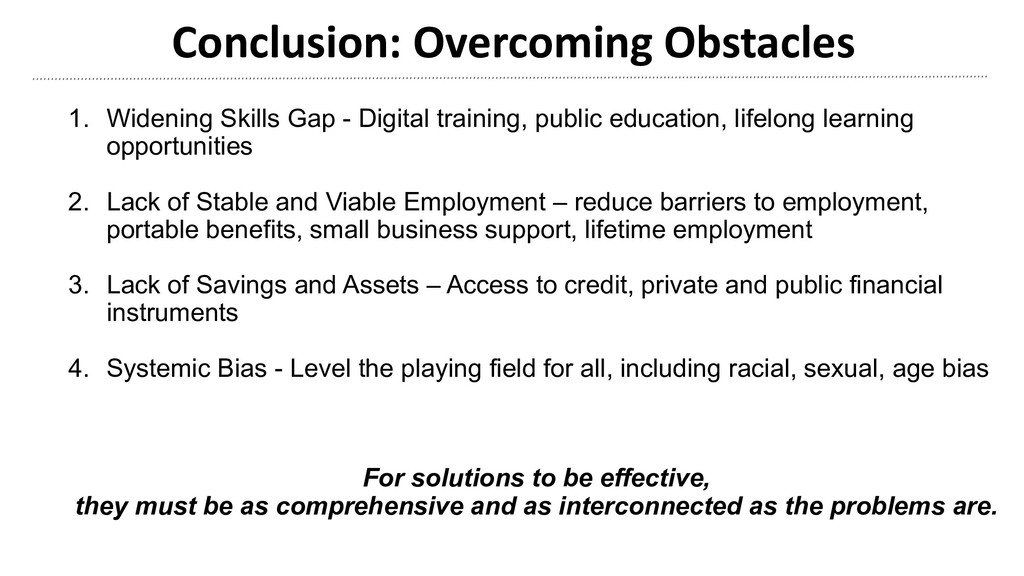
public education, lifelong learning opportunities 2. Lack of Stable and Viable Employment – reduce barriers to employment, portable benefits, small business support, lifetime employment 3. Lack of Savings and Assets – Access to credit, private and public financial instruments 4. Systemic Bias - Level the playing field for all, including racial, sexual, age bias For solutions to be effective, they must be as comprehensive and as interconnected as the problems are.
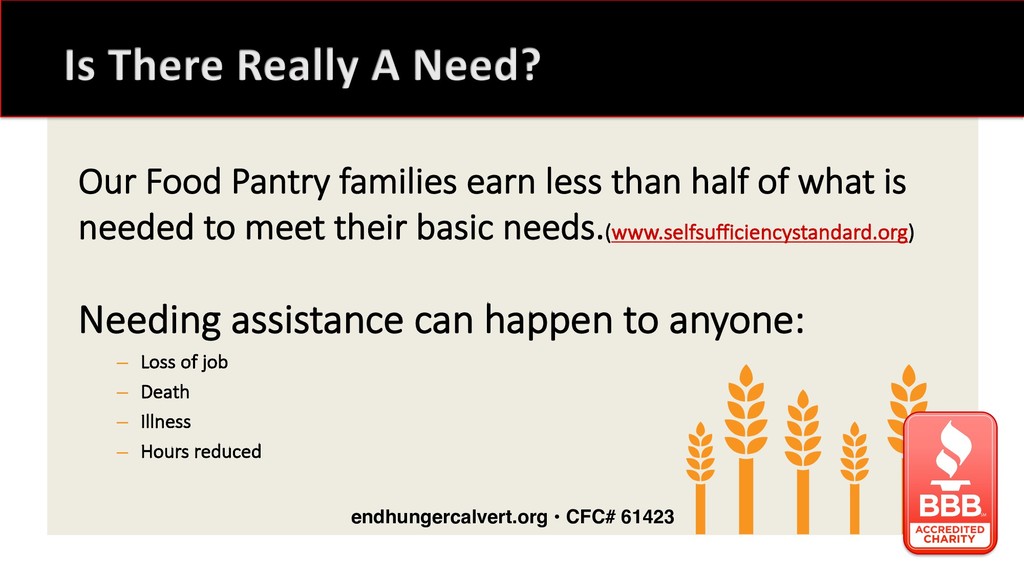
is needed to meet their basic needs.(www.selfsufficiencystandard.org) Needing assistance can happen to anyone: – Loss of job – Death – Illness – Hours reduced endhungercalvert.org • CFC# 61423
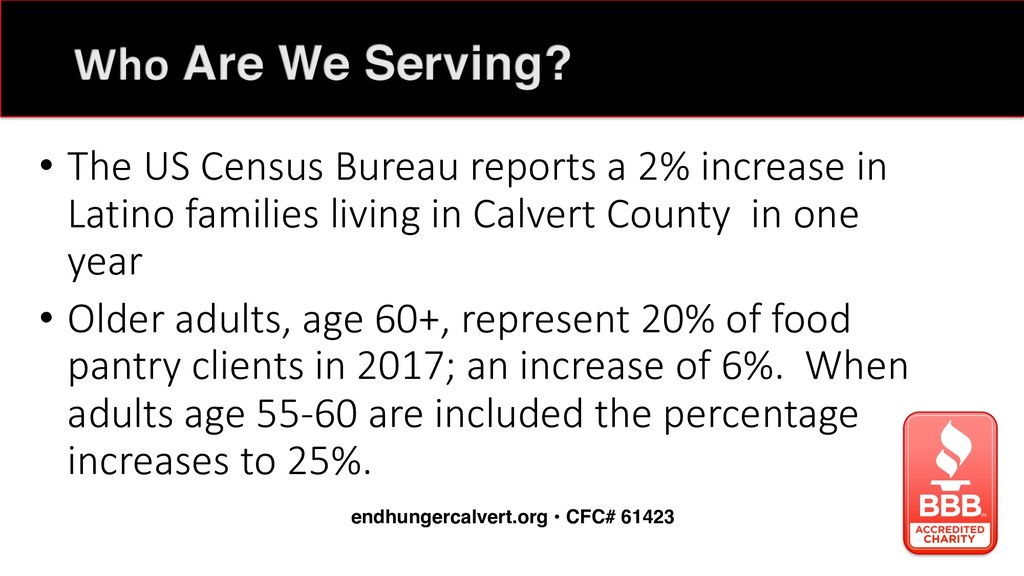
Latino families living in Calvert County in one year • Older adults, age 60+, represent 20% of food pantry clients in 2017; an increase of 6%. When adults age 55-60 are included the percentage increases to 25%. • CHESAPEAKECHURCH.ORG/FOODPANTRY CFC#35867 endhungercalvert.org • CFC# 61423
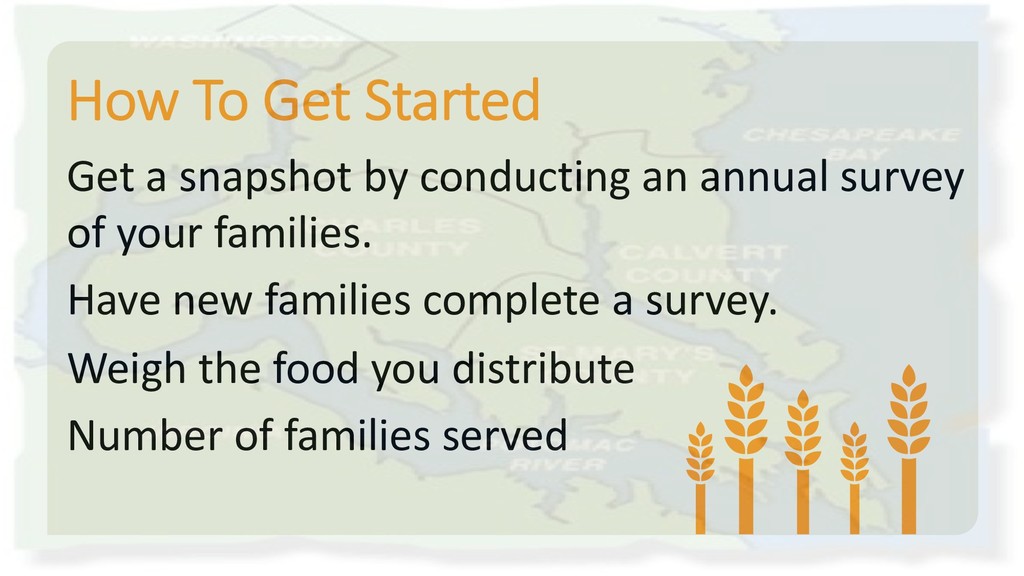
Meeting Your Goals and Objectives? Do You Know Your Population? Do You have The Capacity to Manage A Project? CHESAPEAKECHURCH.ORG/FOODPANTRY CFC#35867
www.census.gov/quickfacts www.data.Maryland.gov www.unitedwayalice.org https://aspe.hhs.gov/poverty-guidelines www.feedingamerica.org www.mdhungersolutions.org www.mdfoodbank.org www.jhsph.edu/research/centers-and- institutes/johns-hopkins-center-for-a-livable- future/ But We Don’t Have The Time, People or Ability To Collect Data.
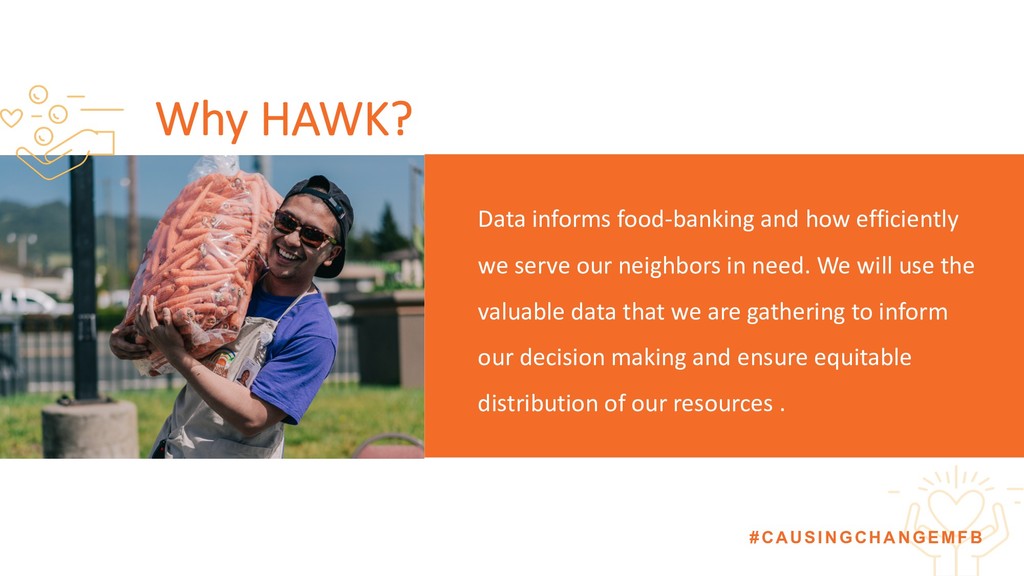
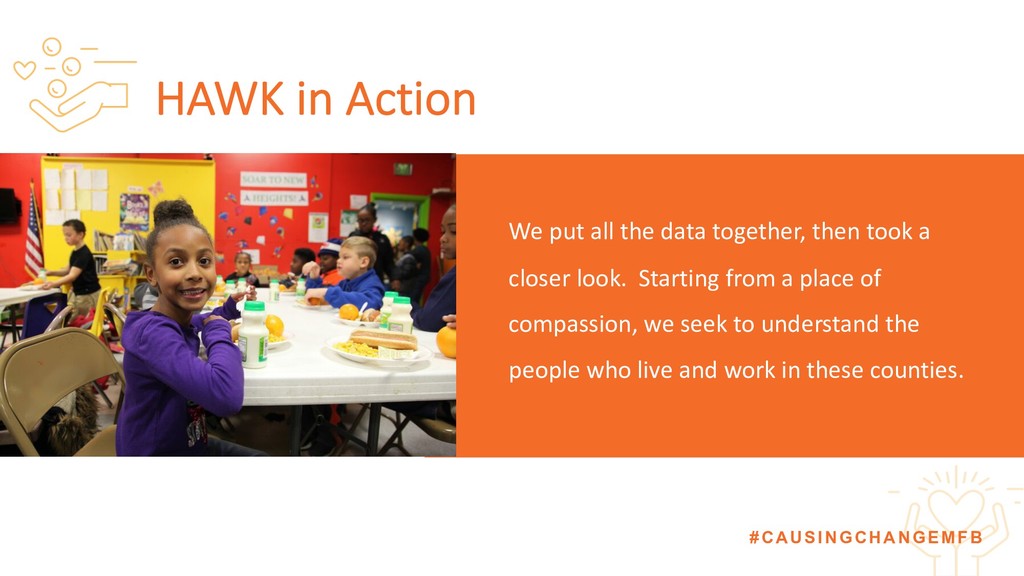
serve our neighbors in need. We will use the valuable data that we are gathering to inform our decision making and ensure equitable distribution of our resources .
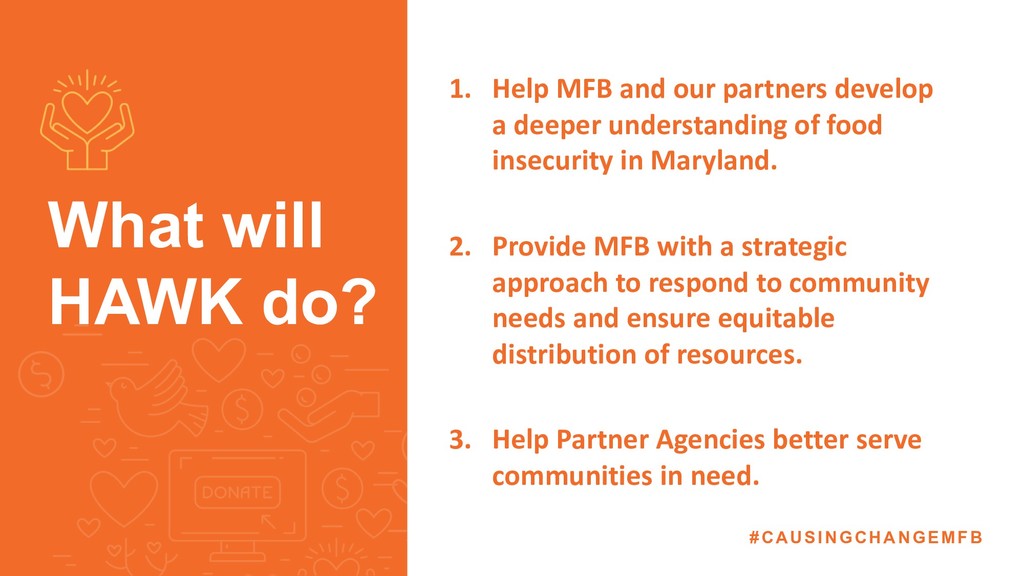
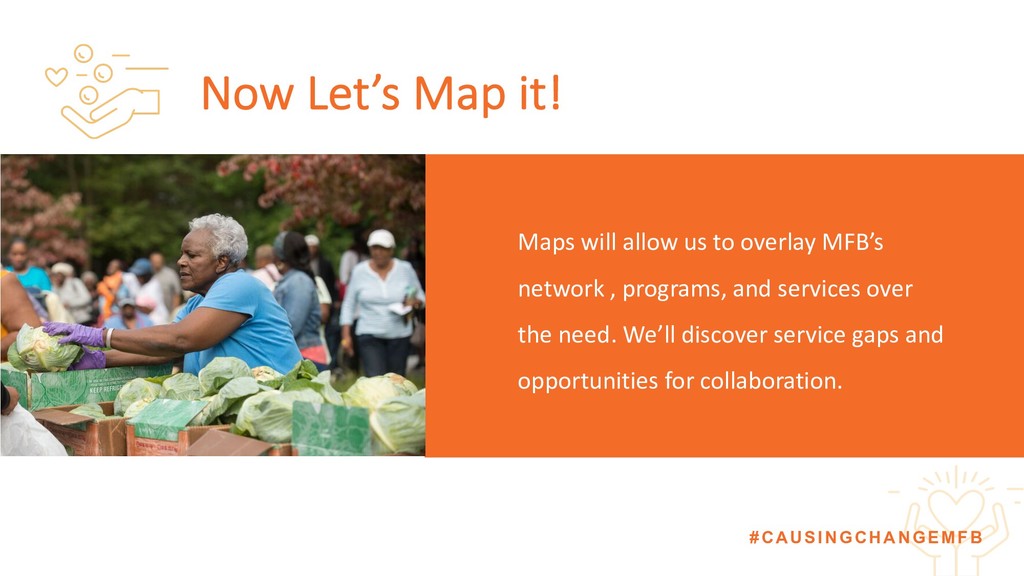
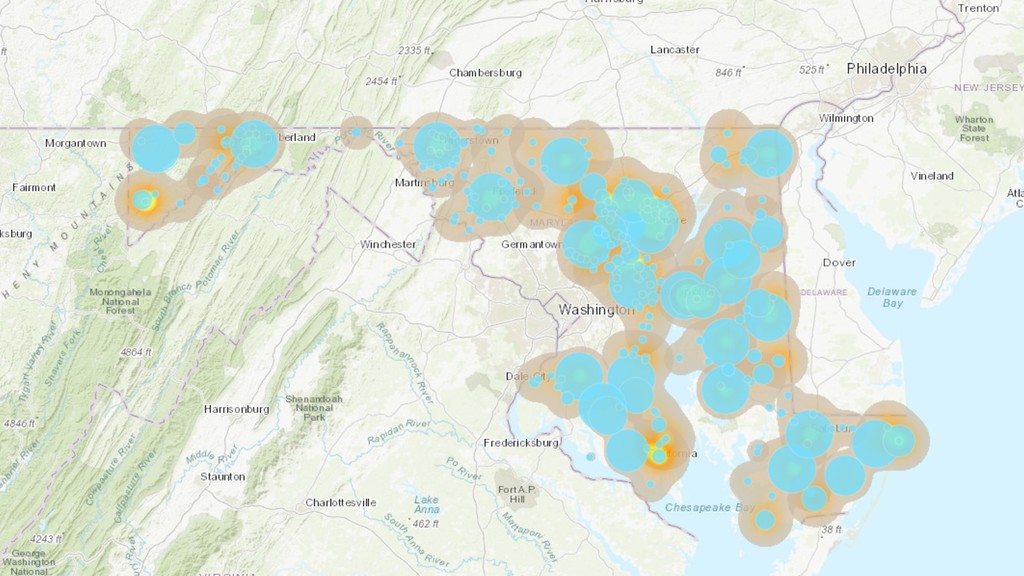
understanding of food insecurity in Maryland. 2. Provide MFB with a strategic approach to respond to community needs and ensure equitable distribution of resources. 3. Help Partner Agencies better serve communities in need. What will HAWK do?
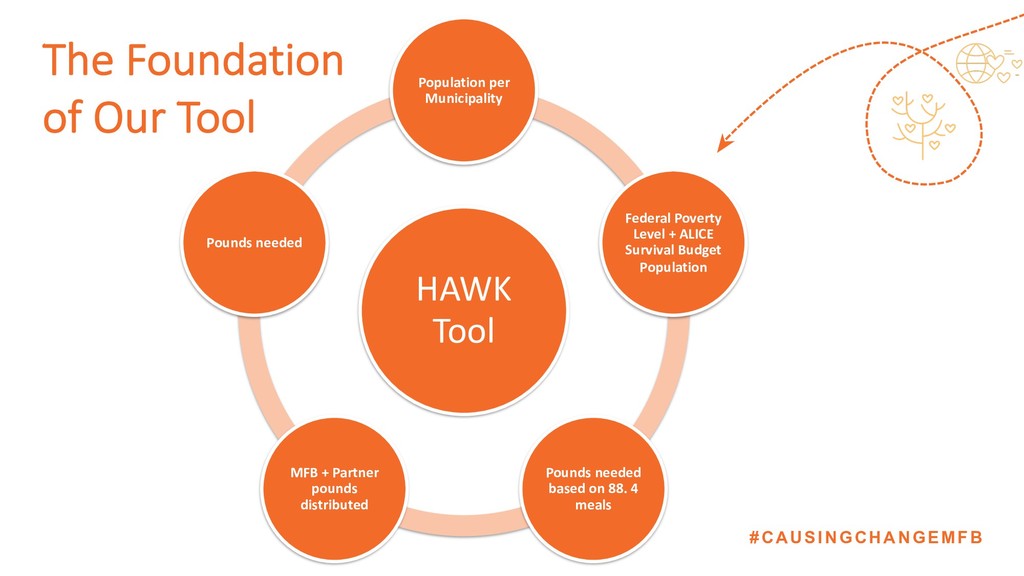
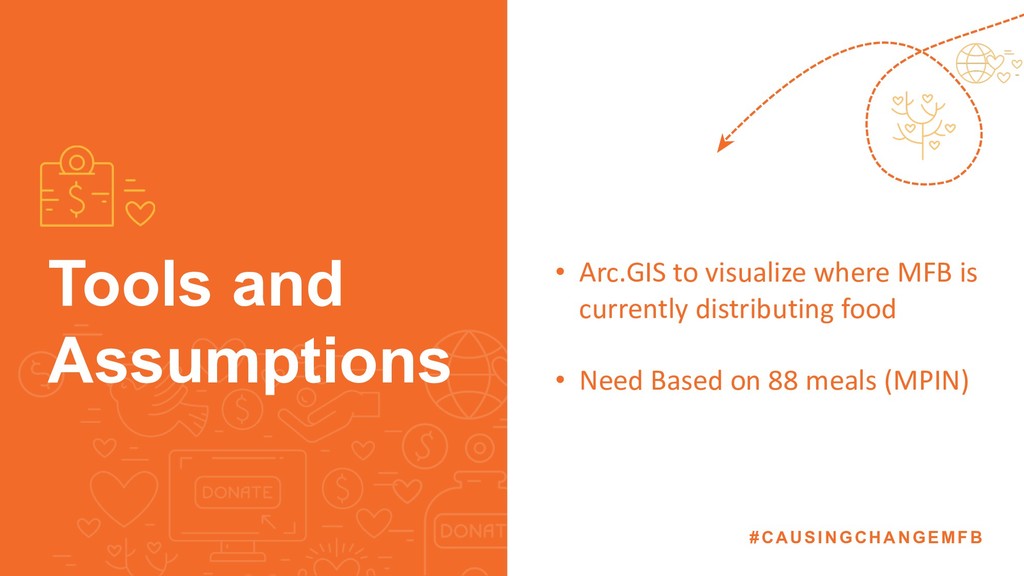
Municipality Federal Poverty Level + ALICE Survival Budget Population Pounds needed based on 88. 4 meals MFB + Partner pounds distributed Pounds needed
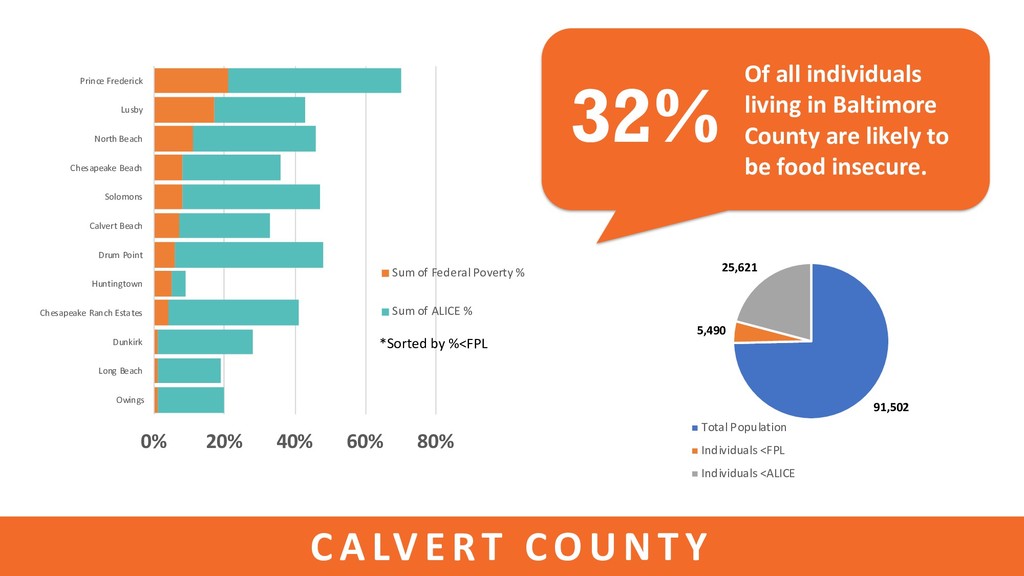
Chesapeake Ranch Estates Huntingtown Drum Point Calvert Beach Solomons Chesapeake Beach North Beach Lusby Prince Frederick Sum of Federal Poverty % Sum of ALICE % *Sorted by %<FPL CA LV ERT COU N TY 91,502 5,490 25,621 Total Population Individuals <FPL Individuals <ALICE 32% Of all individuals living in Baltimore County are likely to be food insecure.
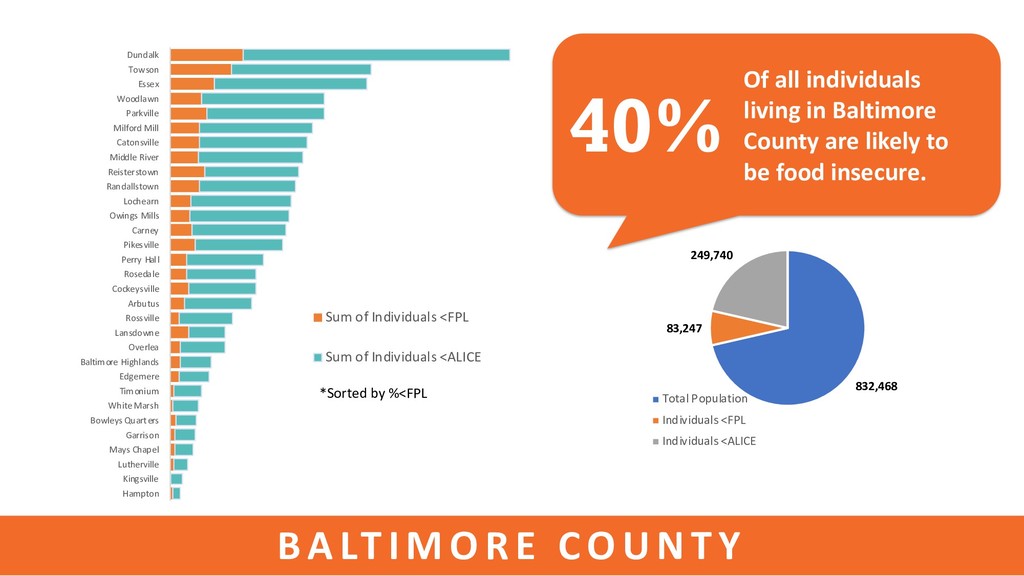
Marsh Timonium Edgemere Baltimore Highlands Overlea Lansdowne Rossville Arbutus Cockeysville Rosedale Perry Hall Pikesville Carney Owings Mills Lochearn Randallstown Reisterstown Middle River Catonsville Milford Mill Parkville Woodlawn Essex Towson Dundalk Sum of Individuals <FPL Sum of Individuals <ALICE Of all individuals living in Baltimore County are likely to be food insecure. 40% 832,468 83,247 249,740 Total Population Individuals <FPL Individuals <ALICE *Sorted by %<FPL BA LTIM ORE COU N TY
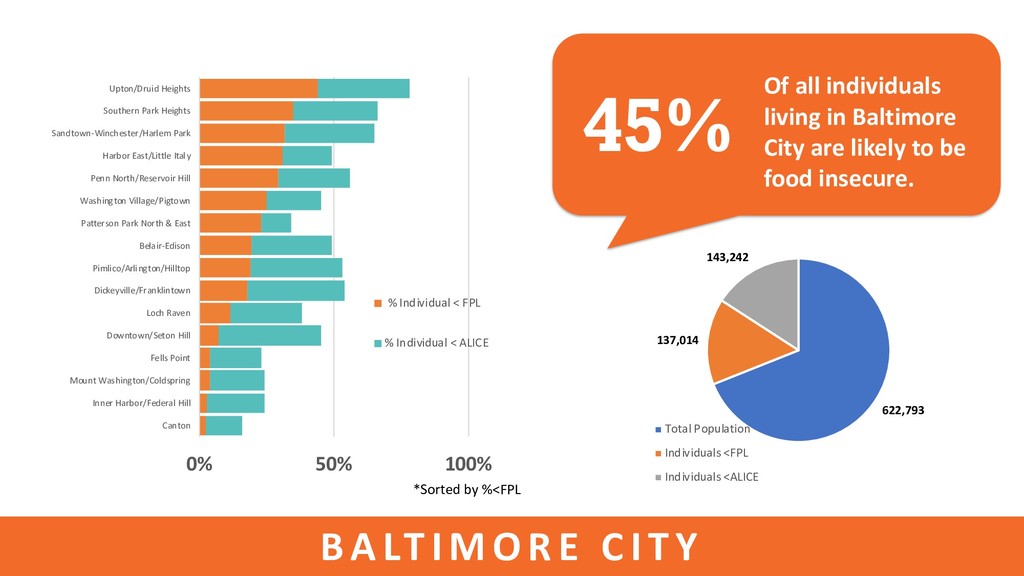
be food insecure. 45% 622,793 137,014 143,242 Total Population Individuals <FPL Individuals <ALICE *Sorted by %<FPL 0% 50% 100% Canton Inner Harbor/Federal Hill Mount Washington/Coldspring Fells Point Downtown/Seton Hill Loch Raven Dickeyville/Franklintown Pimlico/Arlington/Hilltop Belair-Edison Patterson Park North & East Washington Village/Pigtown Penn North/Reservoir Hill Harbor East/Little Italy Sandtown-Winchester/Harlem Park Southern Park Heights Upton/Druid Heights % Individual < FPL % Individual < ALICE BA LTIM ORE CITY
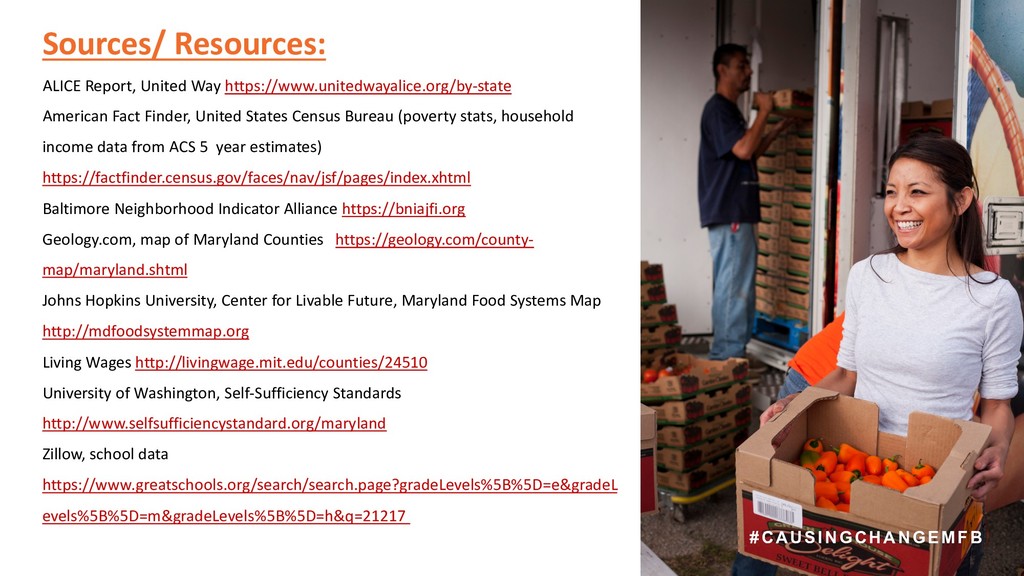
States Census Bureau (poverty stats, household income data from ACS 5 year estimates) https://factfinder.census.gov/faces/nav/jsf/pages/index.xhtml Baltimore Neighborhood Indicator Alliance https://bniajfi.org Geology.com, map of Maryland Counties https://geology.com/county- map/maryland.shtml Johns Hopkins University, Center for Livable Future, Maryland Food Systems Map http://mdfoodsystemmap.org Living Wages http://livingwage.mit.edu/counties/24510 University of Washington, Self-Sufficiency Standards http://www.selfsufficiencystandard.org/maryland Zillow, school data https://www.greatschools.org/search/search.page?gradeLevels%5B%5D=e&gradeL evels%5B%5D=m&gradeLevels%5B%5D=h&q=21217 Sources/ Resources:
![Angie McAllister Vice President & Senior Program Officer [email protected]](https://files.speakerdeck.com/presentations/e921f524546348f592fe24262c7a16fa/slide_12.jpg)
![[email protected] • 410-257-5672 • endhungercalvert.org Robin Brungard [email protected] 410-286-3401](https://files.speakerdeck.com/presentations/e921f524546348f592fe24262c7a16fa/slide_28.jpg)