Upgrade to Pro — share decks privately, control downloads, hide ads and more …

Forecasting - Getting started with the Prophet package

Forecasting - Getting started with the Prophet package

The slides are from the workshop presented at the PyLadies Hamburg meetup on Tuesday, April 27 2021.

The code is available on the repository: https://github.com/meiradania/forecast-with-prophet-intro

Dânia Meira

April 23, 2021
Tweet

More Decks by Dânia Meira

Other Decks in Programming

Transcript

  1. PyLadies Hamburg 27 April 2021 Forecasting Getting started with the

    Prophe package Dânia Meira and Lidia Yalew
  2. Dânia Meira Founding member & head of #datalift, AI Guild

    ML models for predictive analytics Former bootcamp teacher #datacareer since 2012 LinkedIn
  3. Lidia Yalew Junior Data Scientist at myToys (Berlin) Graduated in

    Business Information Systems Concentrated on Time Series Prediction with a great focus on Prophet in her thesis LinkedIn
  4. Agenda • Intro to time series data • Prophet overview

    • Example ◦ Daily sales data • Setup • Further resources
  5. Time series... what? Series of data points recorded at different

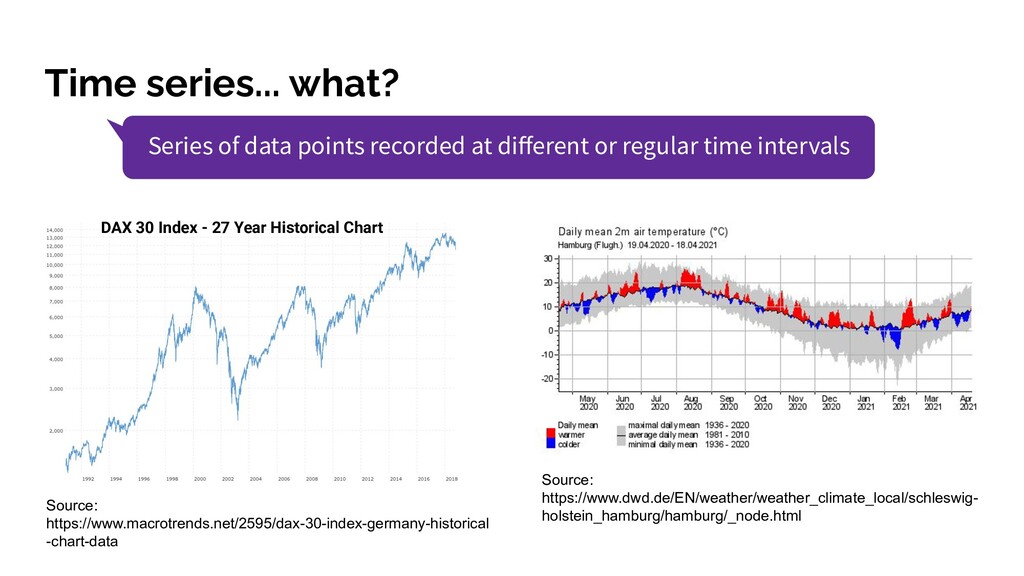
    or regular time intervals DAX 30 Index - 27 Year Historical Chart Source: https://www.dwd.de/EN/weather/weather_climate_local/schleswig- holstein_hamburg/hamburg/_node.html Source: https://www.macrotrends.net/2595/dax-30-index-germany-historical -chart-data
  6. Seasonal pattern or seasonality: over a fixed and known period

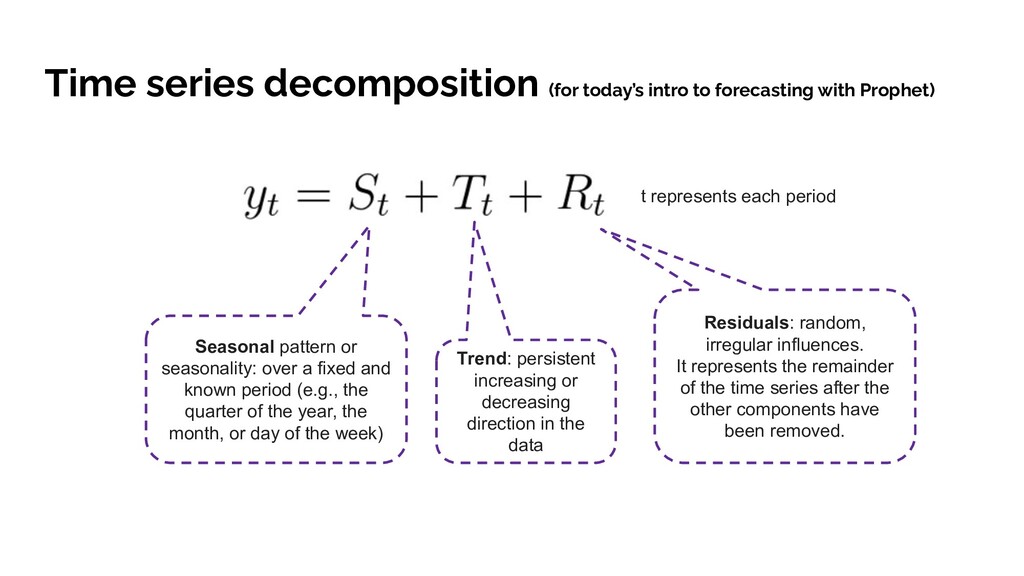
    (e.g., the quarter of the year, the month, or day of the week) Time series decomposition (for today’s intro to forecasting with Prophet) Trend: persistent increasing or decreasing direction in the data Residuals: random, irregular influences. It represents the remainder of the time series after the other components have been removed. t represents each period
  7. The input to Prophet is always a pandas dataframe: Prophet

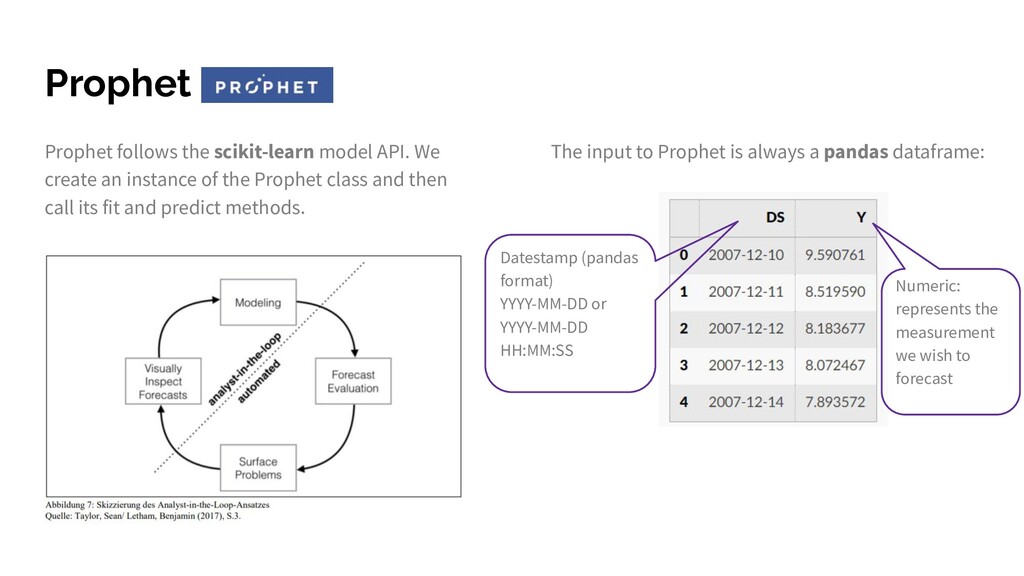
    Prophet follows the scikit-learn model API. We create an instance of the Prophet class and then call its fit and predict methods. Datestamp (pandas format) YYYY-MM-DD or YYYY-MM-DD HH:MM:SS Numeric: represents the measurement we wish to forecast
  8. Forecasting Base model using default: • Trend = linear •

    Yearly with Fourier series =10 • Weekly with Fourier series =3 • Increasing the number of Fourier terms allows the seasonality to fit faster changing cycles, but can also lead to overfitting • Seasonality_prior_scale can be adjusted to smooth the overfitting of the seasonality model
  9. Example Store Item Demand Forecasting Challenge Train.csv = daily for

    2013 to 2017 // 50 items per store, 10 stores Test.csv = 3 months into 2018 All items in all stores ➢ “Modified dataset”: We Focus on 1 store and 1 item and train from 2013 to September 2017 and test on October to December 2017.
  10. Setup 1. Install git, anaconda and gcc 2. Clone the

    repository with the complete tutorial $ git clone https://github.com/meiradania/forecast-with-prophet-intro 3. Create the conda environment in your workspace $ cd forecast-with-prophet-intro $ conda create --name prophet-intro --file spec-file.txt While the installation happens on the background…
  11. Further resources Links • https://sthalles.github.io/a-visual-guide-to-time-series-decomposition/ • https://www.kaggle.com/c/demand-forecasting-kernels-only/overview • https://conda.io/projects/conda/en/latest/user-guide/tasks/manage-environments .html#activating-an-environment

    • http://facebook.github.io/prophet/docs/quick_start.html • https://facebook.github.io/prophet/docs/seasonality,_holiday_effects,_and_regres sors.html#fourier-order-for-seasonalities