Upgrade to Pro
— share decks privately, control downloads, hide ads and more …
Speaker Deck
Features
Speaker Deck
PRO
Sign in
Sign up for free
Search
Search
Visual Load Testing
Search
Sponsored
·
Your Podcast. Everywhere. Effortlessly.
Share. Educate. Inspire. Entertain. You do you. We'll handle the rest.
→
Marc Huffnagle
April 08, 2013
Programming
0
150
Visual Load Testing
A talk I gave to Data Science Maryland on using visualization in load testing.
Marc Huffnagle
April 08, 2013
Tweet
Share
Other Decks in Programming
See All in Programming
15年続くIoTサービスの SREエンジニアが挑む 分散トレーシング導入
melonps
2
190
登壇資料を作る時に意識していること #登壇資料_findy
konifar
4
1k
今から始めるClaude Code超入門
448jp
8
8.6k
インターン生でもAuth0で 認証基盤刷新が出来るのか
taku271
0
190
Apache Iceberg V3 and migration to V3
tomtanaka
0
160
コマンドとリード間の連携に対する脅威分析フレームワーク
pandayumi
1
450
humanlayerのブログから学ぶ、良いCLAUDE.mdの書き方
tsukamoto1783
0
190
Data-Centric Kaggle
isax1015
2
770
開発者から情シスまで - 多様なユーザー層に届けるAPI提供戦略 / Postman API Night Okinawa 2026 Winter
tasshi
0
200
Fragmented Architectures
denyspoltorak
0
150
Oxlint JS plugins
kazupon
1
860
AIフル活用時代だからこそ学んでおきたい働き方の心得
shinoyu
0
130
Featured
See All Featured
Noah Learner - AI + Me: how we built a GSC Bulk Export data pipeline
techseoconnect
PRO
0
100
Building an army of robots
kneath
306
46k
Why Your Marketing Sucks and What You Can Do About It - Sophie Logan
marketingsoph
0
72
How to train your dragon (web standard)
notwaldorf
97
6.5k
Primal Persuasion: How to Engage the Brain for Learning That Lasts
tmiket
0
250
Leveraging Curiosity to Care for An Aging Population
cassininazir
1
160
Site-Speed That Sticks
csswizardry
13
1.1k
DevOps and Value Stream Thinking: Enabling flow, efficiency and business value
helenjbeal
1
92
Designing Experiences People Love
moore
144
24k
What does AI have to do with Human Rights?
axbom
PRO
0
2k
How to build an LLM SEO readiness audit: a practical framework
nmsamuel
1
640
Hiding What from Whom? A Critical Review of the History of Programming languages for Music
tomoyanonymous
2
410
Transcript
Copyright 2013 Visual Load Testing Marc Huffnagle
[email protected]
Tuesday, April
9, 13
My background Tuesday, April 9, 13
My background ✤ Developer Tuesday, April 9, 13
My background ✤ Developer ✤ Sysadmin Tuesday, April 9, 13
My background ✤ Developer ✤ Sysadmin ✤ Tester Tuesday, April
9, 13
My background ✤ Developer ✤ Sysadmin ✤ Tester ✤ Developer
Tuesday, April 9, 13
My background ✤ Developer ✤ Sysadmin ✤ Tester ✤ Developer
✤ Tester Tuesday, April 9, 13
My background ✤ Developer ✤ Sysadmin ✤ Tester ✤ Developer
✤ Tester ✤ Sysadmin Tuesday, April 9, 13
My background ✤ Developer ✤ Sysadmin ✤ Tester ✤ Developer
✤ Tester ✤ Sysadmin ✤ Developer ... Tuesday, April 9, 13
Goals Tuesday, April 9, 13
Goals ✤ Show how we use visualization when load testing
ECHO Tuesday, April 9, 13
Goals ✤ Show how we use visualization when load testing
ECHO ✤ Demonstrate how you can use some of the same techniques Tuesday, April 9, 13
Goals ✤ Show how we use visualization when load testing
ECHO ✤ Demonstrate how you can use some of the same techniques ✤ Convince you that visualization can be easy Tuesday, April 9, 13
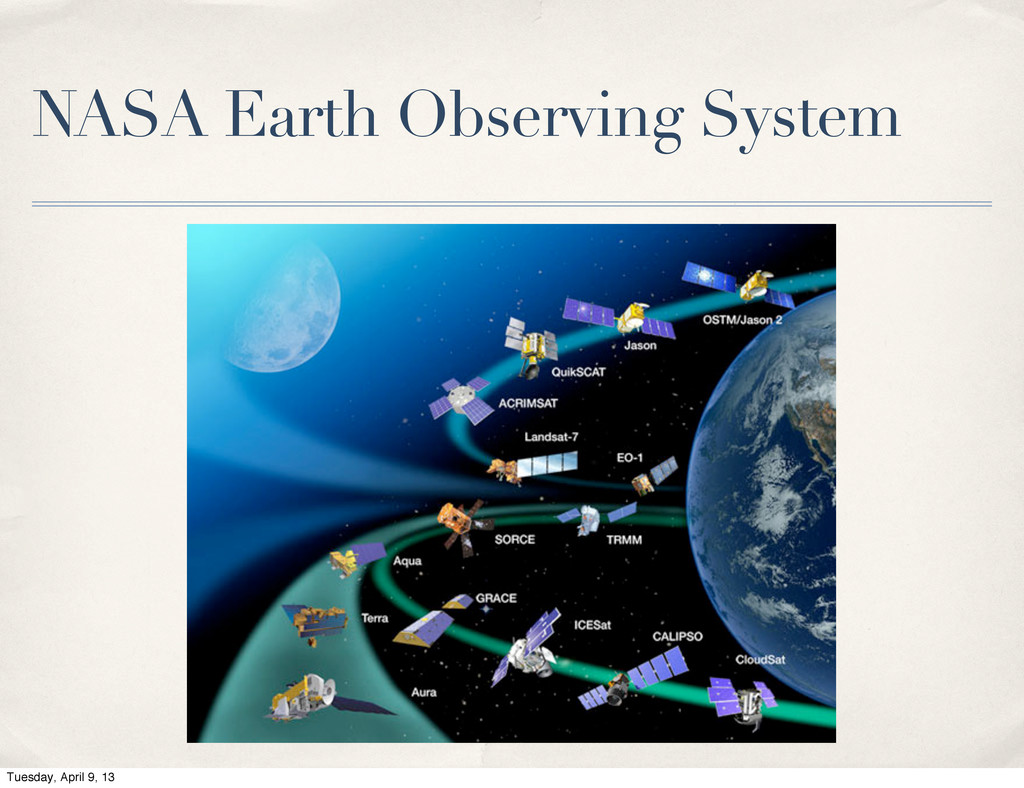
What is ECHO? Earth Observing System Clearing HOuse Tuesday, April
9, 13
NASA Earth Observing System Tuesday, April 9, 13
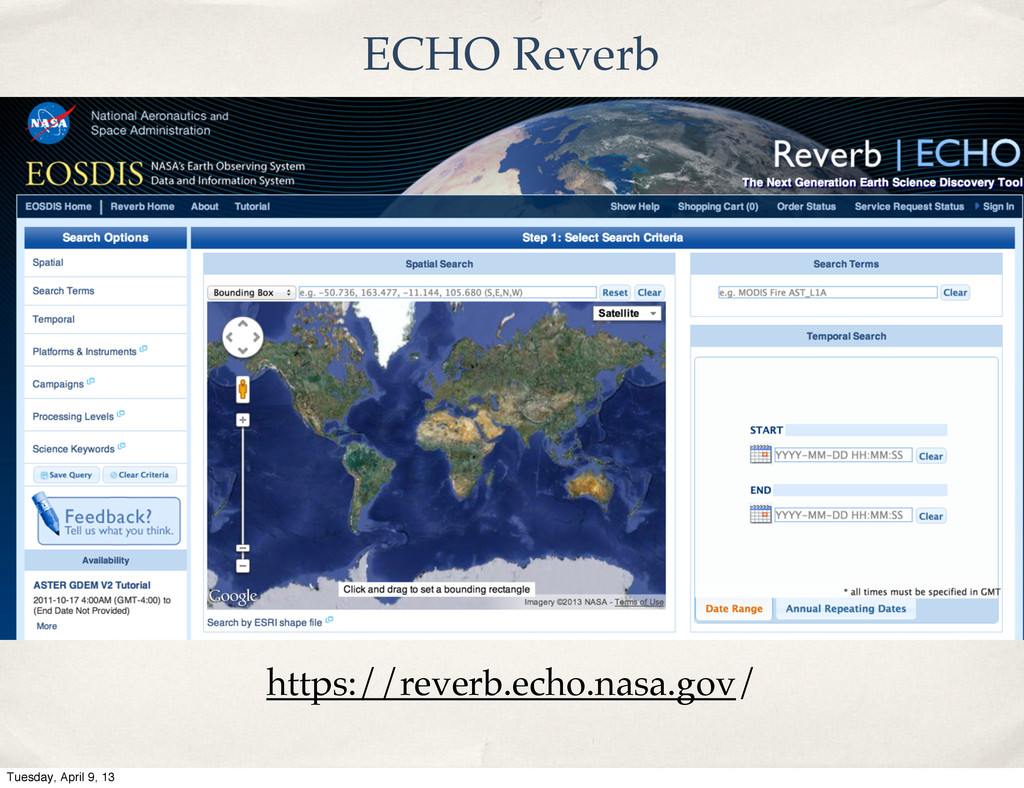
https://reverb.echo.nasa.gov/ ECHO Reverb Tuesday, April 9, 13
Our load testing goals Tuesday, April 9, 13
Our load testing goals http://ircimg.net/skeleton-computer-guy.jpg Tuesday, April 9, 13
Our load testing goals http://www.recareered.com/files/2011/03/Turtle-Creative-Commons.jpg Tuesday, April 9, 13
Our load testing goals http://tinyurl.com/cnb5quc Tuesday, April 9, 13
Our load testing goals http://bees.chrisinch.com/wp-content/uploads/2012/04/MoneyBag.jpg Tuesday, April 9, 13
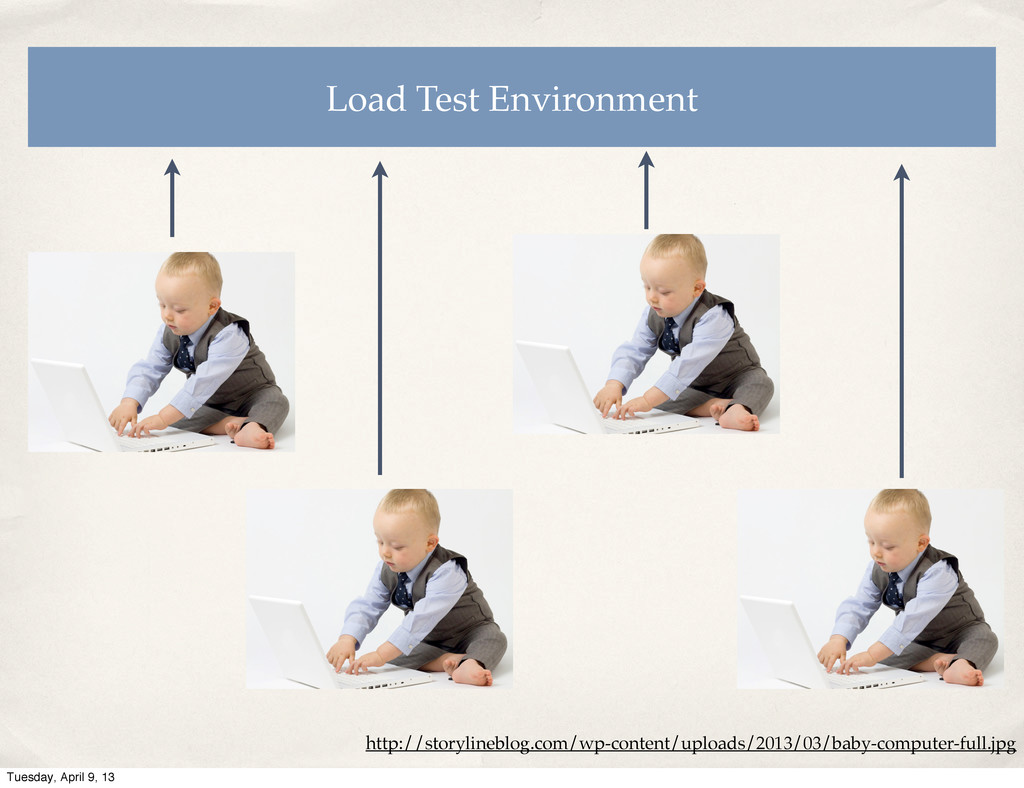
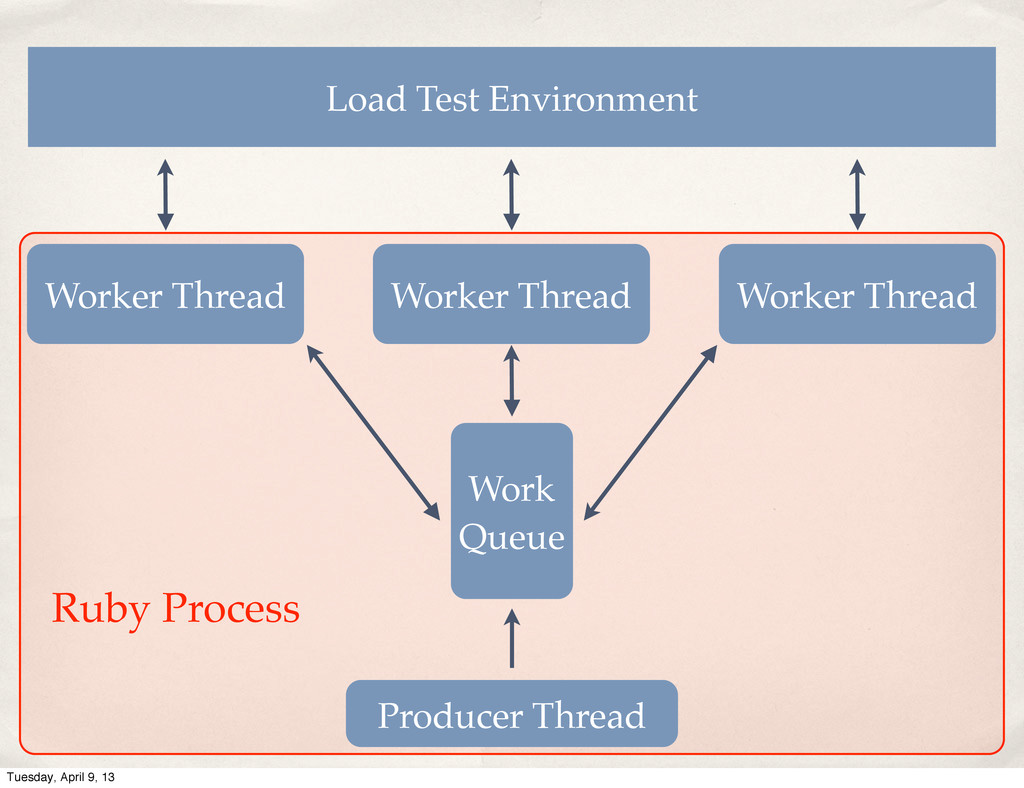
Load Test Environment http://storylineblog.com/wp-content/uploads/2013/03/baby-computer-full.jpg Tuesday, April 9, 13
Load Test Environment Producer Thread Work Queue Worker Thread Worker
Thread Worker Thread Ruby Process Tuesday, April 9, 13
Sidekiq http://sidekiq.org Simple, efficient message processing for Ruby. Tuesday, April
9, 13
Tuesday, April 9, 13
Tuesday, April 9, 13
Tuesday, April 9, 13
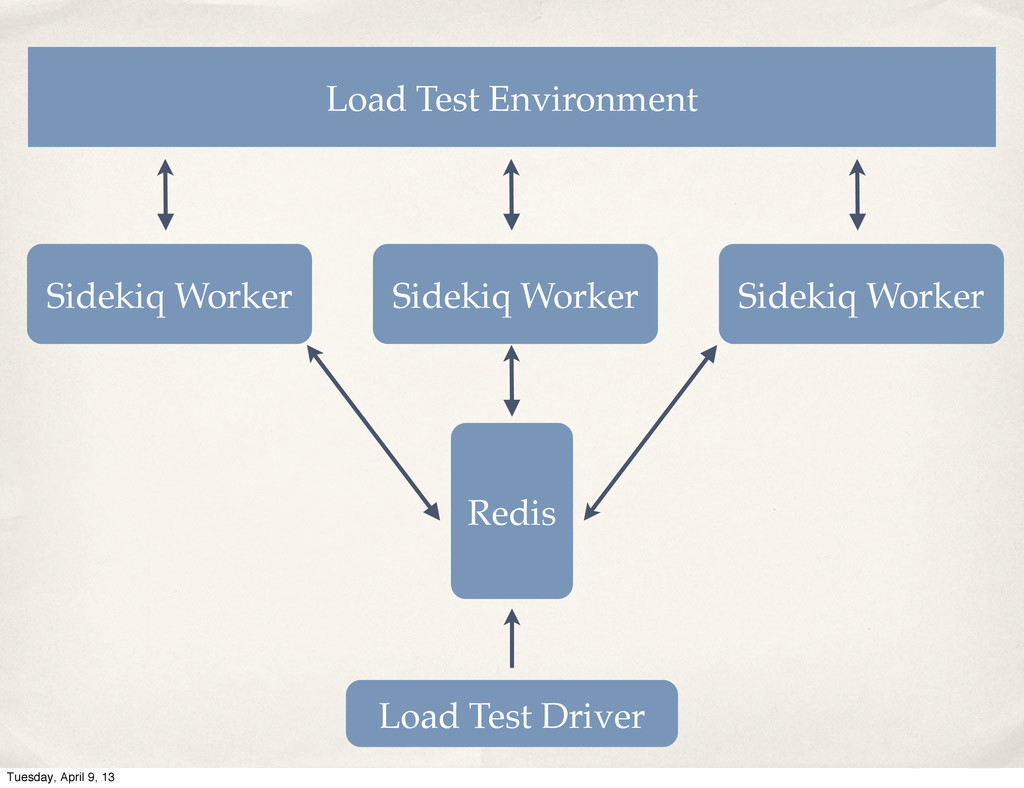
Load Test Environment Load Test Driver Redis Sidekiq Worker Sidekiq
Worker Sidekiq Worker Tuesday, April 9, 13
http://farm5.static.flickr.com/4023/4548711373_d70fd58836_o.jpg Tuesday, April 9, 13
We’ll be using visualization for two things: Tuesday, April 9,
13
We’ll be using visualization for two things: Monitoring Tuesday, April
9, 13
We’ll be using visualization for two things: Monitoring Metrics Tuesday,
April 9, 13
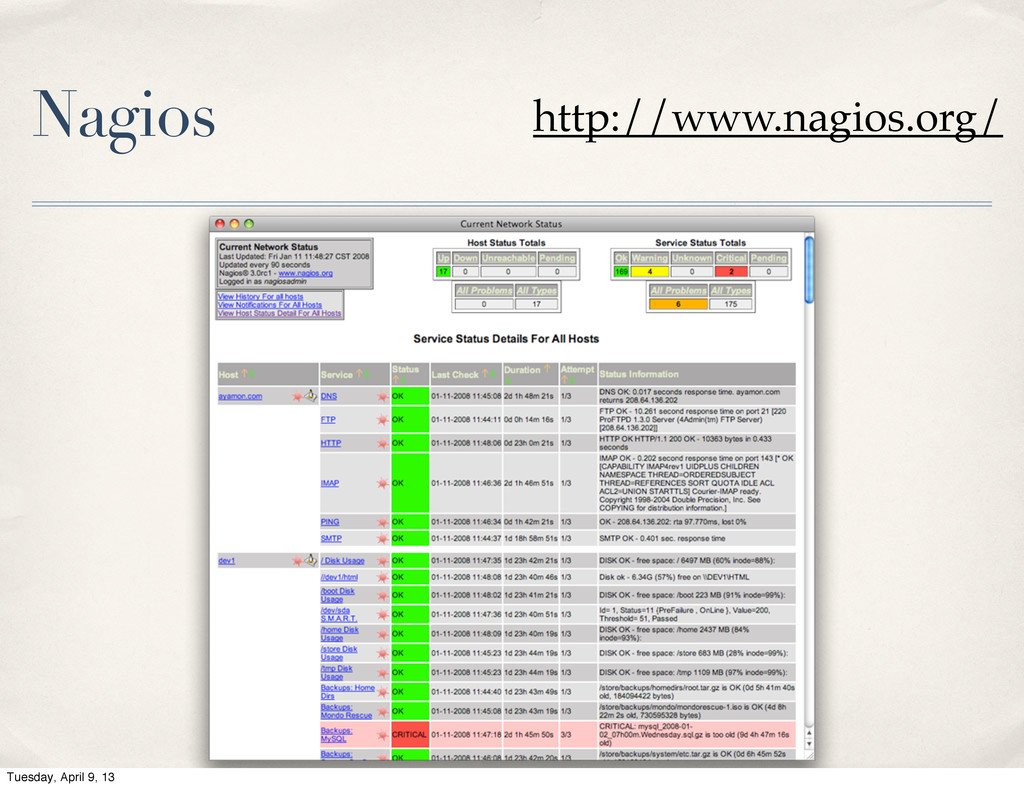
Nagios http://www.nagios.org/ Tuesday, April 9, 13
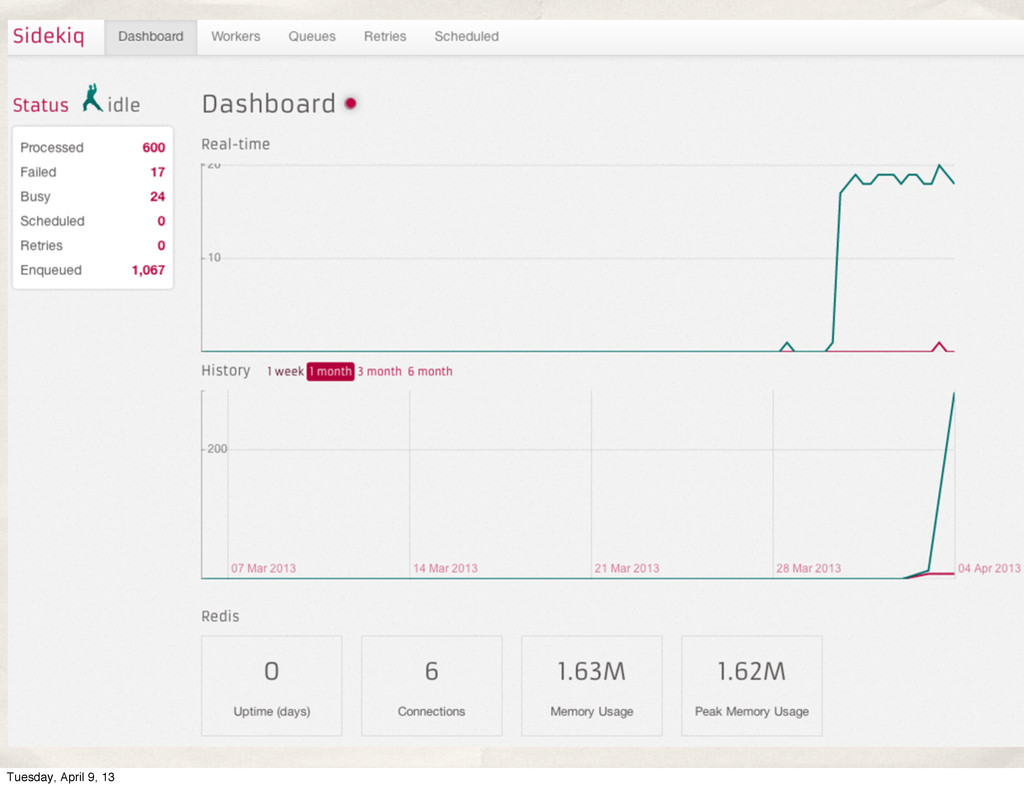
Tuesday, April 9, 13
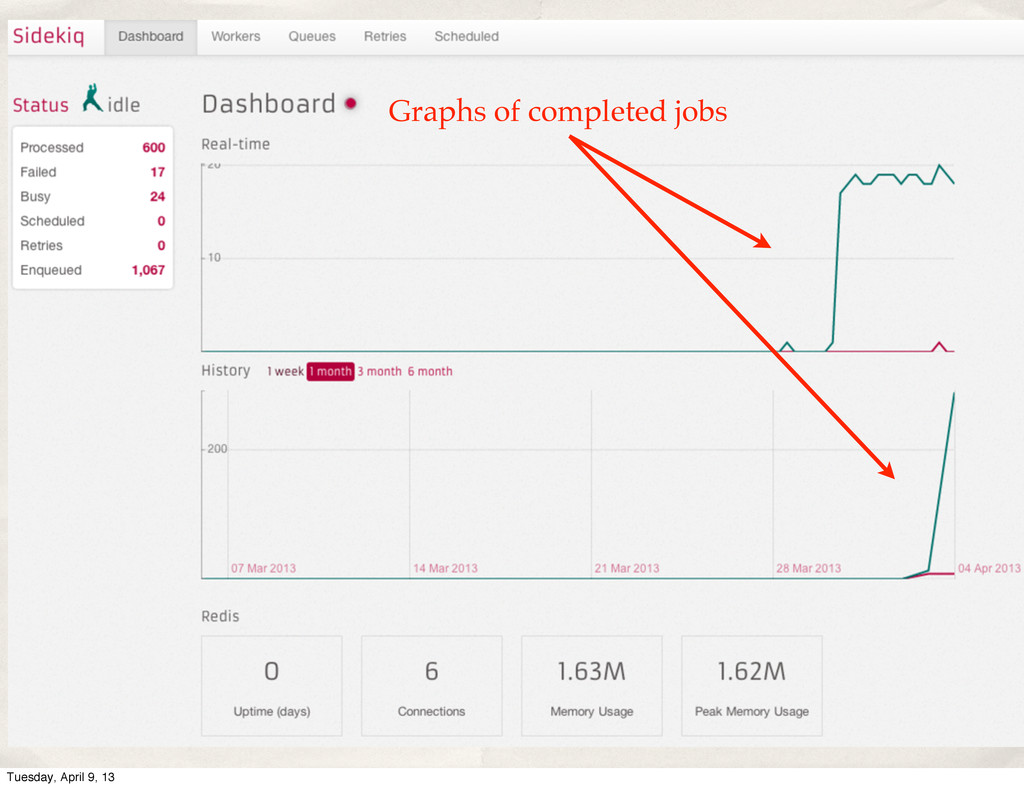
Graphs of completed jobs Tuesday, April 9, 13
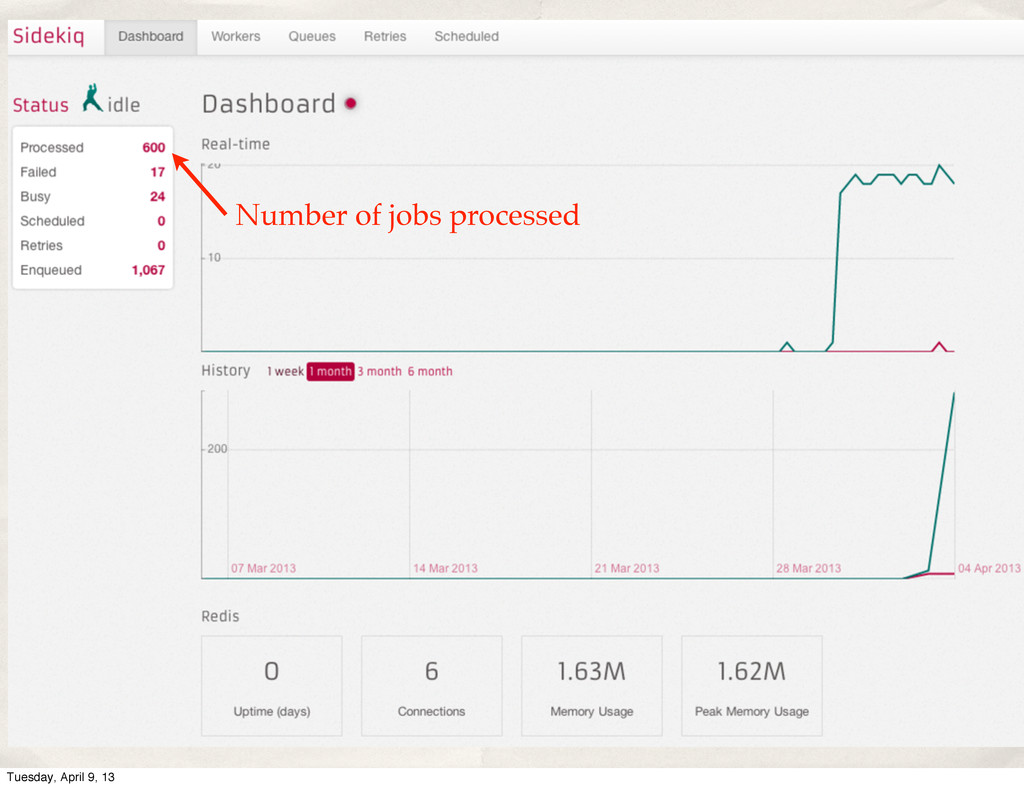
Number of jobs processed Tuesday, April 9, 13
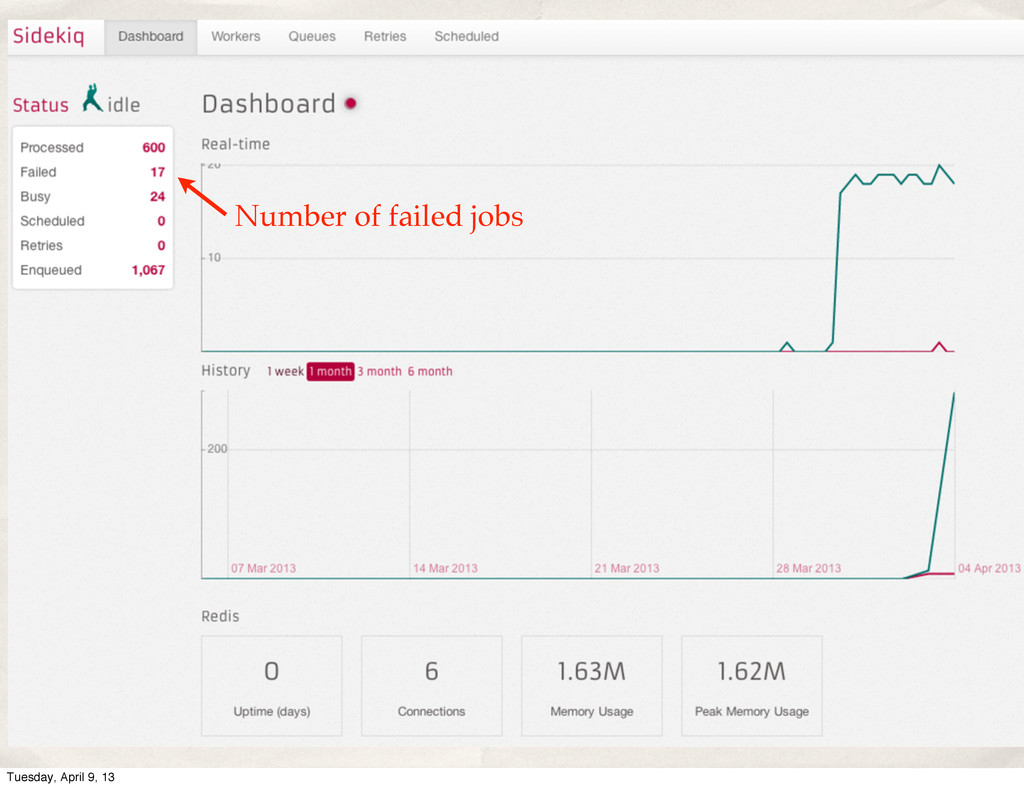
Number of failed jobs Tuesday, April 9, 13
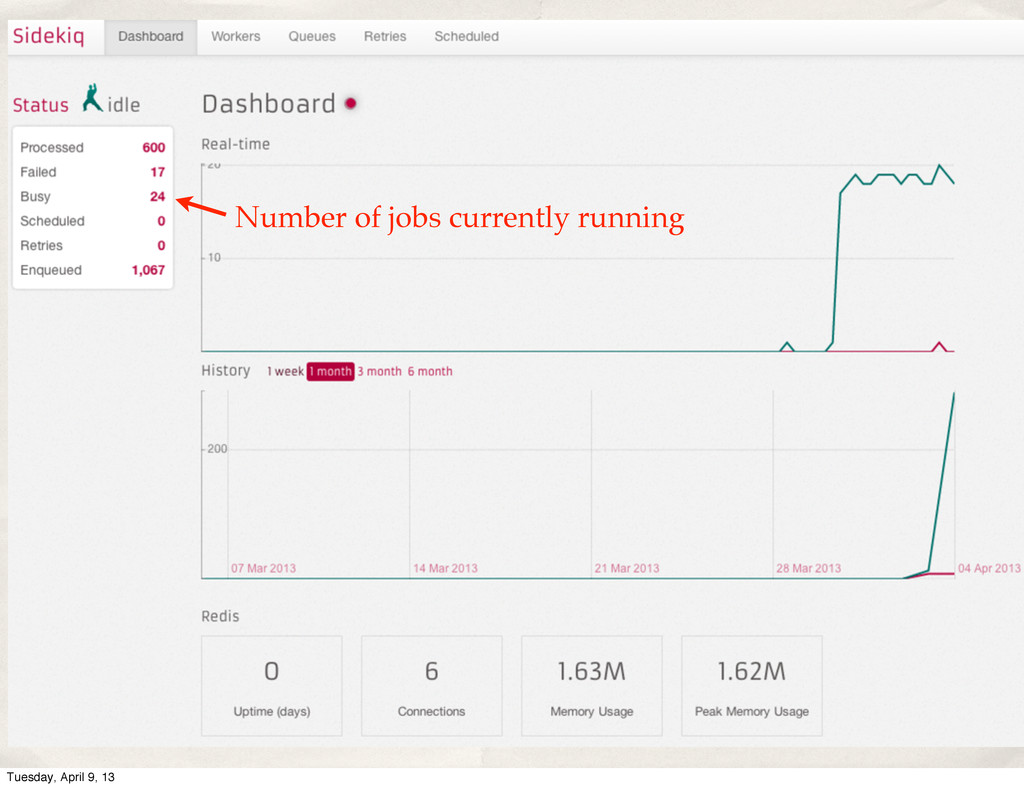
Number of jobs currently running Tuesday, April 9, 13
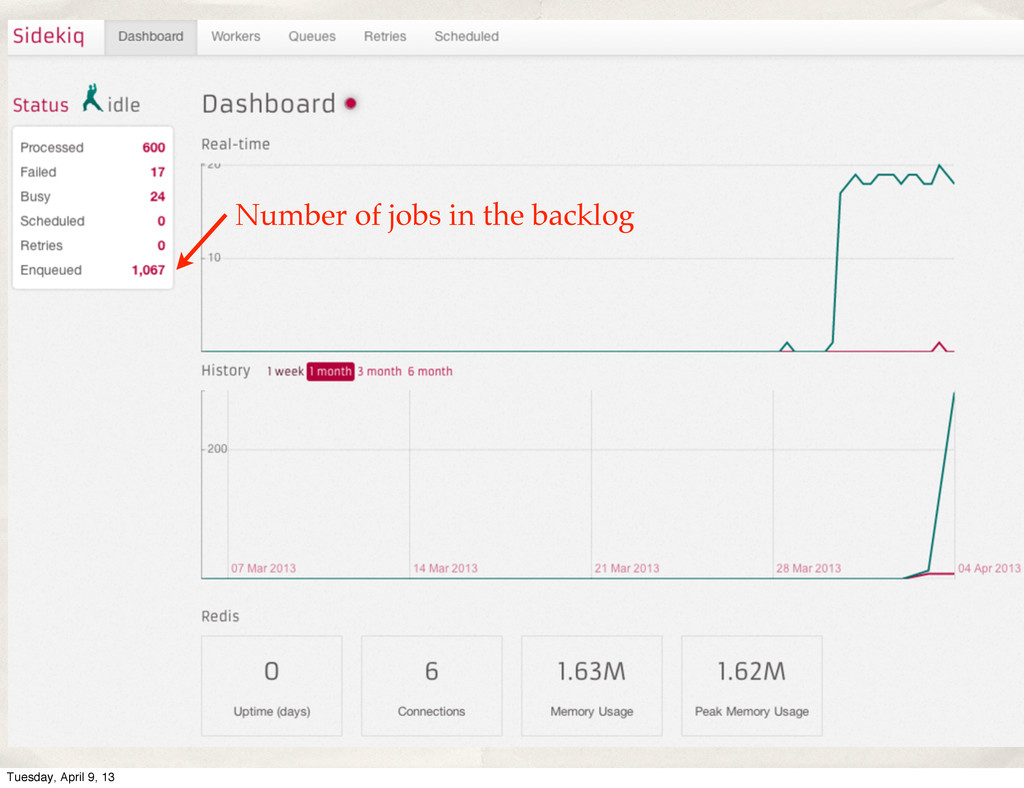
Number of jobs in the backlog Tuesday, April 9, 13
http://4.bp.blogspot.com/_K4gm2yzgfeo/TJRYOHMNR2I/AAAAAAAAAKM/is6CjOkIIvk/s1600/flight-recorder.jpg Tuesday, April 9, 13
Types of metrics we collect Tuesday, April 9, 13
Types of metrics we collect ✤ Numeric time-series data Tuesday,
April 9, 13
Types of metrics we collect ✤ Numeric time-series data ✤
Event-based data Tuesday, April 9, 13
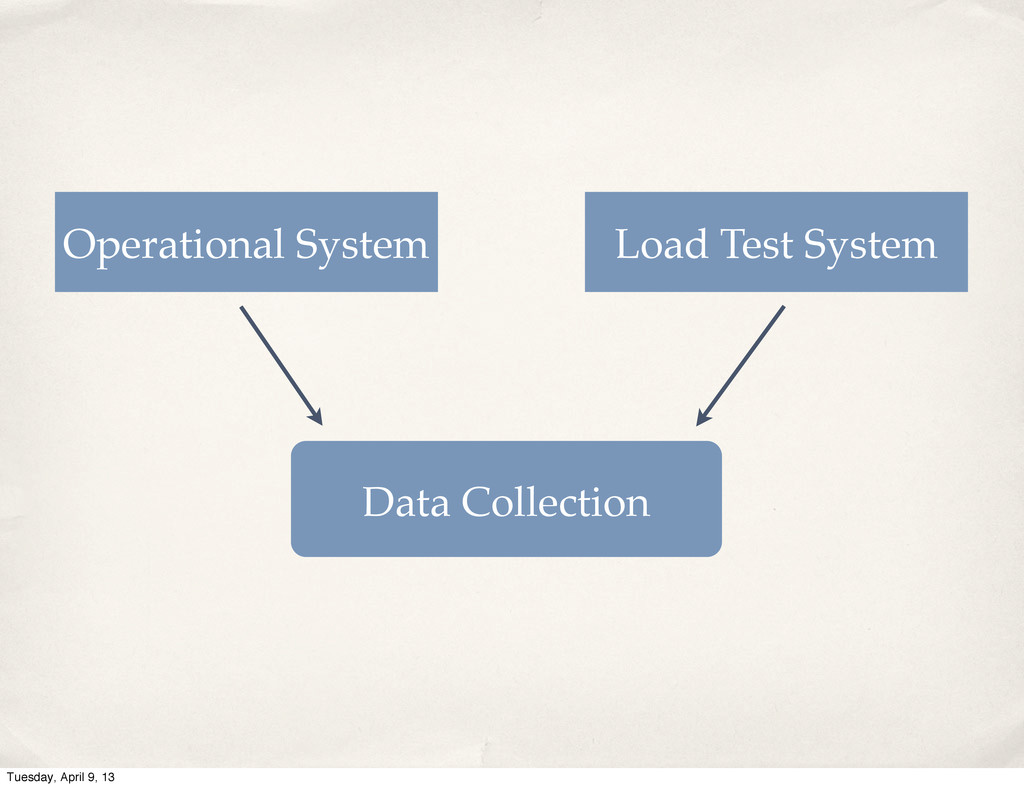
Operational System Load Test System Data Collection Tuesday, April 9,
13
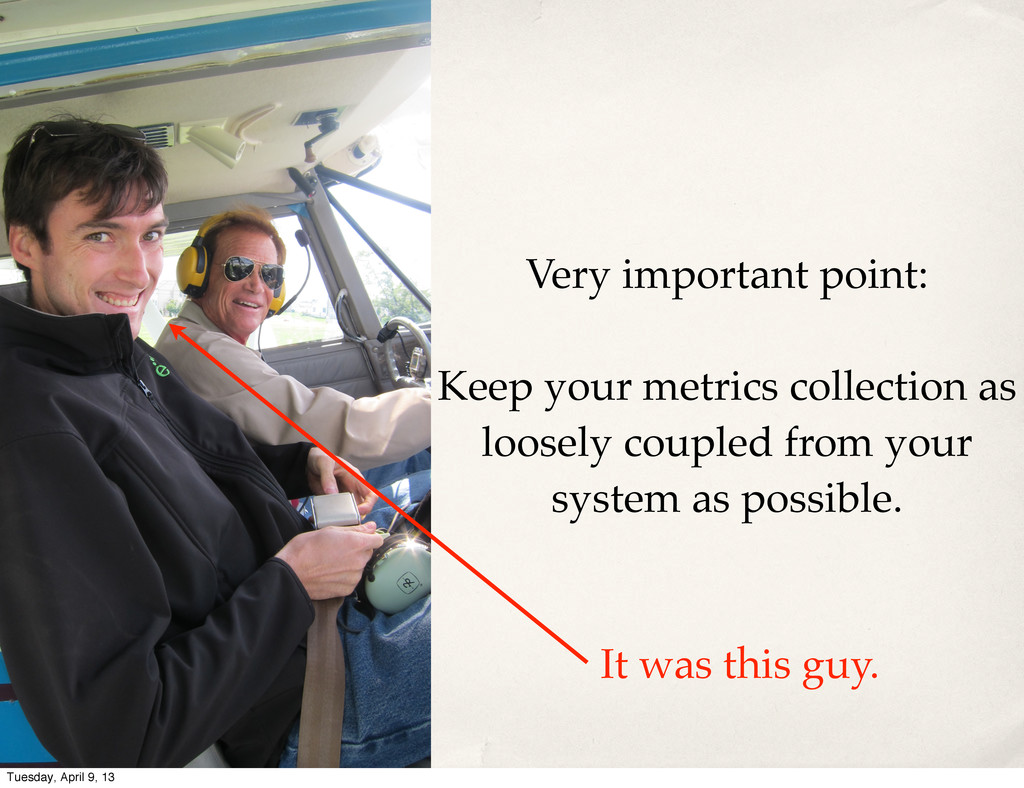
Very important point: Keep your metrics collection as loosely coupled
from your system as possible. Tuesday, April 9, 13
It was this guy. Very important point: Keep your metrics
collection as loosely coupled from your system as possible. Tuesday, April 9, 13
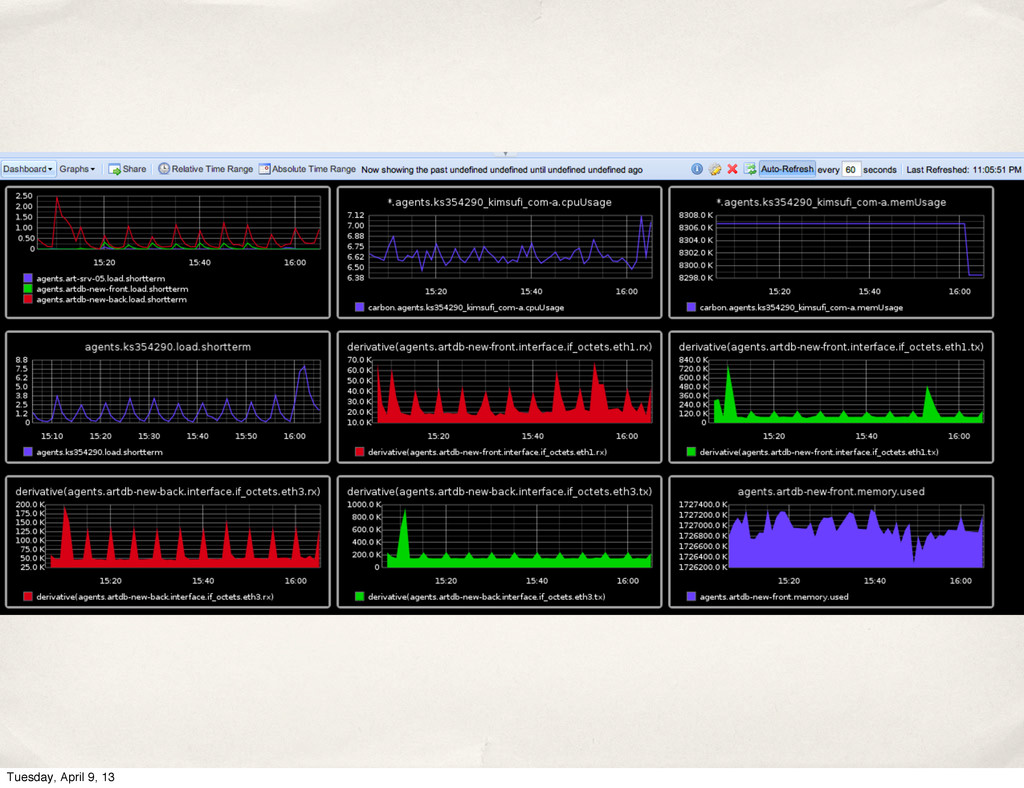
Graphite http://graphite.wikidot.com Tuesday, April 9, 13
What should I store in Graphite? Tuesday, April 9, 13
What should I store in Graphite? Tuesday, April 9, 13
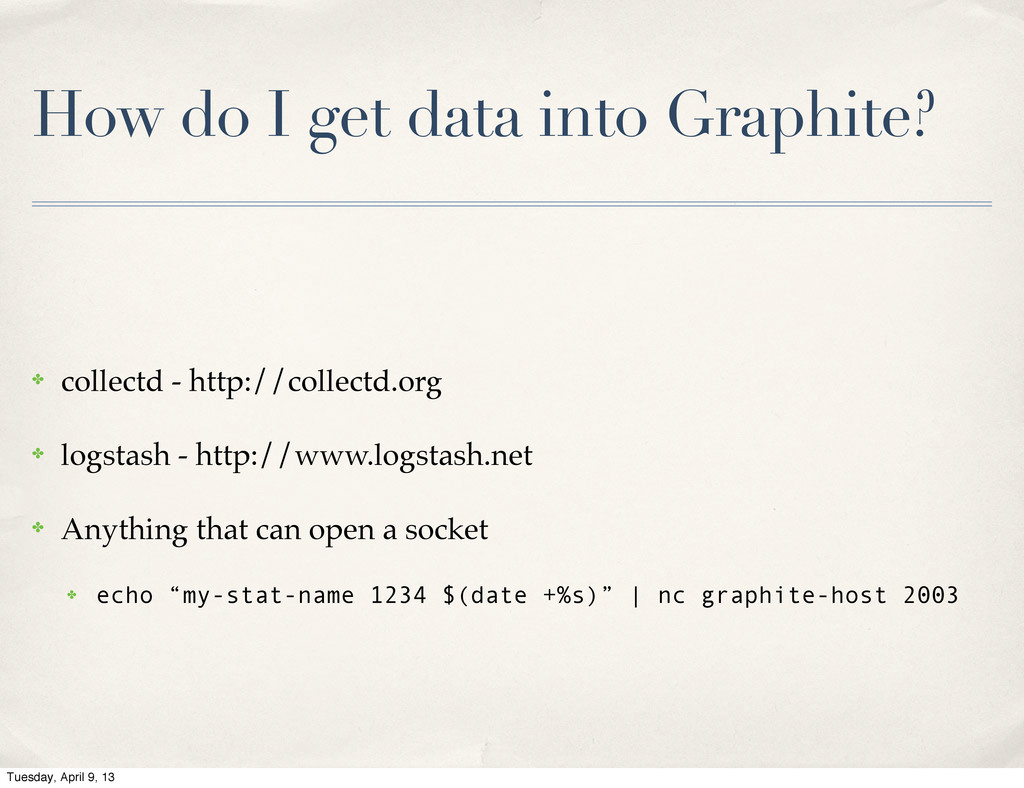
How do I get data into Graphite? ✤ collectd -
http://collectd.org ✤ logstash - http://www.logstash.net ✤ Anything that can open a socket ✤ echo “my-stat-name 1234 $(date +%s)” | nc graphite-host 2003 Tuesday, April 9, 13
Tuesday, April 9, 13
Tuesday, April 9, 13
Tuesday, April 9, 13
What about those event-based metrics? Tuesday, April 9, 13
http://farm3.static.flickr.com/2799/4481372869_e5ccb9af5d_o.jpg Tuesday, April 9, 13
http://upload.wikimedia.org/wikipedia/commons/c/c7/Logs.jpg Tuesday, April 9, 13
http://upload.wikimedia.org/wikipedia/commons/f/fb/A_few_logs_-_geograph.org.uk_-_57580.jpg Tuesday, April 9, 13
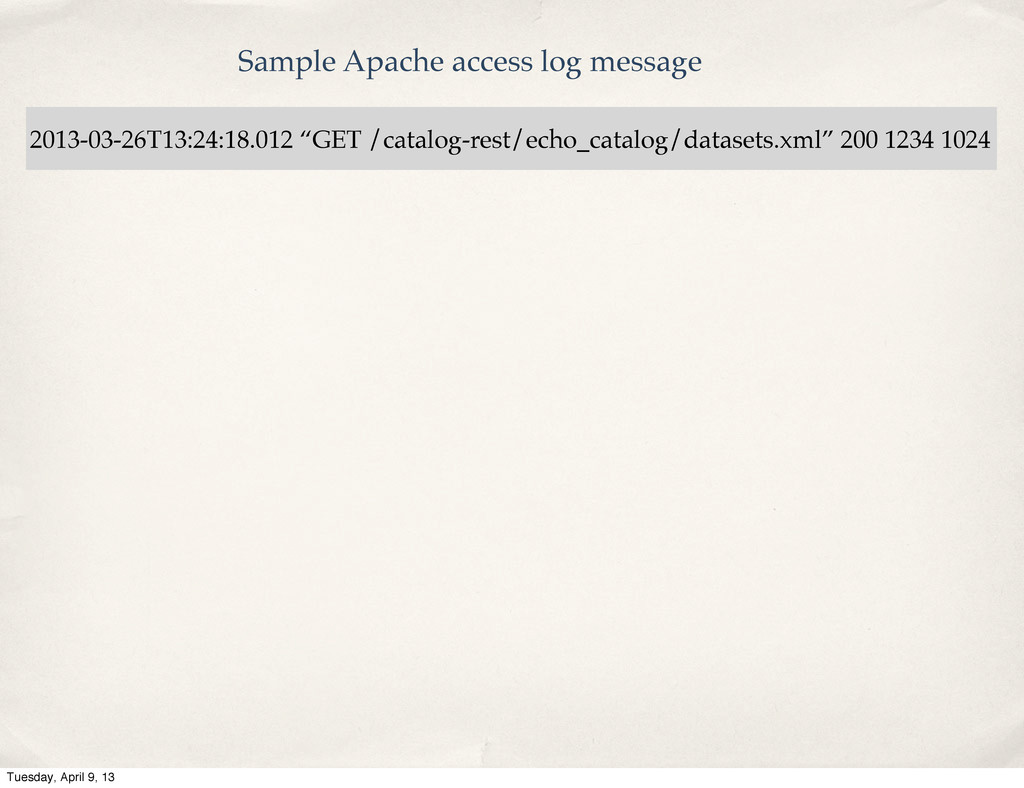
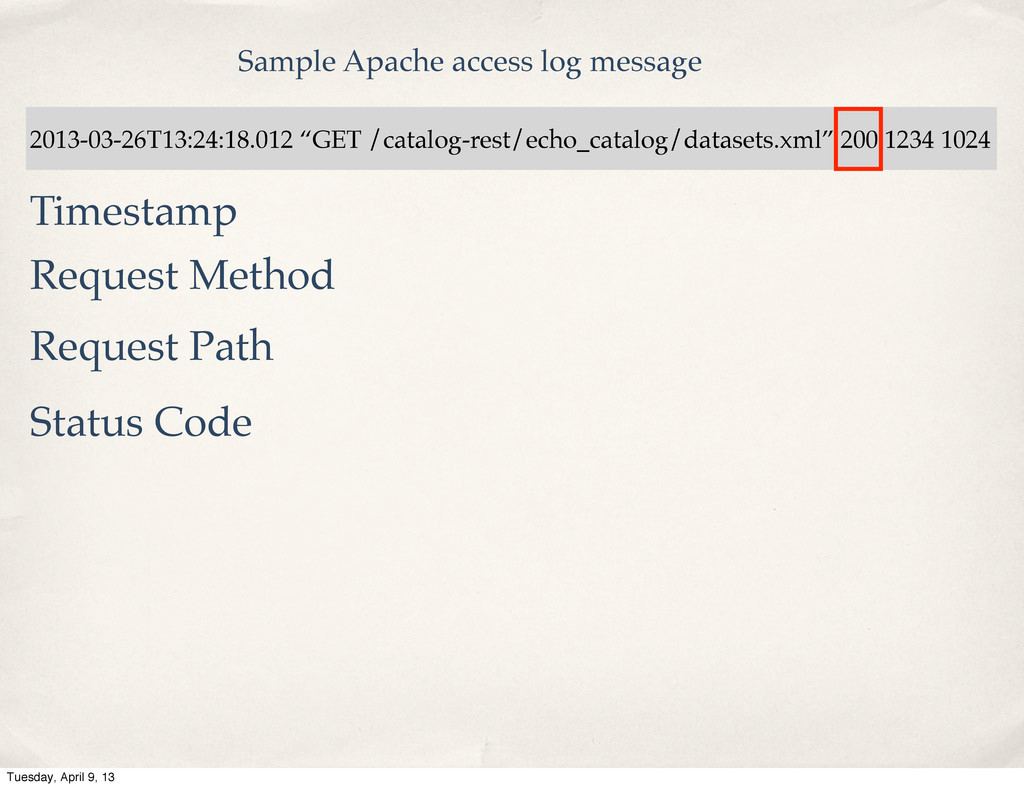
2013-03-26T13:24:18.012 “GET /catalog-rest/echo_catalog/datasets.xml” 200 1234 1024 Sample Apache access log
message Tuesday, April 9, 13
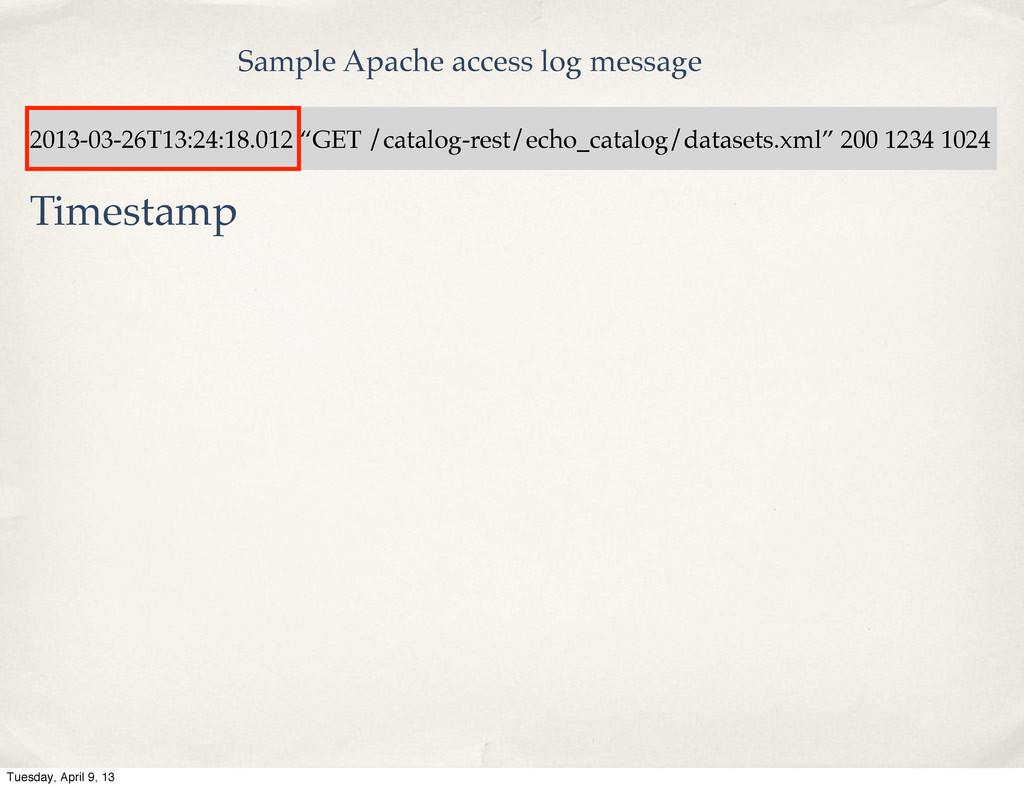
2013-03-26T13:24:18.012 “GET /catalog-rest/echo_catalog/datasets.xml” 200 1234 1024 Sample Apache access log
message Timestamp Tuesday, April 9, 13
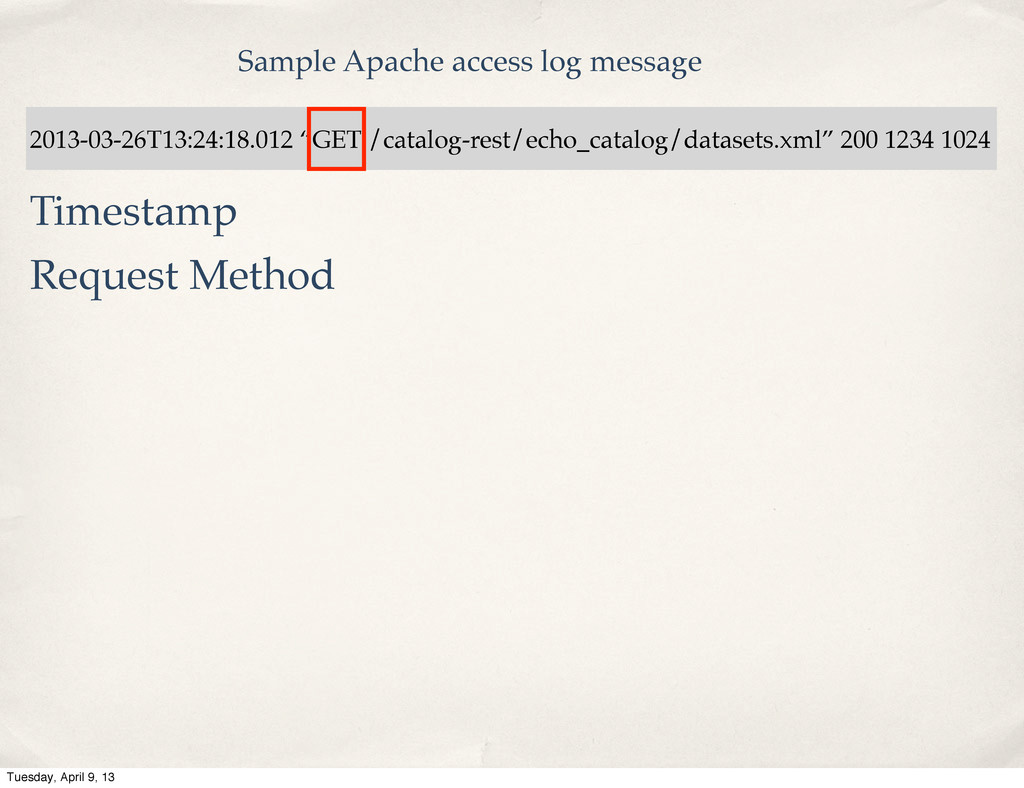
2013-03-26T13:24:18.012 “GET /catalog-rest/echo_catalog/datasets.xml” 200 1234 1024 Sample Apache access log
message Timestamp Request Method Tuesday, April 9, 13
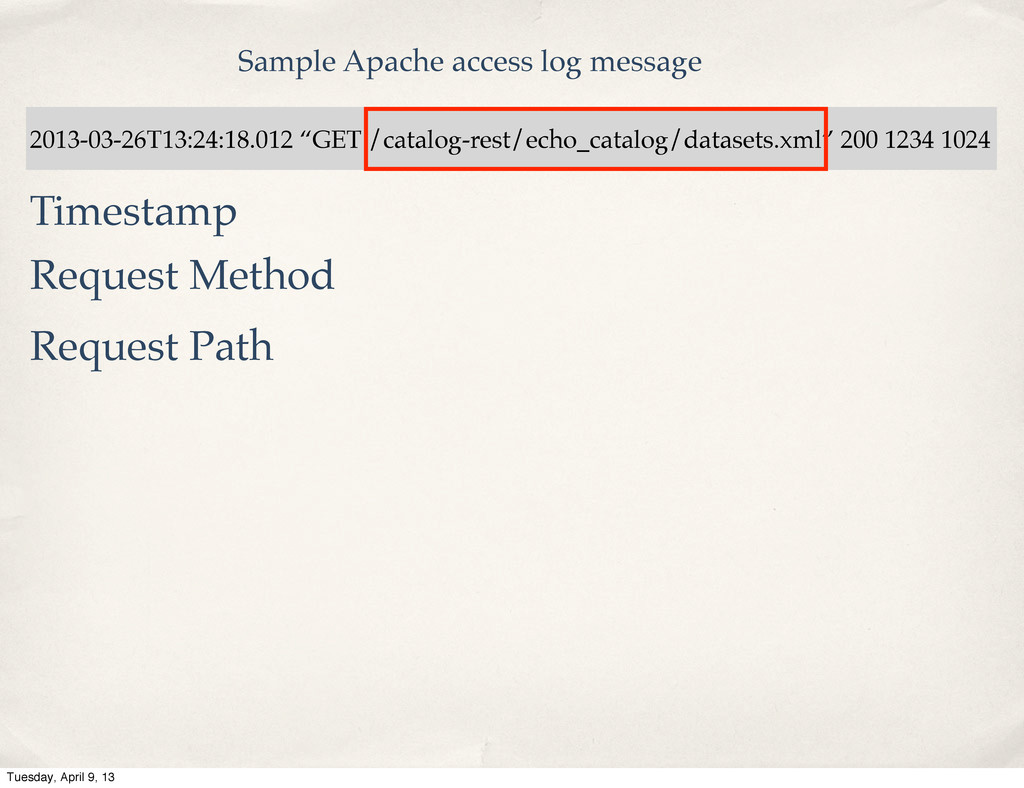
2013-03-26T13:24:18.012 “GET /catalog-rest/echo_catalog/datasets.xml” 200 1234 1024 Sample Apache access log
message Timestamp Request Method Request Path Tuesday, April 9, 13
2013-03-26T13:24:18.012 “GET /catalog-rest/echo_catalog/datasets.xml” 200 1234 1024 Sample Apache access log
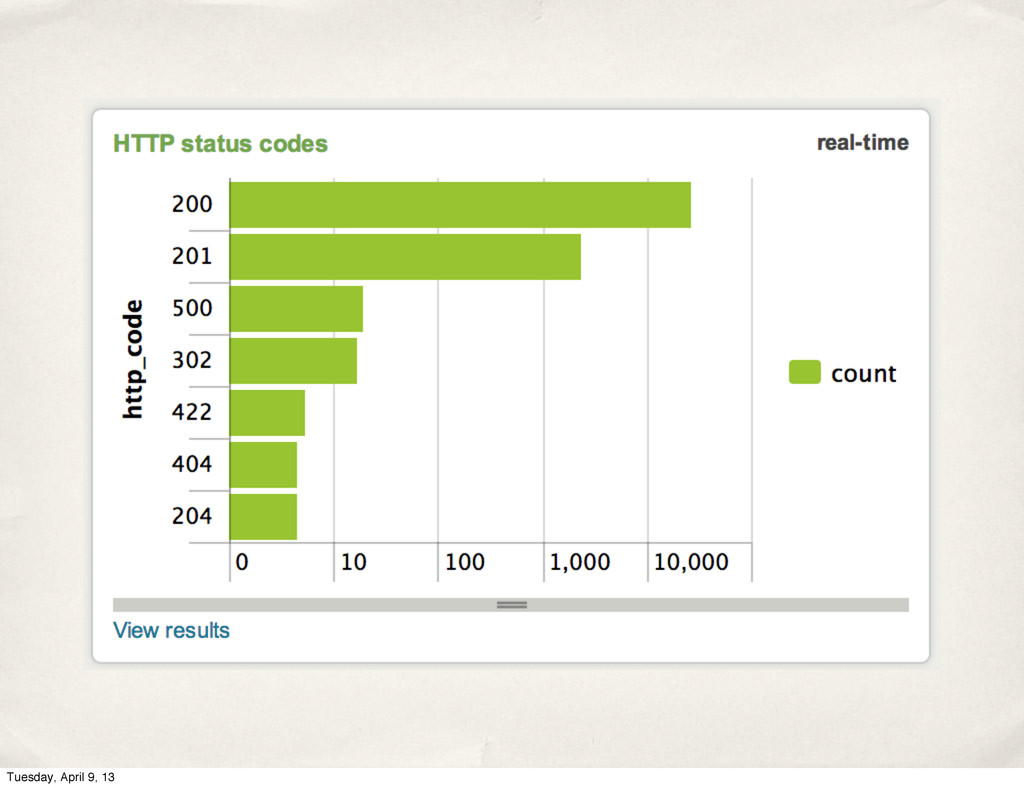
message Timestamp Request Method Request Path Status Code Tuesday, April 9, 13
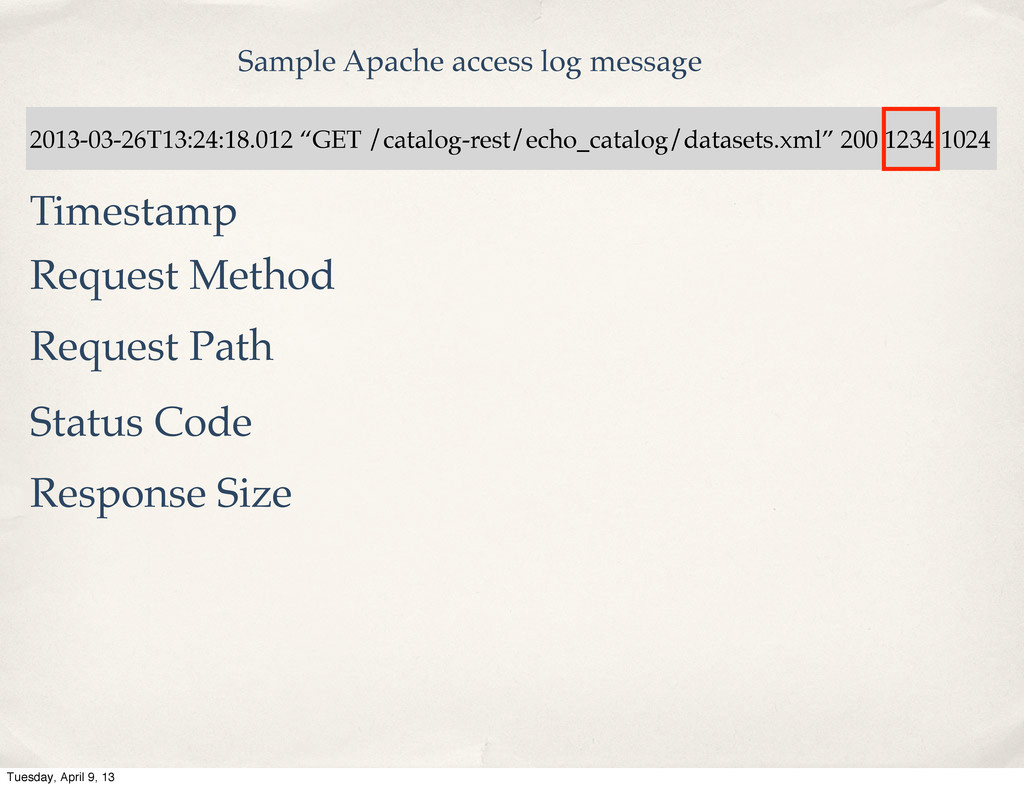
2013-03-26T13:24:18.012 “GET /catalog-rest/echo_catalog/datasets.xml” 200 1234 1024 Sample Apache access log
message Timestamp Request Method Request Path Status Code Response Size Tuesday, April 9, 13
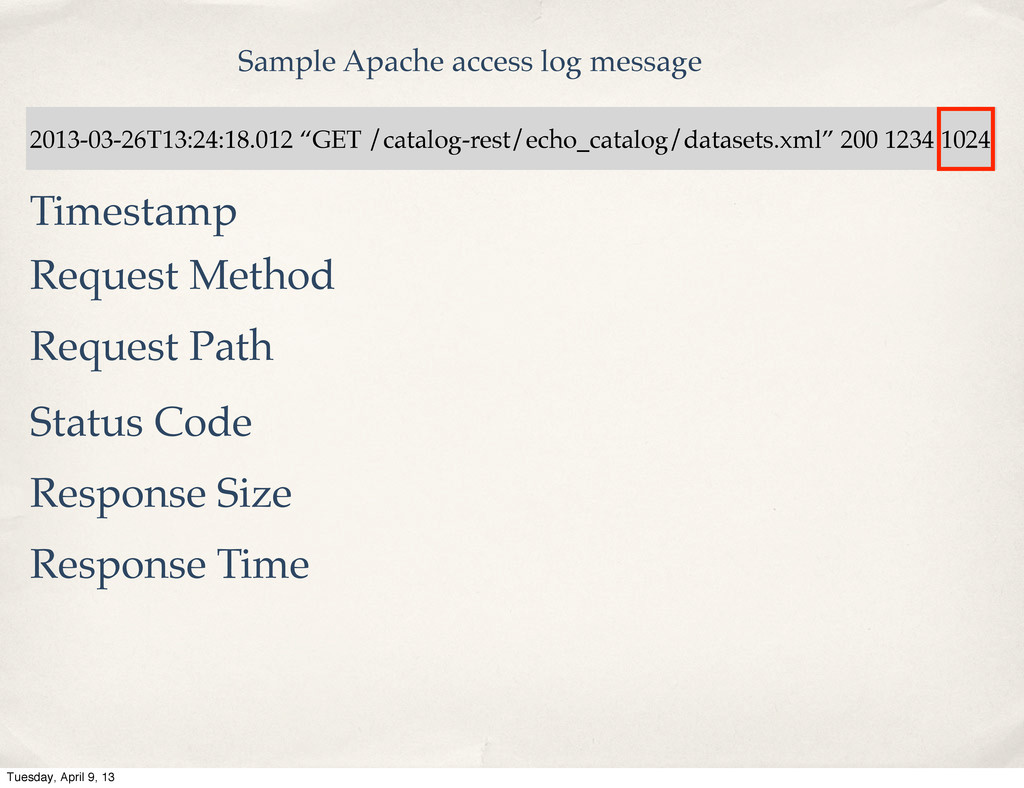
2013-03-26T13:24:18.012 “GET /catalog-rest/echo_catalog/datasets.xml” 200 1234 1024 Sample Apache access log
message Timestamp Request Method Request Path Status Code Response Size Response Time Tuesday, April 9, 13
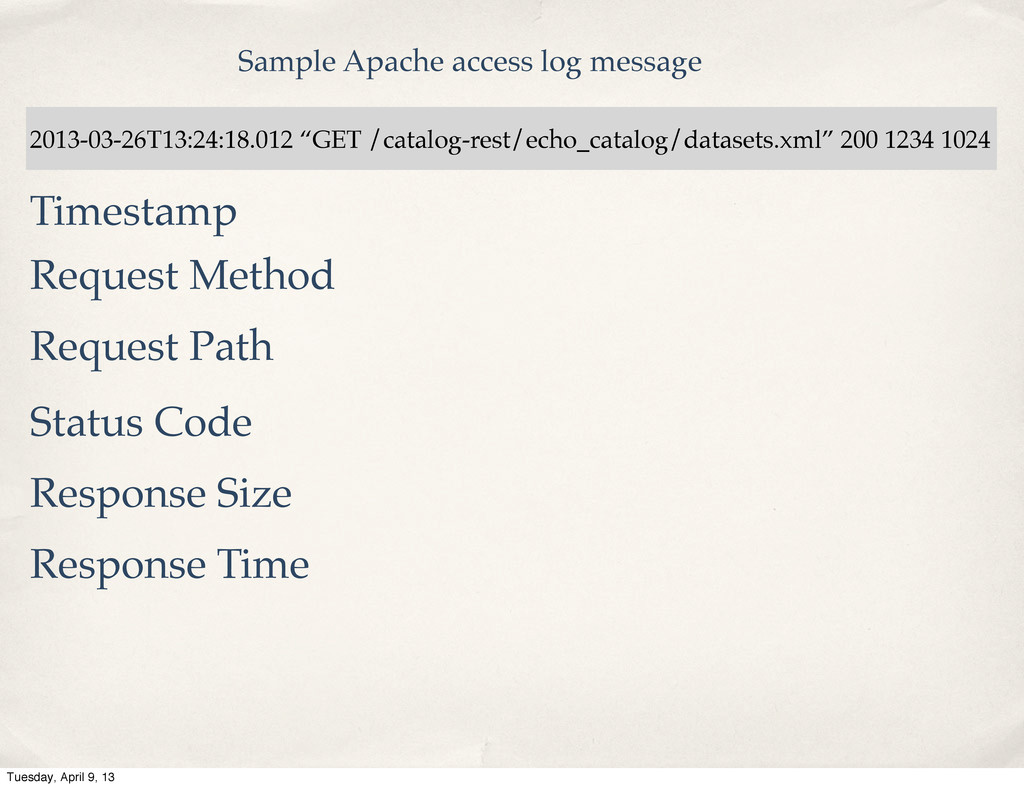
2013-03-26T13:24:18.012 “GET /catalog-rest/echo_catalog/datasets.xml” 200 1234 1024 Sample Apache access log
message Timestamp Request Method Request Path Status Code Response Size Response Time Tuesday, April 9, 13
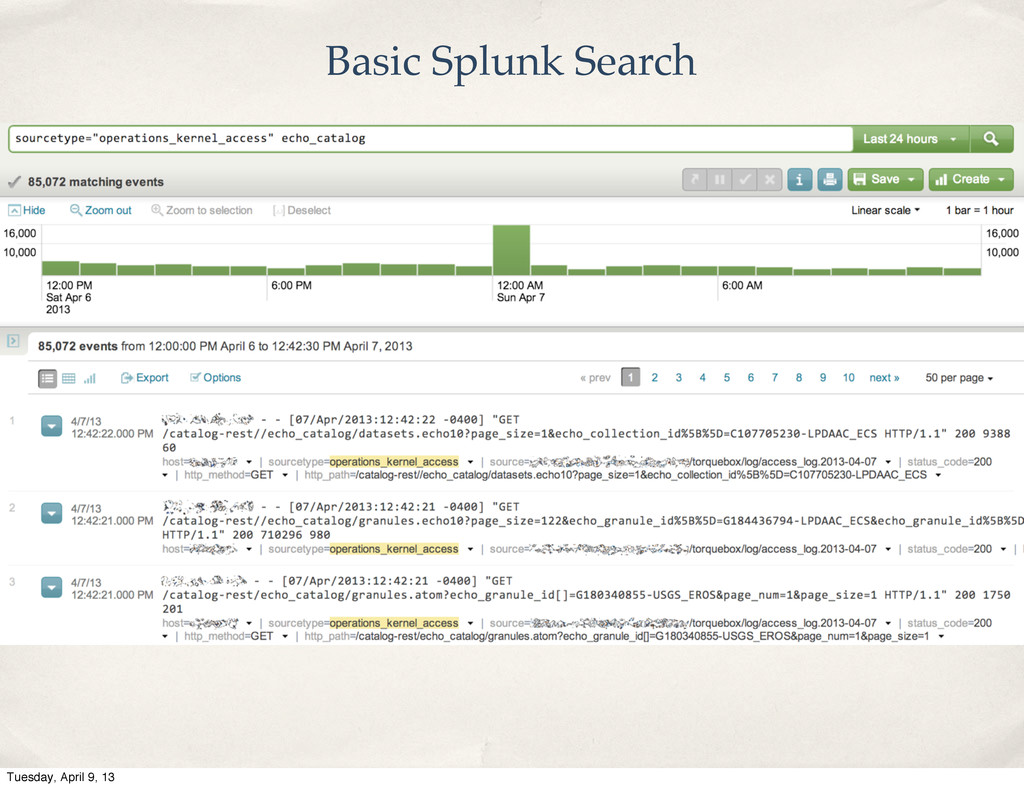
http://www.splunk.com Tuesday, April 9, 13
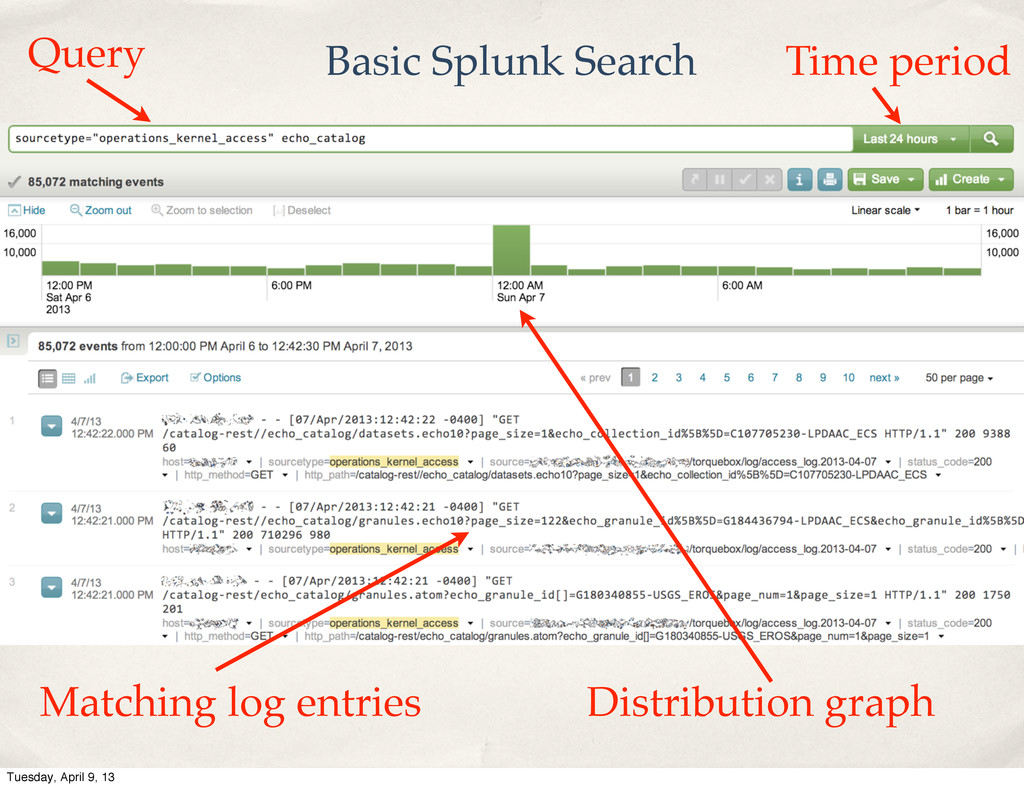
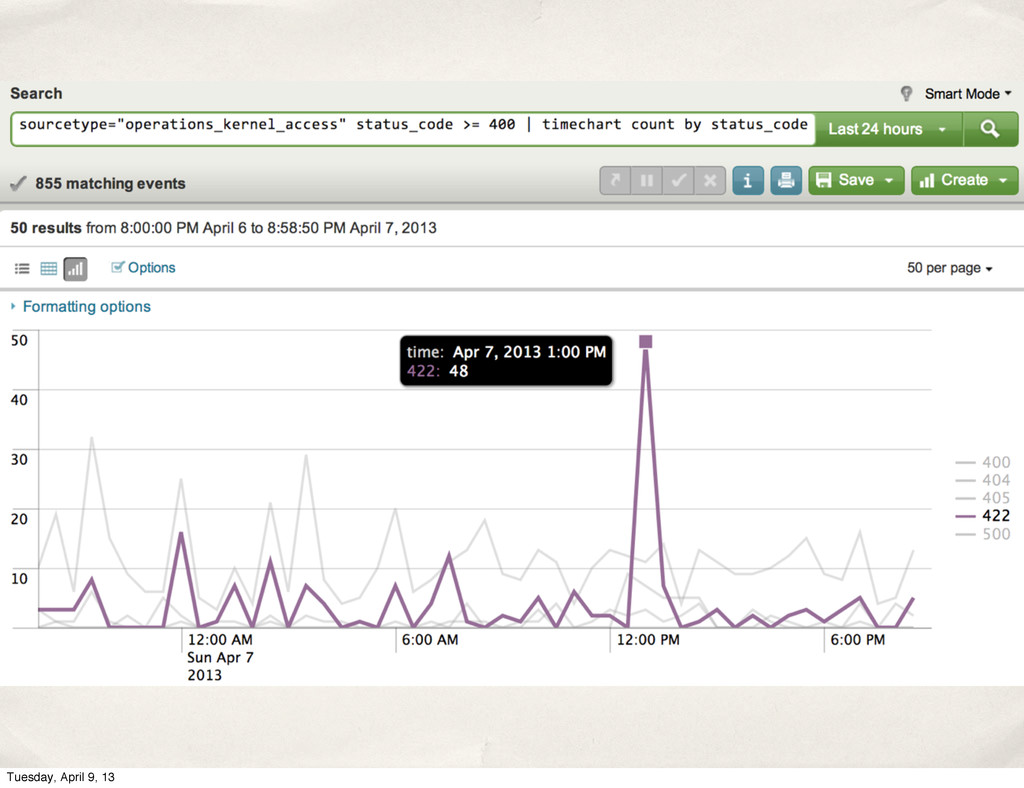
Basic Splunk Search Tuesday, April 9, 13
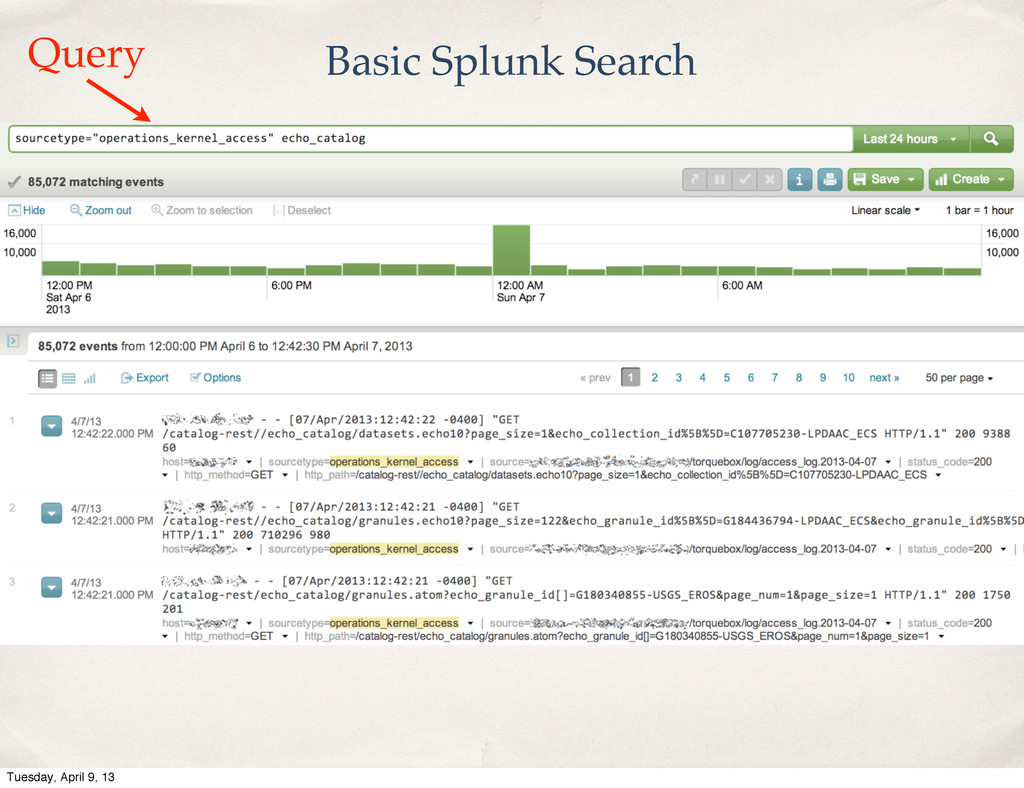
Basic Splunk Search Query Tuesday, April 9, 13
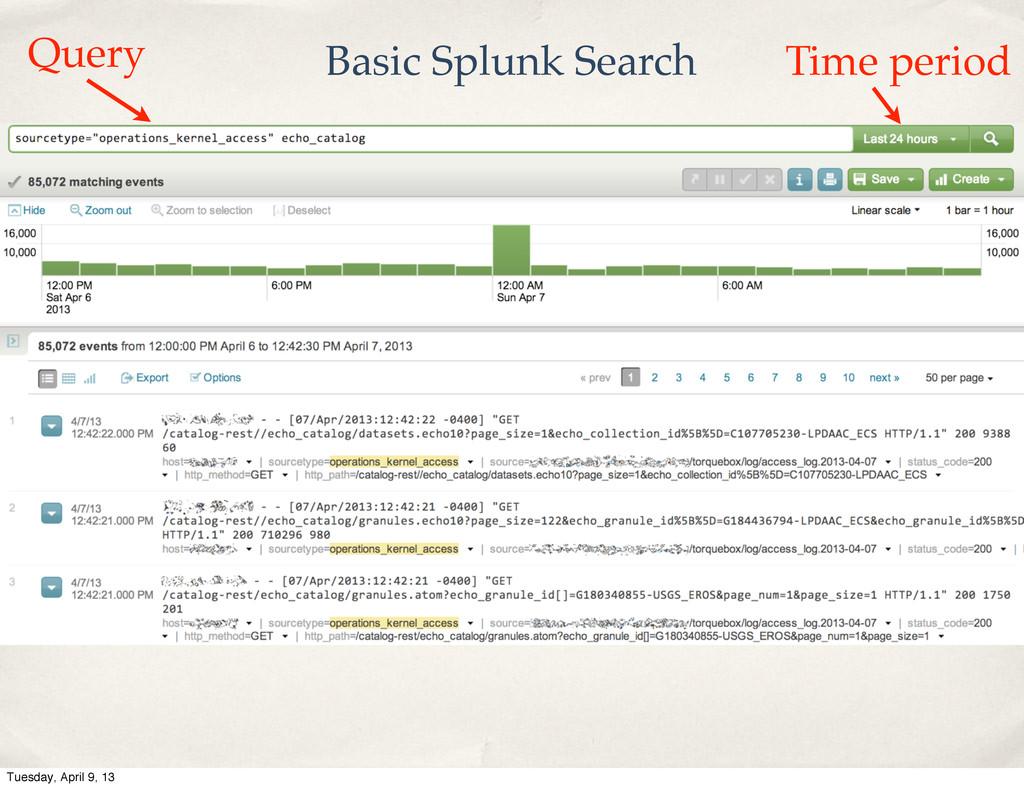
Basic Splunk Search Query Time period Tuesday, April 9, 13
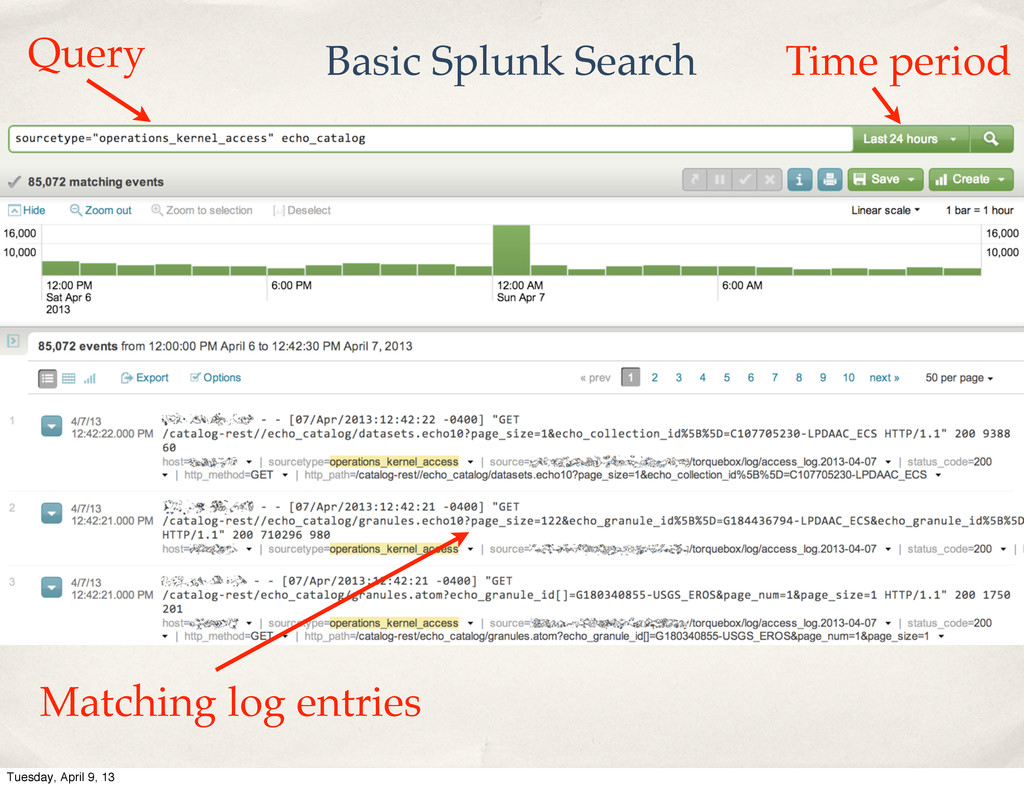
Basic Splunk Search Query Time period Matching log entries Tuesday,
April 9, 13
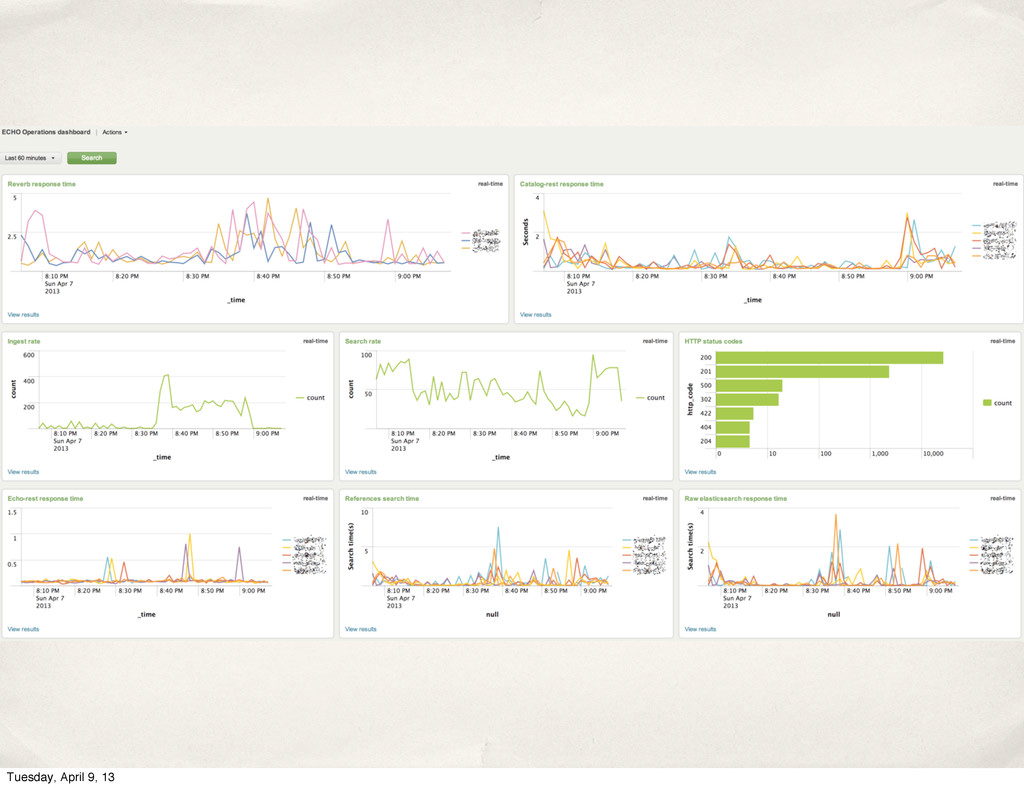
Basic Splunk Search Query Time period Matching log entries Distribution
graph Tuesday, April 9, 13
Tuesday, April 9, 13
Tuesday, April 9, 13
Tuesday, April 9, 13
Tuesday, April 9, 13
Tuesday, April 9, 13
Tuesday, April 9, 13
Tuesday, April 9, 13
Tuesday, April 9, 13
Tuesday, April 9, 13
Summing it all up Tuesday, April 9, 13
Summing it all up ✤ Visualization helps you grasp what’s
happening in a complex system Tuesday, April 9, 13
Summing it all up ✤ Visualization helps you grasp what’s
happening in a complex system ✤ It doesn’t have to be hard Tuesday, April 9, 13
Summing it all up ✤ Visualization helps you grasp what’s
happening in a complex system ✤ It doesn’t have to be hard ✤ You’re already generating and collecting the data you need to begin visualization Tuesday, April 9, 13
Questions? Tuesday, April 9, 13
![Copyright 2013 Visual Load Testing Marc Huffnagle [email protected] Tuesday, April](https://files.speakerdeck.com/presentations/13225990834901303e6622000a1f81f1/slide_0.jpg)