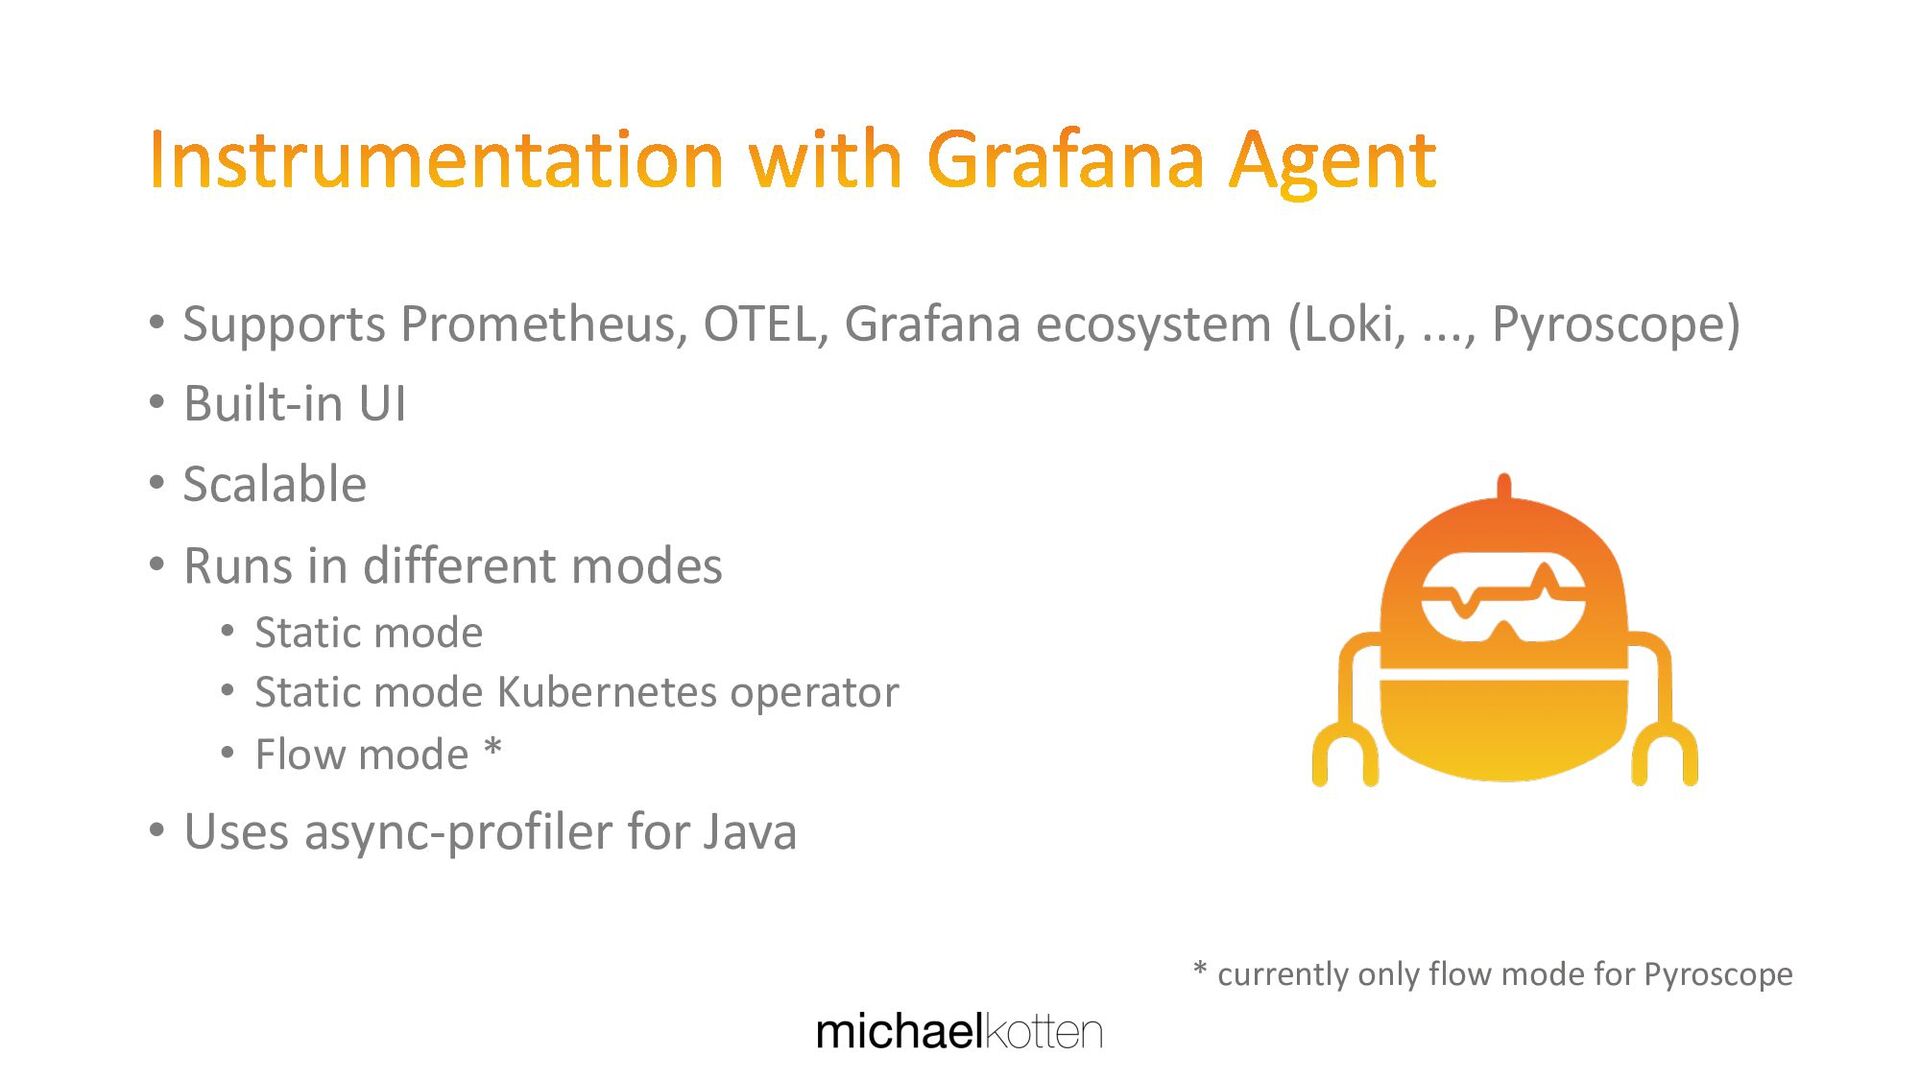
Built-in UI • Scalable • Runs in different modes • Static mode • Static mode Kubernetes operator • Flow mode * • Uses async-profiler for Java • Deprecated, will be replaced by Grafana Alloy * currently only flow mode for Pyroscope
Static labels Pyroscope.setStaticLabels(Map.of("region", System.getenv("REGION"))); // or with Config.Builder if you start pyroscope with PyroscopeAgent.start PyroscopeAgent.start(new Config.Builder() .setLabels(Map.of("region", System.getenv("REGION"))) // ... .build() );
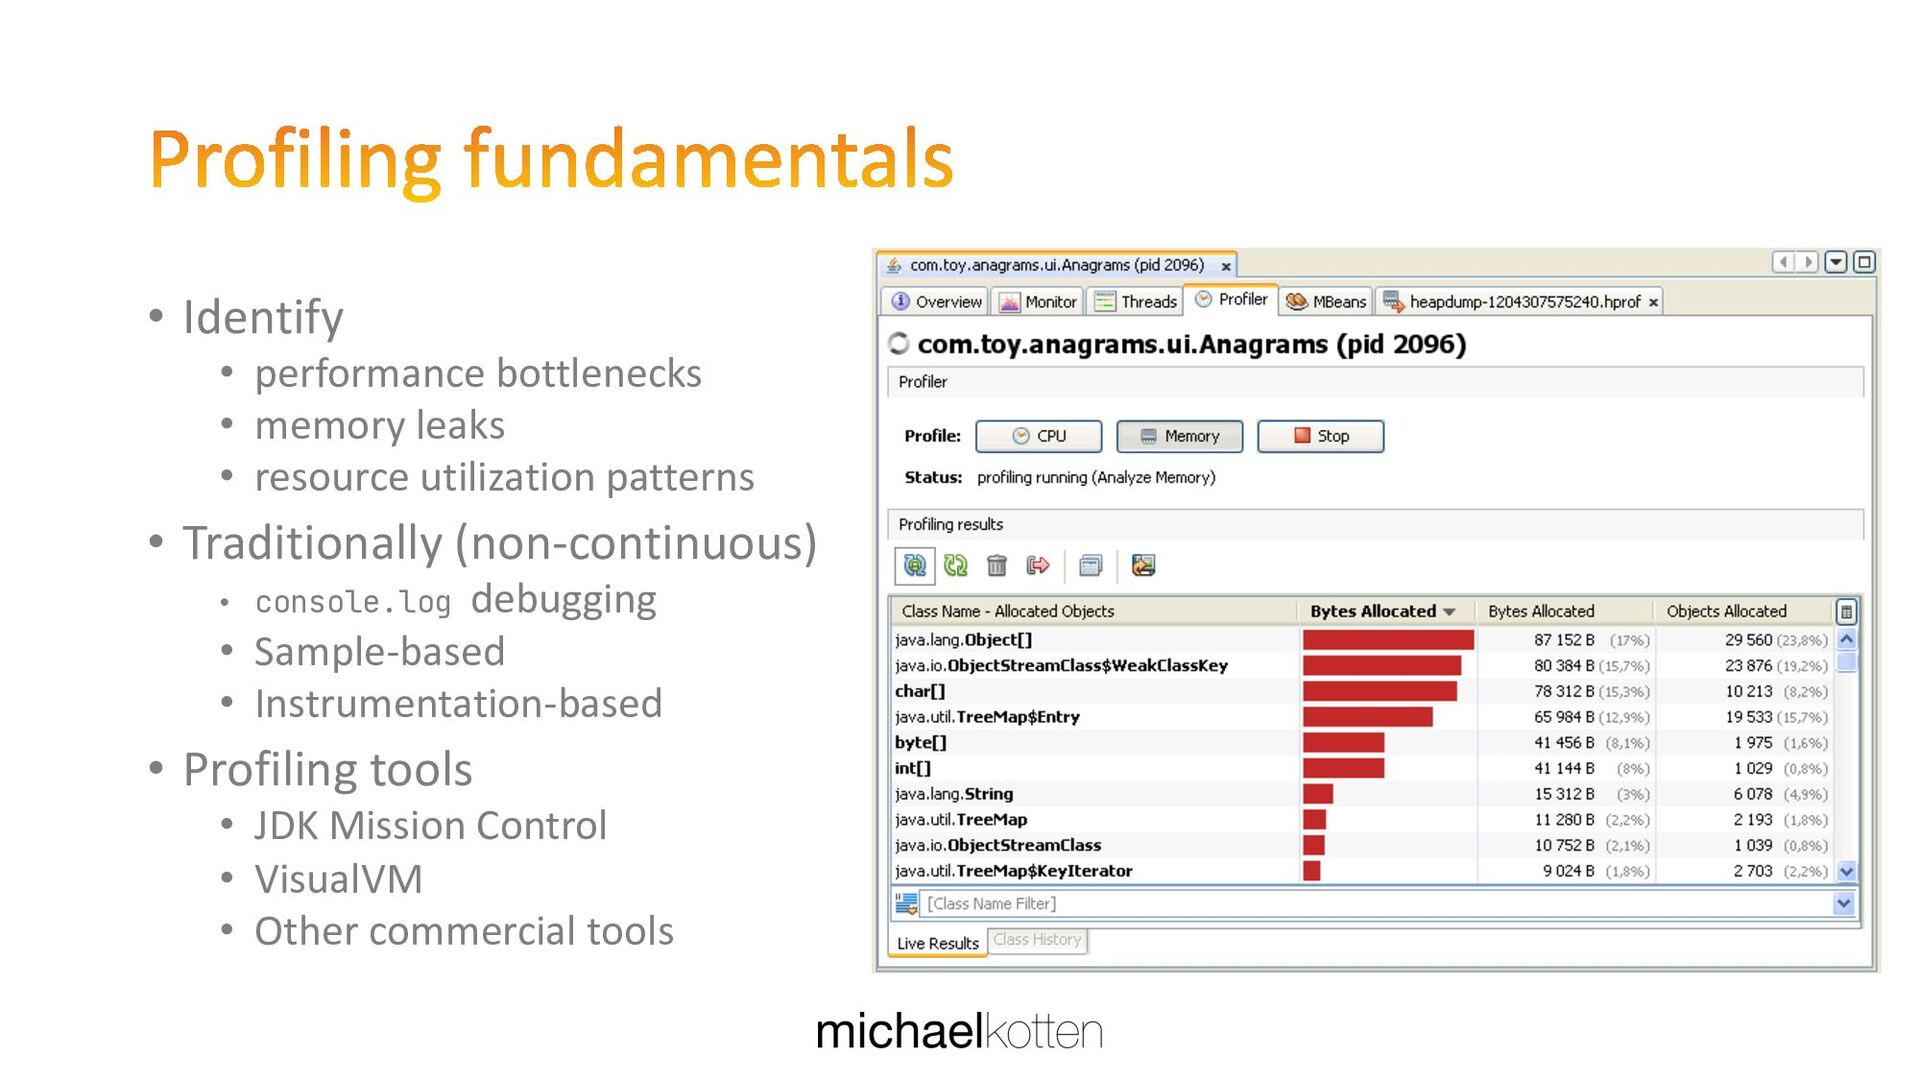
insights • under control of developer • Continuous profiling • production environment or extended performance tests • continuous view of system performance • less detailed due to minimized overhead
![@michaelkotten https://michaelkotten.com [email protected]](https://files.speakerdeck.com/presentations/e99bfb25ffea40638c1a141e324edee9/slide_33.jpg)