Upgrade to Pro — share decks privately, control downloads, hide ads and more …

Organization of research data. How to bring order in the chaos?

Tanja Milotic
January 15, 2019

Organization of research data. How to bring order in the chaos?

How to bring order in the chaos of research data? Practical tips and tricks for organizing data in data files, and structuring data files in folders.

Tanja Milotic

January 15, 2019
Tweet

More Decks by Tanja Milotic

Other Decks in Science

Transcript

  1. Organisatie van onderzoeksdata Hoe orde scheppen in de chaos? Tanja

    Milotić @milotict January 15th, 2019 VVBAD, Brussel @LifeWatchINBO
  2. Why should you even bother? Help your future self •

    higher data quality, less mistakes • increased research efficiency • minimized risk of data loss, less frustrations • saved time & money • prevent to collect duplicate data
  3. Why should you even bother? Motivation for the near future

    • bad data management leads to bad science! • required by funders & publishers • increase your visibility (citations!) • easy data sharing • increased reproducibility “Research data management is part of good research practice”
  4. Positive evolution! Increased understanding of usefulness RDM Application of RDM

    techniques Needed for cooperation − Little knowledge − Little institutional support − Lack of time
  5. Existing datasets • Start research project: search for existing datasets

    • Check conditions for re-use ◦ Costs? ◦ Restrictions for re-use? (e.g., no commercial applications, no manipulations,...) ◦ Sharing results and newly compiled or processed datasets ◦ Citation of data owner? ◦ Permission for re-use? • Check quality and usability of data ◦ Source? ◦ Data collection methods? ◦ Clear metadata? ◦ Data compatibility in project?
  6. Citation of existing research data • Always cite existing data

    sources • According to scientific conventions of your field of research • Citation suggestion often in metadata • Reproducibility of results ◦ Subsets of data ◦ Version of data source ◦ Download date and location ◦ How data were acquired (download from website, personal communication with data owner) ◦ Data publisher, data collector ◦ DOI (digital object identifier)
  7. Collection of new data • Observational data ◦ Unique (location,

    time,...) ◦ Species occurrences, behaviour, climate, archeological excavations,... • Experimental data ◦ Repeatable ◦ Manipulation of environmental variables, psychological tests,... • Simulations ◦ Reproducible ◦ Models (populations, climate, economy,...) • Data processing ◦ Combination and manipulation of datasets ◦ Big data • Literature search
  8. Research data? any information collected/created for the purpose of analysis

    to verify scientific claims Digital(ized) data: observations, measurements, pictures, audio, models,... Physical data: samples (soil, water, tissue,...), collections,...
  9. Organising data and files at different levels • Data file

    format • Organising data in files • Naming data files • Versions of data files • Organising (data) files in (sub)folders
  10. Data file formats • Non proprietary (open source) formats •

    Commonly used (generic data types) • Adopted by the research community • Archive data in open formats • Specific (proprietary) software often allows export in open formats • Use format compatible with computer processing • Proprietary file formats: README.txt file with software version, company “Love your data, and help other love it, too” (Goodman et al, 2014)
  11. Some preferred file formats Tabular data .csv Hierarchically structured data

    .HDF5, .netcdf, .rdf Text .txt, .html, .xml, .odt, .rtf Still images .tif, .jpeg2000, .png, .pdf, .gif, .bmp, .svg Moving images .MOV, .MPEG, .AVI, .MXF Sounds .FLAC, .WAVE, .AIFF, .MP3, .MXF Containers .TAR, .GZIP, .ZIP Databases .XML, .CSV Geospatial .kml, .geojson, .geoTIFF, .netCDF Statistics .ASCII, .CSV Web archive .WARC
  12. Focus on re-use • Standard data formats • Readable by

    programming languages (R, python,...) • Reduced data loss • Less mistakes during conversion • Machine readable -> avoid ◦ Data incorporated in text-file (pdf,..) ◦ Scanned images ◦ Tables from paper source
  13. Organising data in files • Data should be structured for

    analysis • Save time later on! • Write code for humans, write data for computers ◦ Easy import ◦ Easy manipulation ◦ Higher reproducibility and re-use • Tidy data concept for tabular data ◦ Rows = observations ◦ Columns = variables ◦ Table = observational unit
  14. Untidy data Individual Treatment A Treatment B Individual 1 -

    15 Individual 2 2 233 Individual 3 5.5 10
  15. Untidy data Individual Treatment A Treatment B Individual 1 -

    15 Individual 2 2 233 Individual 3 5.5 10 Individual 1 Individual 2 Individual 3 Treatment A - 2 5.5 Treatment B 15 233 10
  16. Untidy data Individual Treatment A Treatment B Individual 1 -

    15 Individual 2 2 233 Individual 3 5.5 10 Individual 1 Individual 2 Individual 3 Treatment A - 2 5.5 Treatment B 15 233 10 individuals
  17. Untidy data Individual Treatment A Treatment B Individual 1 -

    15 Individual 2 2 233 Individual 3 5.5 10 Individual 1 Individual 2 Individual 3 Treatment A - 2 5.5 Treatment B 15 233 10 individuals treatments
  18. Untidy data Individual Treatment A Treatment B Individual 1 -

    15 Individual 2 2 233 Individual 3 5.5 10 Individual 1 Individual 2 Individual 3 Treatment A - 2 5.5 Treatment B 15 233 10 individuals treatments results
  19. Tidy data Individual Treatment Result Individual 1 A Individual 2

    A 2 Individual 3 A 5.5 Individual 1 B 15 Individual 2 B 233 Individual 3 B 10
  20. Tidy data Individual Treatment Result Individual 1 A Individual 2

    A 2 Individual 3 A 5.5 Individual 1 B 15 Individual 2 B 233 Individual 3 B 10 Each variable forms a column and contains a value
  21. Tidy data Individual Treatment Result Individual 1 A Individual 2

    A 2 Individual 3 A 5.5 Individual 1 B 15 Individual 2 B 233 Individual 3 B 10 Individual Treatment Result Individual 1 A Individual 2 A 2 Individual 3 A 5.5 Individual 1 B 15 Individual 2 B 233 Individual 3 B 10 Each variable forms a column and contains a value Each observation forms a row
  22. Tidy data Individual Treatment Result Individual 1 A Individual 2

    A 2 Individual 3 A 5.5 Individual 1 B 15 Individual 2 B 233 Individual 3 B 10 Individual Treatment Result Individual 1 A Individual 2 A 2 Individual 3 A 5.5 Individual 1 B 15 Individual 2 B 233 Individual 3 B 10 Individual Treatment Result Individual 1 A Individual 2 A 2 Individual 3 A 5.5 Individual 1 B 15 Individual 2 B 233 Individual 3 B 10 Each variable forms a column and contains a value Each observation forms a row Each cell contains a value and each column contains values of the same data type
  23. Tidy data Individual Treatment Result Individual 1 A Individual 2

    A 2 Individual 3 A 5.5 Individual 1 B 15 Individual 2 B 233 Individual 3 B 10 Each observational unit forms a table Individual Country decimalLatitude decimalLongitude Individual 1 BE 51.154621 3.454508 Individual 2 NL 51.404667 4.383826 Individual 3 BE 51.154621 3.454508
  24. Tidy data • Fixed variables (Individual, treatment) ◦ Experimental design

    ◦ Known in advance ◦ Put on left side of table • Measured variables (result) ◦ Measured during the study ◦ Put on right side of table Individual Treatment Result Individual 1 A Individual 2 A 2 Individual 3 A 5.5 Individual 1 B 15 Individual 2 B 233 Individual 3 B 10
  25. Formatting errors Not filling in zeros • Difference blank value

    (empty cell) and 0 value? • Computer: ◦ Blank value = unmeasured variable ◦ 0 = measured value of 0 • Importance of 0 values in analysis
  26. Software tools • Use code to perform repetitive data cleaning

    tasks (e.g., R, python,...) • Exploratory (R) • Package tidyverse in R • Never manipulate the original file! • Tidy data are easier ◦ To manipulate (filter, reorder, transform, aggregate, sort,...) ◦ To visualize (graphs, charts,...) ◦ To use in (statistical) models
  27. File names • Unique file names • Comprehensible • No

    special characters • Use _ instead of spaces • YYYY-MM-DD dates • Include initials, project, location, variable, content 2018-02-28_TM_SAFRED_RDM.pdf
  28. Keeping track of changes In general • Backup changes ASAP

    • Keep changes small • Share changes frequently Manually track changes • Add a CHANGELOG.txt • Copy entire project after large changes Version control system • Git • GitHub, Bitbucket, Gitlab,... File naming conventions: file_v1, file_v2 Use a version control system (recommended)
  29. Folder structure • Use a well-defined folder structure |- README.md

    <- The top-level README describing the general layout of the project |- data <- research data | |- raw <- The original, read-only acquired raw data | |- interim <- Intermediate data that has been transformed. | |- processed <- final data products, used in the report/paper/graphs | |_ external <- used additional third party data resources (e.g. vector maps) |- reports <- reported outcome of the analysis as LaTeX, word, markdown,... | |_ figures <- Generated graphics and figures to be used in reporting |- src <- set of analysis scripts used in the analysis “Keep raw data raw!” (Hart et al, 2016)
  30. Documentation & metadata Why? • Long term usability • Avoid

    misinterpretation • Collaboration & staff changes • Save your memory for other stuff… @TDXDigLibrary
  31. Concept of metadata is not new... Sidereus nuncius (Galilei, 1610)

    • Data: position of Jupiter + moons (drawings) • Metadata: observation timing, weather, telescoop properties • Text: methodology, analyses, conclusions Goodman et al. (2014)
  32. Project documentation Add a README.txt to your project folder •

    Context • People • Sponsor(s) • Data collection methods • File organization • Known problems, limitations, gaps • Licenses • How to cite
  33. Data documentation README.txt for each dataset • Descriptive metadata ◦

    Author, title, abstract, date ◦ Context (location, methods,...) • Structural metadata ◦ Variable names, labels, data type, description ◦ Explain codes & abbreviations ◦ Code & reason for missing values ◦ Code used for derived data
  34. Data documentation README.txt for each dataset • Technical metadata ◦

    File format ◦ Used software and hardware ◦ Encryption ◦ Version ◦ Metadata standards • Administrative metadata ◦ Licences ◦ Citation
  35. References Goodman, Pepe, Blocker, Borgman, Cranmer, Crosas, Di Stefano, Gil,

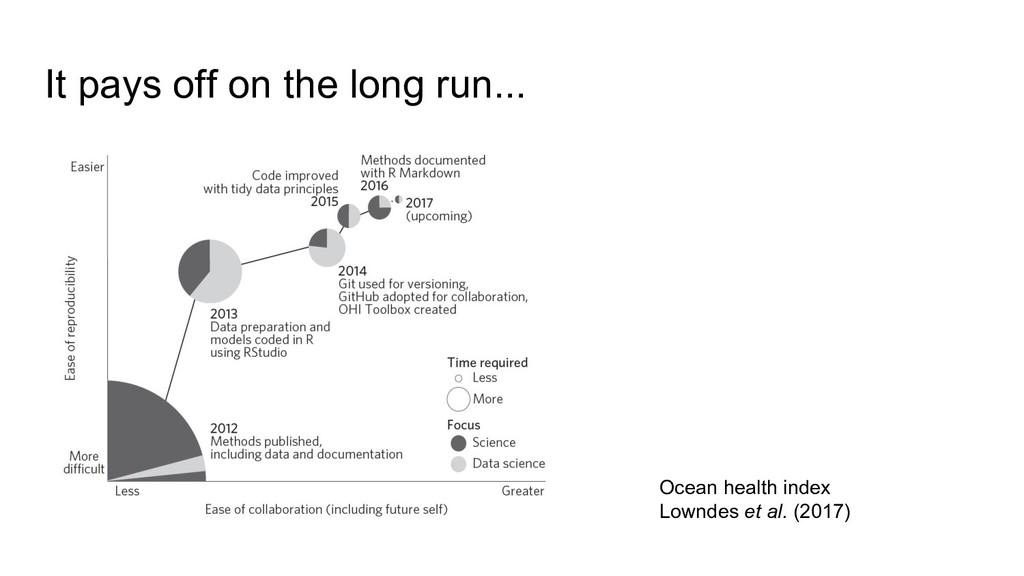
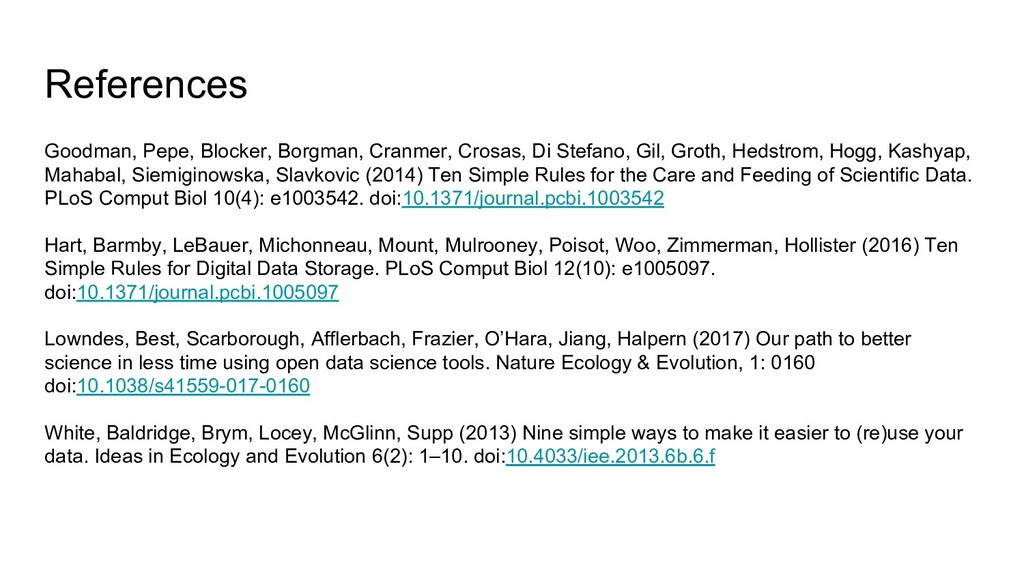
    Groth, Hedstrom, Hogg, Kashyap, Mahabal, Siemiginowska, Slavkovic (2014) Ten Simple Rules for the Care and Feeding of Scientific Data. PLoS Comput Biol 10(4): e1003542. doi:10.1371/journal.pcbi.1003542 Hart, Barmby, LeBauer, Michonneau, Mount, Mulrooney, Poisot, Woo, Zimmerman, Hollister (2016) Ten Simple Rules for Digital Data Storage. PLoS Comput Biol 12(10): e1005097. doi:10.1371/journal.pcbi.1005097 Lowndes, Best, Scarborough, Afflerbach, Frazier, O’Hara, Jiang, Halpern (2017) Our path to better science in less time using open data science tools. Nature Ecology & Evolution, 1: 0160 doi:10.1038/s41559-017-0160 White, Baldridge, Brym, Locey, McGlinn, Supp (2013) Nine simple ways to make it easier to (re)use your data. Ideas in Ecology and Evolution 6(2): 1–10. doi:10.4033/iee.2013.6b.6.f