Upgrade to Pro — share decks privately, control downloads, hide ads and more …

Start with data science

Start with data science

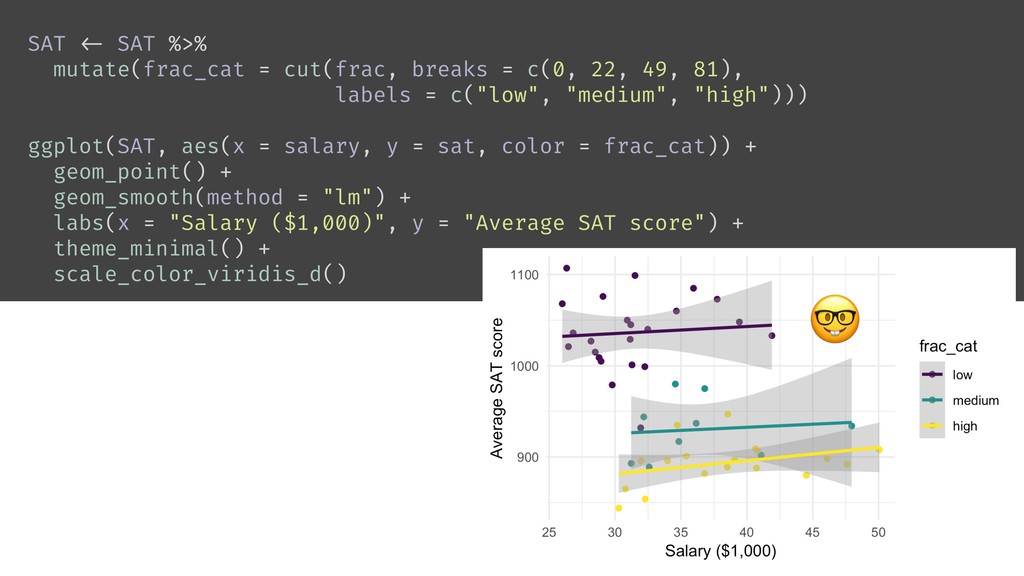
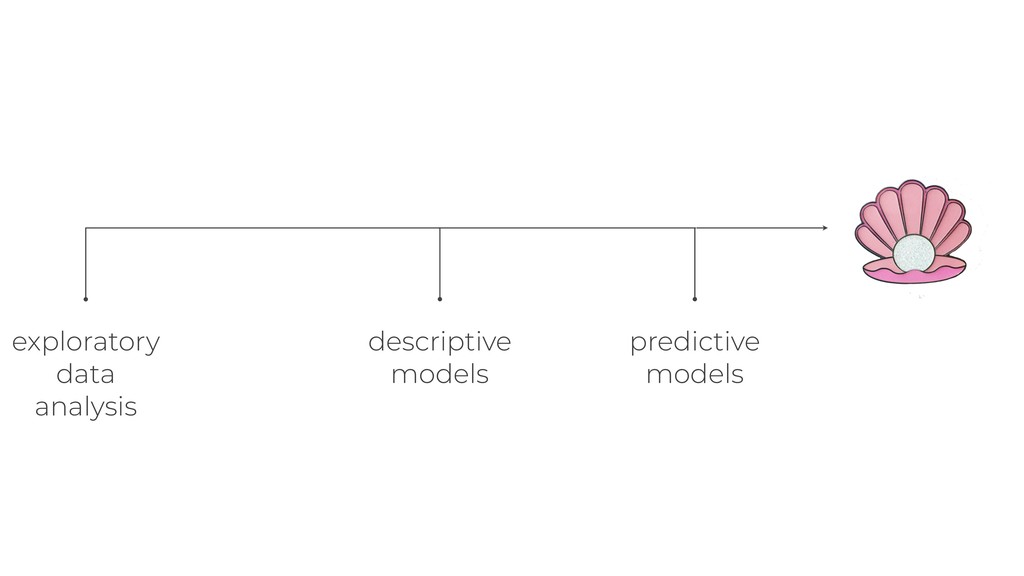
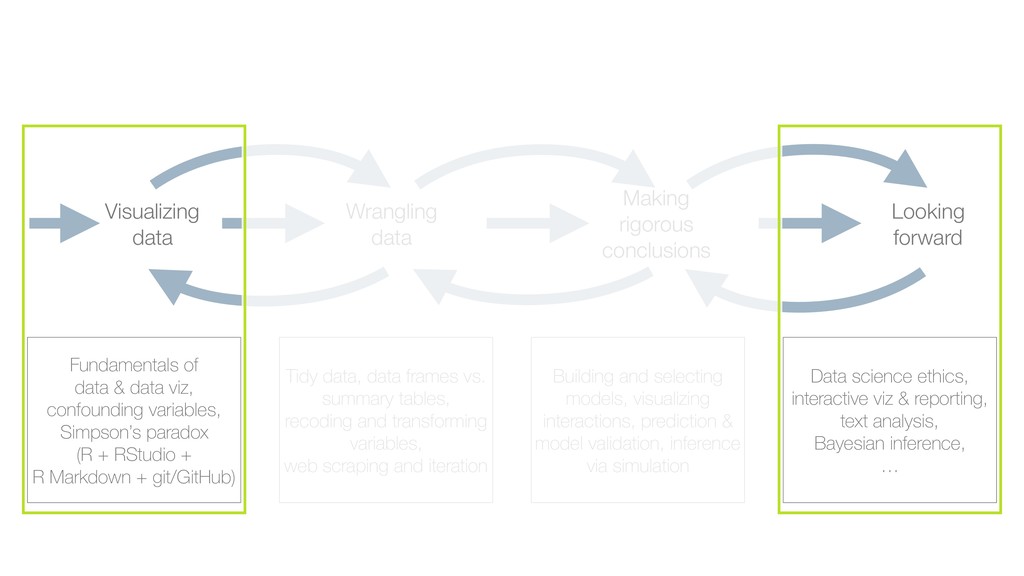
Suppose our goal is to educate the new generation of data scientists working on machine learning and artificial intelligence problems, and especially those who are not intimidated by learning new computing technologies. Where do we start their education at the college level? Given we can't cram everything they need to know into a single introductory course, which topics do we cover in their first course, and which topics do we postpone till later? In this talk, we propose an introductory data science course that places a heavy emphasis on exploratory data analysis and modeling as well as collaboration, effective communication of findings, and ethical considerations as a welcoming and horizon broadening introduction to the discipline at large.

This talk was presented at the IBM CSIG weekly update, see http://cognitive-science.info/community/weekly-update/ for more information on the talk series.

Mine Cetinkaya-Rundel

December 13, 2018
Tweet

More Decks by Mine Cetinkaya-Rundel

Other Decks in Education

Transcript

  1. "

  2. Goal: Educate the new generation of data scientists ‣ working

    on ML and AI problems ‣ not intimidated by learning new computing technologies
  3. How early? Q How long? Q How inclusive? Q as

    early as possible 10-15 weeks yes!
  4. estimated average annual salary of teachers in public elementary and

    secondary schools state salary sat frac 1 Alabama 31.1 1029 8 2 Alaska 48.0 934 47 3 Arizona 32.2 944 27 4 Arkansas 28.9 1005 6 5 California 41.1 902 45 6 Colorado 34.6 980 29 7 Connecticut 50.0 908 81 8 Delaware 39.1 897 68 9 Florida 32.6 889 48 10 Georgia 32.3 854 65 # !!... with 40 more rows average total SAT score, 1994-95 percentage of all eligible students taking the SAT case study teacher salaries
  5. mosaicData Randall Pruim, Daniel Kaplan and Nicholas Horton (2018). mosaicData:

    Project MOSAIC Data Sets. R package version 0.17.0. https://CRAN.R-project.org/package=mosaicData tidyverse Hadley Wickham (2017). tidyverse: Easily Install and Load the 'Tidyverse'. R package version 1.2.1. https://CRAN.R-project.org/package=tidyverse broom David Robinson and Alex Hayes (2018). broom: Convert Statistical Analysis Objects into Tidy Tibbles. R package version 0.5.0. https://CRAN.R-project.org/package=broom reprex Jennifer Bryan, Jim Hester, David Robinson and Hadley Wickham (2018). reprex: Prepare Reproducible Example Code via the Clipboard. R package version 0.2.1. https://CRAN.R- project.org/package=reprex
  6. mod_sat_sal !<- lm(sat ~ salary, data = SAT) new_teacher !<-

    tibble(salary = 40) predict(mod_sat_sal, new_teacher) #> 1 #> 937.2742
  7. clusters !<- kmeans(SAT %>% select(salary, sat, frac), centers = 3)

    SAT !<- SAT %>% mutate(cluster = factor(clusters$cluster))
  8. ggplot(SAT, aes(x = salary, y = sat)) + geom_point() +

    labs(x = "Salary ($1,000)", y = "Average SAT score") + theme_minimal()
  9. ggplot(SAT, aes(x = salary, y = sat, color = frac))

    + geom_point() + theme_minimal() + labs(x = "Salary ($1,000)", y = "Average SAT score") + scale_color_viridis_c()
  10. SAT !<- SAT %>% mutate(frac_cat = cut(frac, breaks = c(0,

    22, 49, 81), labels = c("low", "medium", "high"))) ggplot(SAT, aes(x = salary, y = sat, color = frac_cat)) + geom_point() + geom_smooth(method = "lm") + labs(x = "Salary ($1,000)", y = "Average SAT score") + theme_minimal() + scale_color_viridis_d()
  11. Visualizing data Wrangling data Making rigorous conclusions Looking forward Fundamentals

    of data & data viz, confounding variables, Simpson’s paradox (R + RStudio + R Markdown + git/GitHub) Tidy data, data frames vs. summary tables, recoding and transforming variables, web scraping and iteration Building and selecting models, visualizing interactions, prediction & model validation, inference via simulation Data science ethics, interactive viz & reporting, text analysis, Bayesian inference, …
  12. Visualizing data Wrangling data Making rigorous conclusions Looking forward Fundamentals

    of data & data viz, confounding variables, Simpson’s paradox (R + RStudio + R Markdown + git/GitHub) Tidy data, data frames vs. summary tables, recoding and transforming variables, web scraping and iteration Building and selecting models, visualizing interactions, prediction & model validation, inference via simulation Data science ethics, interactive viz & reporting, text analysis, Bayesian inference, …
  13. more likely for students to have intuition for interpretations coming

    in easier for them to catch their own mistakes great way to introduce programming
  14. ggplot(SAT, aes(x = salary, y = sat)) function( arguments )

    often a verb what to apply that Verb to
  15. ggplot(SAT, aes(x = salary, y = sat)) + geom_point() state

    salary sat frac 1 Alabama 31.1 1029 8 2 Alaska 48.0 934 47 3 Arizona 32.2 944 27 4 Arkansas 28.9 1005 6 5 California 41.1 902 45 6 Colorado 34.6 980 29 7 Connecticut 50.0 908 81 8 Delaware 39.1 897 68 9 Florida 32.6 889 48 10 Georgia 32.3 854 65 # !!... with 40 more rows tidy data frame
  16. ggplot(SAT, aes(x = salary, y = sat, color = frac_cat))

    + geom_point() + geom_smooth(method = "lm")
  17. ggplot(SAT, aes(x = salary, y = sat, color = frac_cat))

    + geom_point() + geom_smooth(method = "lm") + labs(x = "Salary ($1,000)", y = "Average SAT score", color = "% taking SAT") + theme_minimal() + scale_color_viridis_d()
  18. empower, and warn, at the same time help students think

    beyond what the course curriculum can offer do so using case studies they can relate to based on course curriculum
  19. training a model sentiment analysis implemen- tation in R Source:

    notstatschat.rbind.io/2018/09/27/how-to-write-a-racist-ai-in-r-without-really-trying/