Upgrade to Pro — share decks privately, control downloads, hide ads and more …

Debugging Jupyter Notebooks

MKhalusova
November 16, 2019

Debugging Jupyter Notebooks

Presented at PyCon Canada: https://2019.pycon.ca/
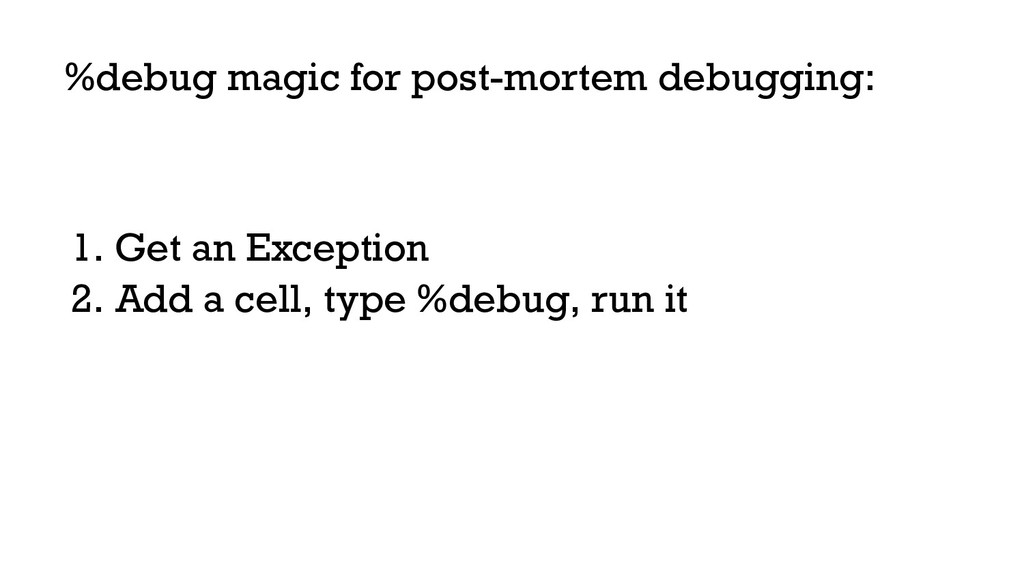
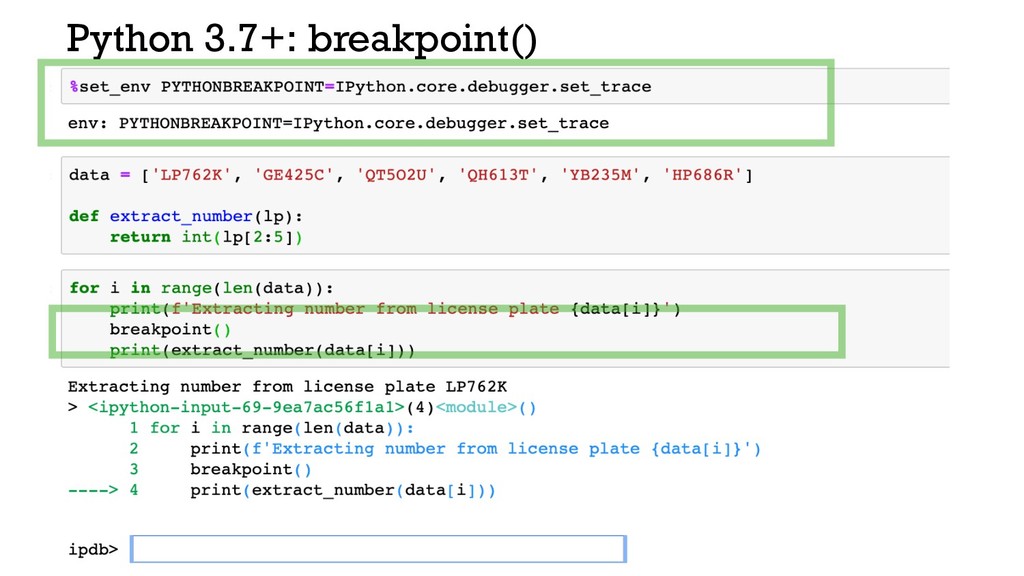
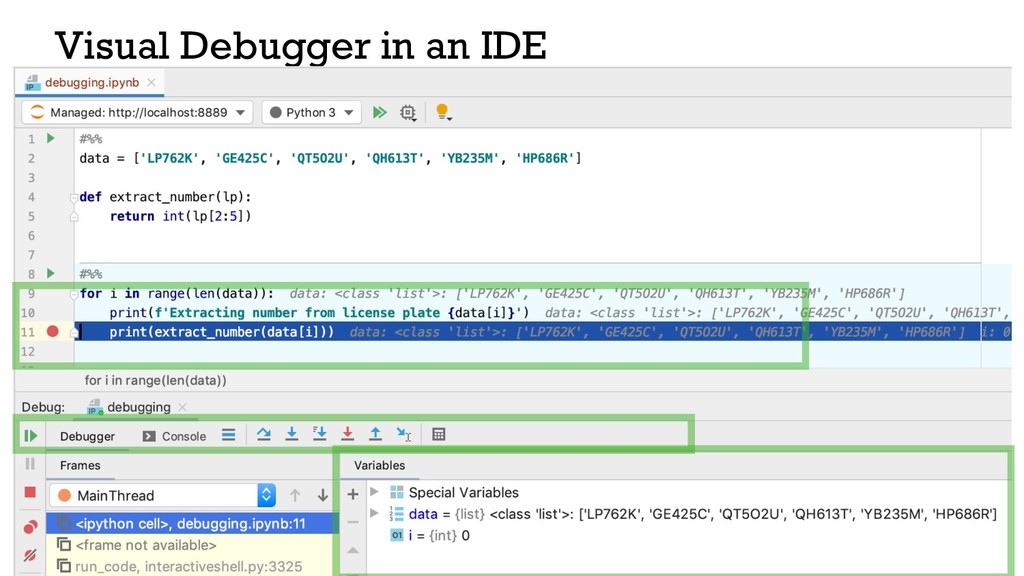
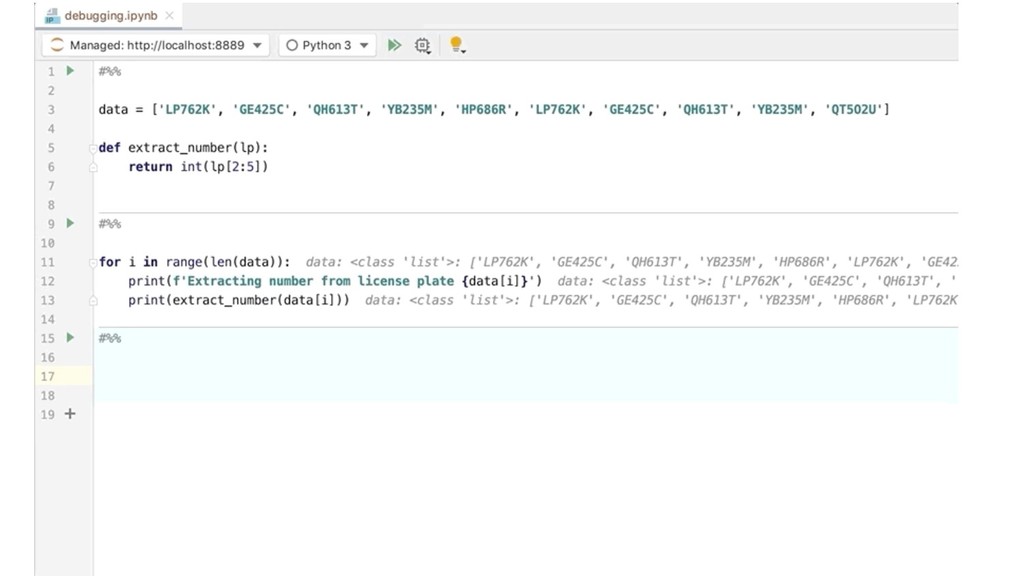
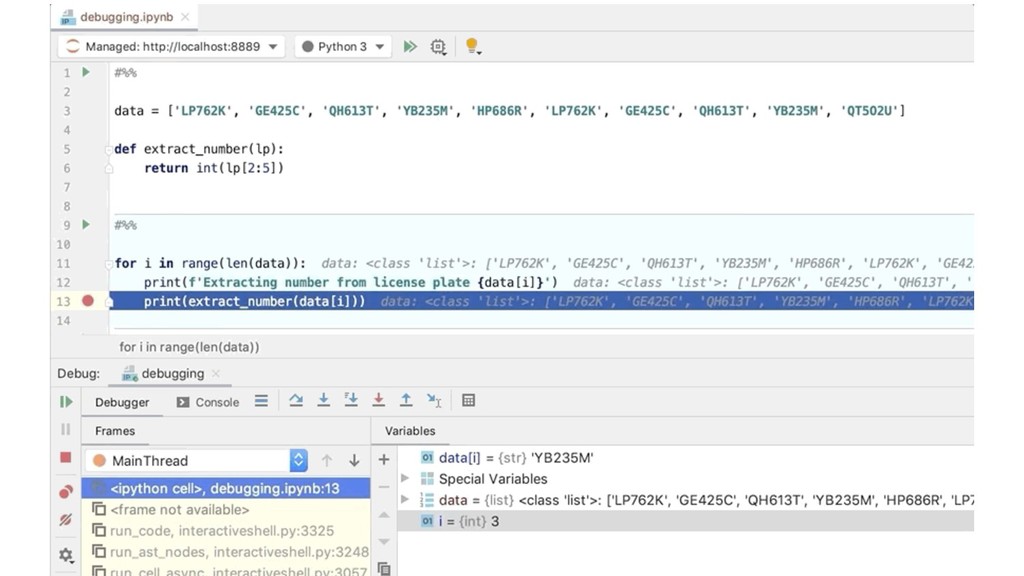
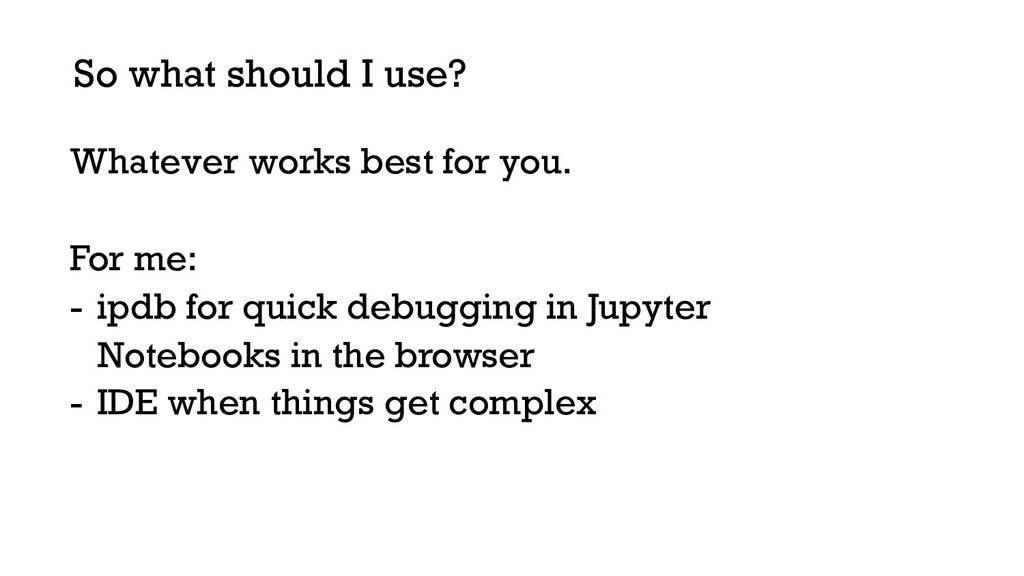
Description: Writing code in a Jupyter Notebook is an interactive process involving a lot of trial and error. As your code evolves, errors and bugs inevitably start to creep in. A debugger can help track them down. In this talk, we’ll go through some reasons why you may want to debug your notebook. Then, we’ll explore how you can debug notebooks with the ipdb debugger. Finally, we’ll see how we can use an IDE to track down those pesky bugs.

MKhalusova

November 16, 2019
Tweet

More Decks by MKhalusova

Other Decks in Technology

Transcript

  1. 4

  2. 7

  3. 9

  4. 10 1. Get an Exception 2. Add a cell, type

    %debug, run it %debug magic for post-mortem debugging:
  5. 11

  6. 12

  7. 13 a: arguments of current function p expression: evaluate expression

    h: help up: move up in the stack trace d: move down in the stack trace q: quit ipdb commands
  8. 16 n: execute current statement (step over) s: execute and

    step into function (step into) r: continue execution until the current function returns c: continue execution until next breakpoint w: print current position l: list lines of code around current line <ENTER>: repeats previous command more ipdb commands
  9. 17

  10. 19 Need to modify code = > need to clean

    up Need to remember the commands Need to look up the state of variables, location in code, etc.
  11. 21

  12. 22

  13. 23 JupyterLab debugger UI extension: under development and not yet

    available https://github.com/jupyterlab/debugger
  14. 24 Whatever works best for you. For me: - ipdb

    for quick debugging in Jupyter Notebooks in the browser - IDE when things get complex So what should I use?