Upgrade to Pro — share decks privately, control downloads, hide ads and more …

Machine Learning Model Evaluation Metrics

MKhalusova
February 26, 2020

Machine Learning Model Evaluation Metrics

ConFoo, Montreal 2020
Links from the last slide:
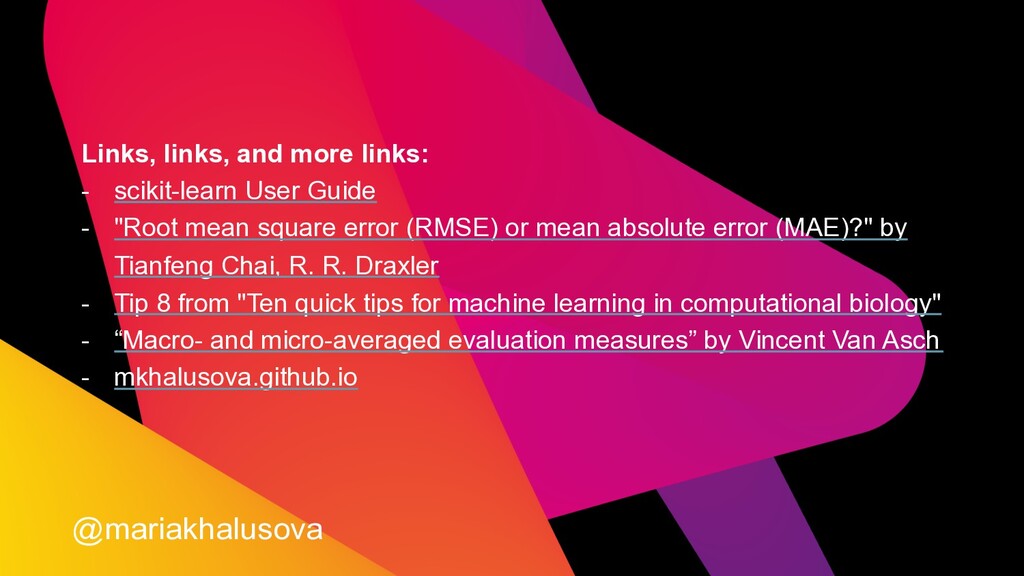
scikit-learn User Guide: https://scikit-learn.org/stable/user_guide.html
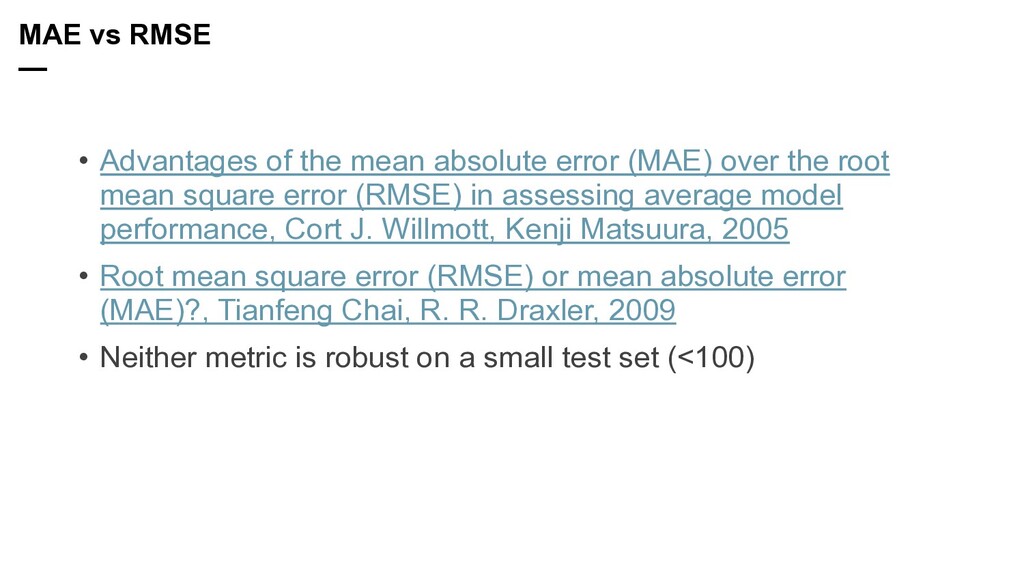
"Root mean square error (RMSE) or mean absolute error (MAE)?" by Tianfeng Chai, R. R. Draxler: https://www.researchgate.net/publication/262980567_Root_mean_square_error_RMSE_or_mean_absolute_error_MAE
Tip 8 from "Ten quick tips for machine learning in computational biology": https://biodatamining.biomedcentral.com/articles/10.1186/s13040-017-0155-3
“Macro- and micro-averaged evaluation measures” by Vincent Van Asch : https://pdfs.semanticscholar.org/1d10/6a2730801b6210a67f7622e4d192bb309303.pdf
Blog post versions of the talk: mkhalusova.github.io

MKhalusova

February 26, 2020
Tweet

More Decks by MKhalusova

Other Decks in Technology

Transcript

  1. 2 Evaluation metric is a way to quantify performance of

    a machine learning model What is an evaluation metric? —
  2. 3 How do you evaluate a model? — • Holdout

    (Train/Test split) • Cross-validation • …
  3. 4 Classification Regression Classification accuracy Precision Recall F1 score ROC/AUC

    Precision/Recall AUC Matthews correlation coefficient Log loss … R^2 MAE MSE RMSE RMSLE MAPE … Supervised learning metrics —
  4. 6 Accuracy = Number of correct predictions Total number of

    predictions Classification accuracy —
  5. 8 96% Accuracy • Is it a good model? •

    What errors is the model making? Classification accuracy —
  6. 9 • Not a metric • Helps to gain insight

    into the type of errors a model is making • Helps to understand some other metrics Confusion matrix —
  7. 12 Predicted: 0 Predicted: 1 True: 0 TN = 126

    FP = 13 True: 1 FN = 24 TP = 60 Precision = TP TP + FP Recall = TP TP + FN F1 score = 2 * Precision * Recall Precision + Recall = 2 * TP 2 * TP + FP + FN Precision, Recall, F1 score —
  8. 13 What do you care about? • Minimizing False Positives

    -> Precision • Minimizing False Negatives -> Recall Precision or Recall? — This depends on your business problem.
  9. 16 MCC = TP * TN − FP * FN

    (TP + FP)(TP + FN)(TN + FP)(TN + FN) Takes into account all four confusion matrix categories Another way to sum up confusion matrix Matthews Correlation Coefficient —
  10. 17 Predicted: 0 Predicted: 1 True: 0 TN = 0

    FP = 5 True: 1 FN = 0 TP = 95 Data: 100 samples. 95 positive, 5 negative. Model: DummyClassifier F1 score = 2 * TP 2 * TP + FP + FN = 2 * 95 2 * 95 + 5 = 190 195 = 0.974 MCC = TP * TN − FP * FN (TP + FP)(TP + FN)(TN + FP)(TN + FN) = 95 * 0 − 5 * 0 100 * 95 * 5 * 0 = undefined MCC vs F1 score —
  11. 18 Predicted: 0 Predicted: 1 True: 0 TN = 1

    FP = 4 True: 1 FN = 5 TP = 90 Predicted: 0 Predicted: 1 True: 0 TN = 90 FP = 5 True: 1 FN = 4 TP = 1 F1 Score = 0.952 MCC = 0.135 F1 Score = 0.182 MCC = 0.135 F1-score is sensitive to which class is positive, and which is negative. MCC isn’t. MCC vs F1 score —
  12. 19 True Positive Rate = TP TP + FN False

    Positive Rate = FP FP + TN ROC (Receiver Operating Characteristic) curve —
  13. 20 True Positive Rate = TP TP + FN False

    Positive Rate = FP FP + TN AUC AUC (Area Under Curve) —
  14. 21 Precision = TP TP + FP Recall = TP

    TP + FN Precision/Recall curve —
  15. 24 • Takes into account uncertainty of model predictions •

    Larger penalty for confident false predictions − 1 n n ∑ i=1 (yi log pi + (1 − yi )log(1 − pi )) where: N = number of observations y = in binary case, this is the true label (0 or 1) for an observation i p = the model's predicted probability that observation i is 1 Log loss —
  16. 25 True label Predicted prob. of class 1 Log loss

    1 0.9 0.105360515657 1 0.55 0.597837000755 1 0.10 2.302585092994 0 0.95 2.995732273553 Log loss —
  17. 28 Label Predicted cat cat cat cat cat cat cat

    cat dog dog dog dog dog cat bird dog bird bird Precision, Recall, F1 score —
  18. 29 Label Predicted cat cat cat cat cat cat cat

    cat dog dog dog dog dog cat bird dog bird bird Precision: micro-, macro-, weighted-average —
  19. 30 TP FP bird 1 0 cat 4 1 dog

    2 1 TOTAL 7 2 Precision: micro-, macro-, weighted-average —
  20. 31 TP FP Pr. N samples bird 1 0 1

    2 cat 4 1 0.8 4 dog 2 1 0.6666 3 TOTAL 7 2 macro pr = 1 3 (1 + 0.8 + 0.6666) = 0.8222 micro pr = 7 7 + 2 = 0.7777 weighted pr = 1 * 2 + 0.8 * 4 + 0.6666 * 3 2 + 4 + 3 = 0.8 Precision: micro-, macro-, weighted-average —
  21. 32 • Micro-averaged: all samples equally contribute to the average

    • Macro-averaged: all classes equally contribute to the average • Weighted-average: each classes’s contribution to the average is weighted by its size Micro-, macro-, weighted-averaged —
  22. 33 − 1 N N ∑ i=1 M ∑ j=1

    yij log pij Multi-class log loss —
  23. 35 • Indicates how well the model predictions approximate the

    true values • 1 = perfect fit vs 0 = DummyRegressor predicting average R squared (coefficient of determination) —
  24. 36 R2(y, ̂ y) = 1 − ∑n i=1 (yi

    − ̂ yi )2 ∑n i=1 (yi − ¯ y)2 R squared has an intuitive scale and doesn’t depend on y units R squared gives you no information about prediction error. y = actual values , ̂ y = predicted values , ¯ y = mean of the actual values R squared (coefficient of determination) —
  25. 37 MAE(y, ̂ y) = 1 n n ∑ i=1

    yi − ̂ yi MAE (mean absolute error) —
  26. 38 MSE(y, ̂ y) = 1 n n ∑ i=1

    (yi − ̂ yi )2 MSE (mean squared error) —
  27. 39 RMSE(y, ̂ y) = 1 n n ∑ i=1

    (yi − ̂ yi )2 RMSE (root mean squared error) —
  28. 40 • Range: 0 -> ∞ • MAE and RMSE

    have the same units as y values • Indifferent to the direction of the errors • The lower the metric value, the better What do MAE and RMSE have in common? —
  29. 41 • RMSE gives a relatively high weight to large

    errors • MAE is more robust to outliers • RMSE is differentiable MAE vs RMSE: what’s different? —
  30. 42 • Advantages of the mean absolute error (MAE) over

    the root mean square error (RMSE) in assessing average model performance, Cort J. Willmott, Kenji Matsuura, 2005 • Root mean square error (RMSE) or mean absolute error (MAE)?, Tianfeng Chai, R. R. Draxler, 2009 • Neither metric is robust on a small test set (<100) MAE vs RMSE —
  31. 43 RMSLE(y, ̂ y) = 1 n n ∑ i=1

    (loge (yi + 1) − loge ( ̂ yi + 1))2 • Similar to RMSE: uses natural logarithm of (y+1) instead of y • +1 because log of 0 is not defined • Shows relative error • Penalizes under-predicted estimate more than over-predicted RMSLE (root mean squared logarithmic error) —
  32. 44 MAPE (mean absolute percentage error) — MAPE(y, ̂ y)

    = 100 n n ∑ i=1 yi − ̂ yi yi • no sklearn implementation, you can write own function • Problematic: cannot be used if there are 0s as target values, and has issues with small target values
  33. 46 Any metric is only a proxy to what you

    really want to measure. Goodheart’s Law: “When a measure becomes a target, it ceases to be a good measure” Metrics can (and will) be gamed Warning(s)
  34. 47 There’s no “one fits all” evaluation metric Get to

    know your data Keep in mind business objective of your ML problem Apply common sense and invite domain experts Takeaways —
  35. Links, links, and more links: - scikit-learn User Guide -

    "Root mean square error (RMSE) or mean absolute error (MAE)?" by Tianfeng Chai, R. R. Draxler - Tip 8 from "Ten quick tips for machine learning in computational biology" - “Macro- and micro-averaged evaluation measures” by Vincent Van Asch - mkhalusova.github.io @mariakhalusova