Slides from my talk at ML4ALL:
"Choosing the right evaluation metric for your machine learning project is crucial, as it decides which model you’ll ultimately use. Those coming to ML from software development are often self-taught, but practice exercises and competitions generally dictate the evaluation metric. In a real-world scenario, how do you choose an appropriate metric? This talk will explore the important evaluation metrics used in regression and classification tasks, their pros and cons, and how to make a smart decision."
Links from the slides:
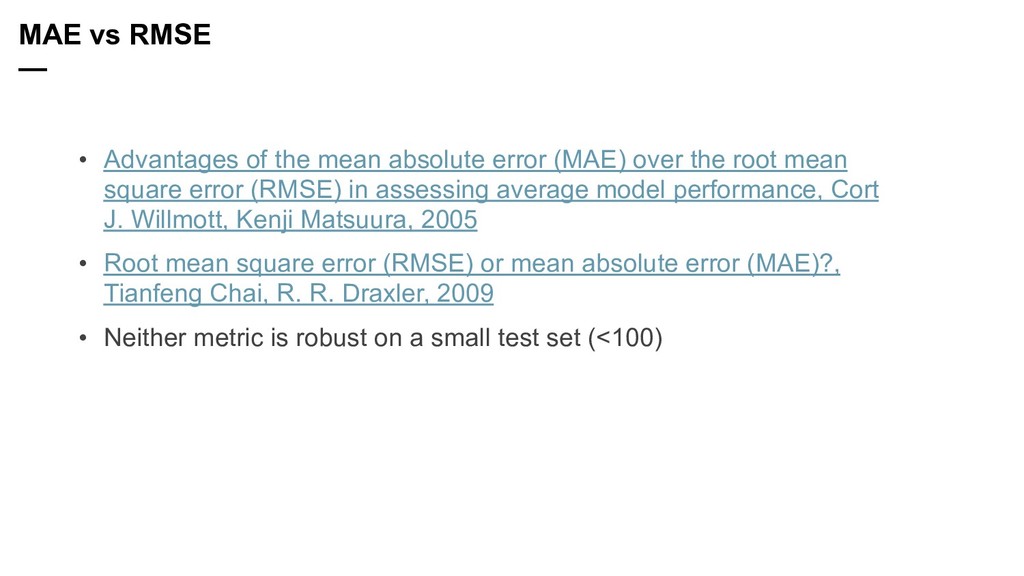
- Advantages of the mean absolute error (MAE) over the root mean square error (RMSE) in assessing average model performance, Cort J. Willmott, Kenji Matsuura, 2005: https://www.int-res.com/abstracts/cr/v30/n1/p79-82/
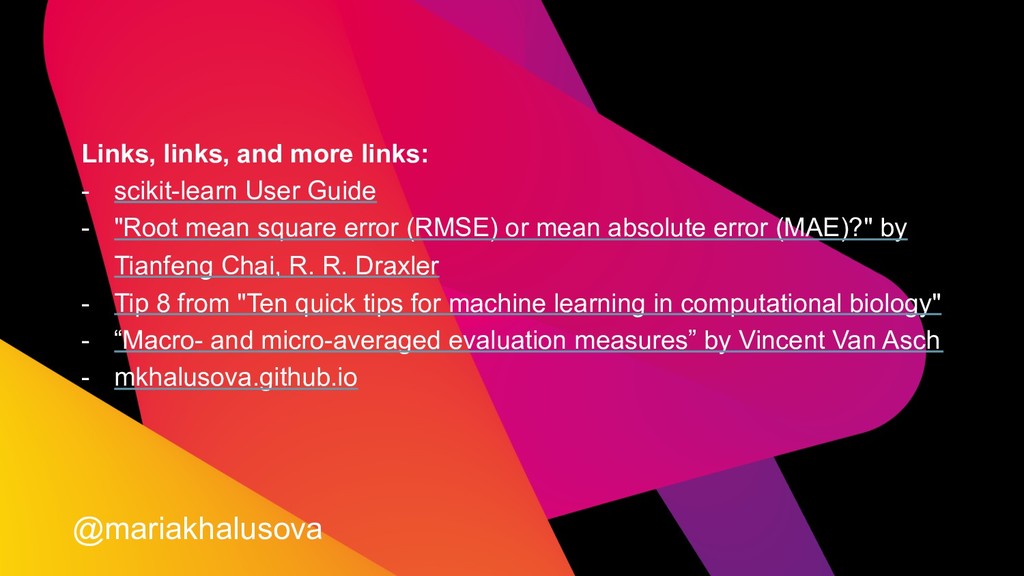
- Root mean square error (RMSE) or mean absolute error (MAE)?, Tianfeng Chai, R. R. Draxler, 2009: https://www.researchgate.net/publication/262980567_Root_mean_square_error_RMSE_or_mean_absolute_error_MAE
Recommended resources:
- scikit-learn User Guide: https://scikit-learn.org/stable/user_guide.html
- Tip 8 from "Ten quick tips for machine learning in computational biology": https://biodatamining.biomedcentral.com/articles/10.1186/s13040-017-0155-3
- “Macro- and micro-averaged evaluation measures” by Vincent Van Asch: https://pdfs.semanticscholar.org/1d10/6a2730801b6210a67f7622e4d192bb309303.pdf
Blog posts based on this talk:
- http://mkhalusova.github.io/blog/2019/04/11/ml-model-evaluation-metrics-p1
- http://mkhalusova.github.io/blog/2019/04/17/ml-model-evaluation-metrics-p2
- http://mkhalusova.github.io/blog/2019/04/17/ml-model-evaluation-metrics-p3