Upgrade to Pro — share decks privately, control downloads, hide ads and more …

MongoNYC 2012: Operational Best Practices

mongodb
June 21, 2012
230

MongoNYC 2012: Operational Best Practices

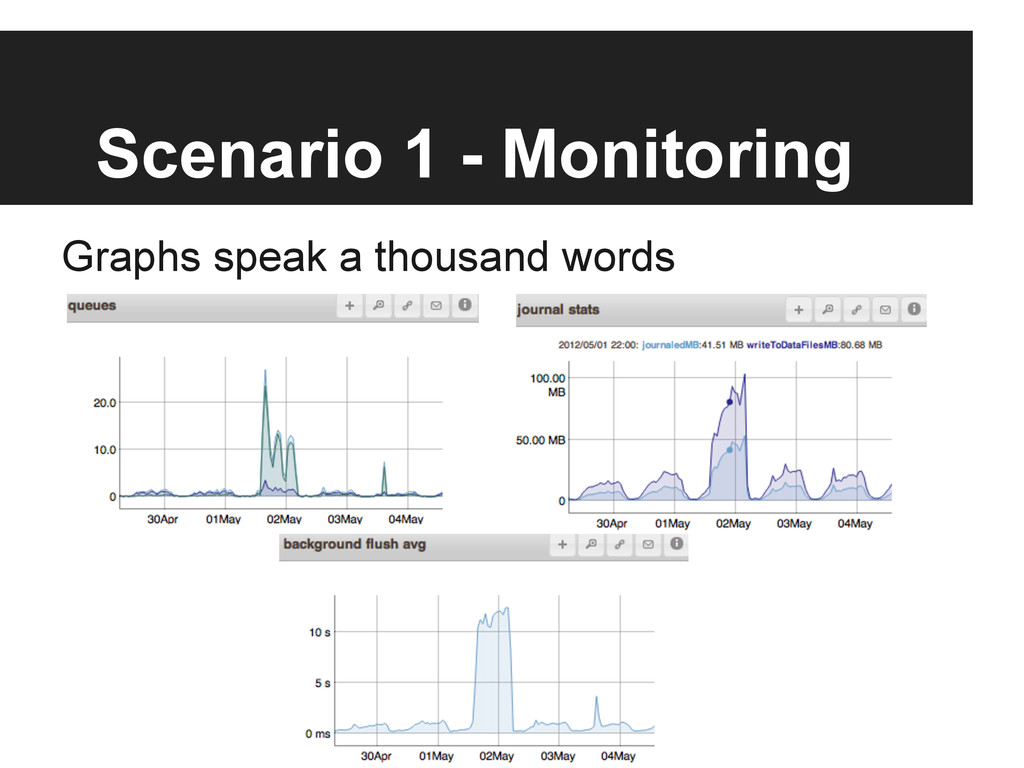
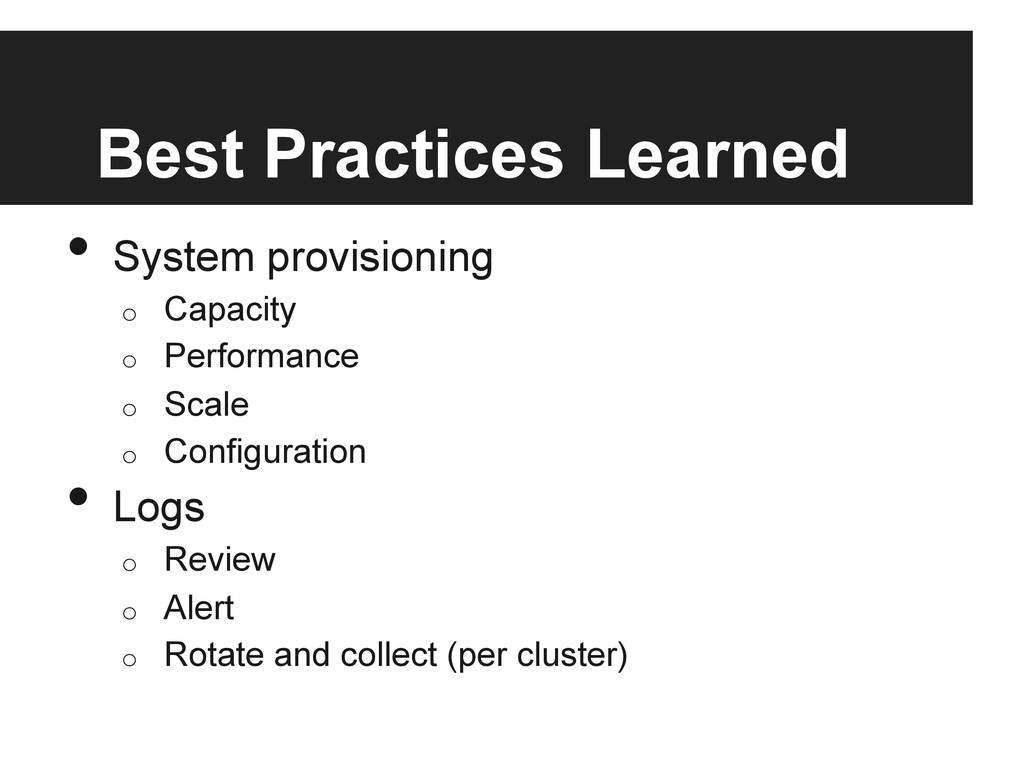
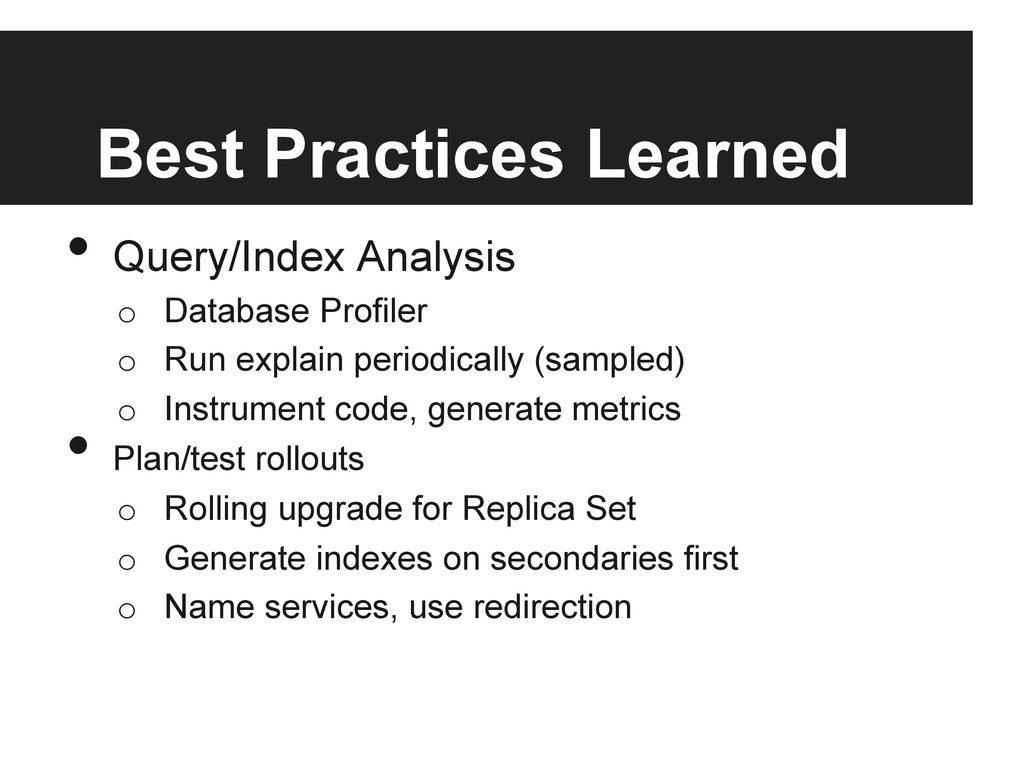
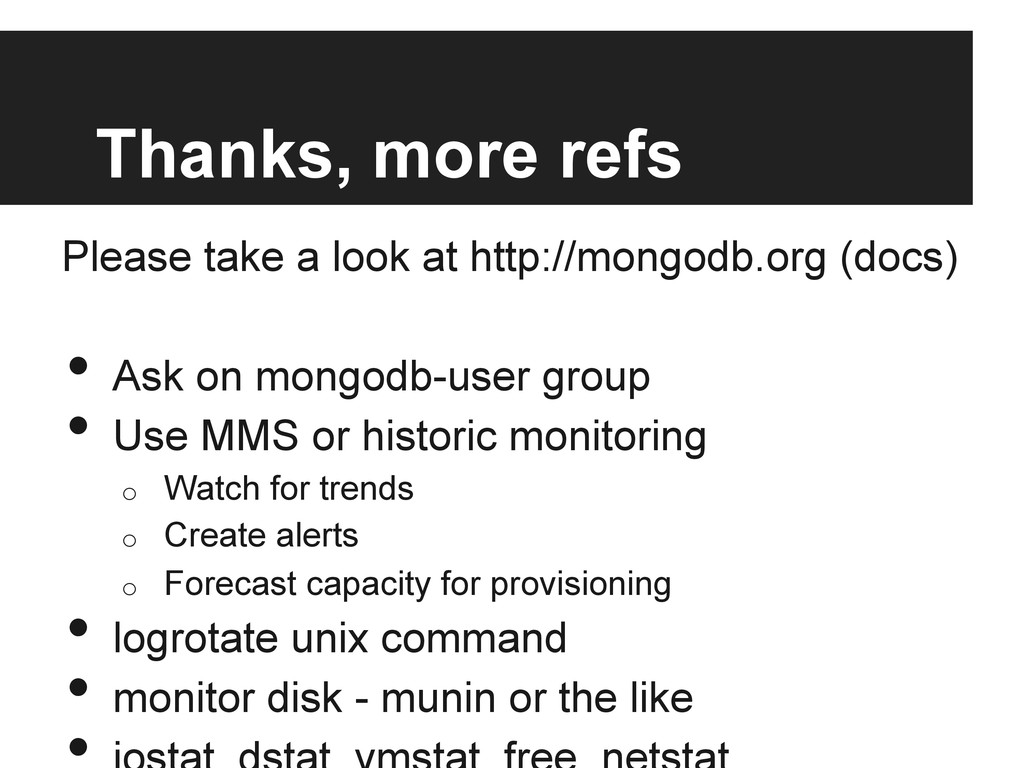
MongoNYC 2012: Operational Best Practices, Scott Hernandez, 10gen. In this session we’ll talk through a series of examples to distill some of our best operational practices. The format of this talk is an interactive and fun adventure through some real-world cases that come from real systems and large deployments. This session will touch on backups, network availability, performance pitfalls, indexing/schema-design, log management, monitoring and alerting along with some good examples of diagnostic techniques with a goal of finding good solutions.

mongodb

June 21, 2012
Tweet

Transcript

  1. The Plan •  Review support cases o  Taken from real

    issues o  Names/ips/dates changed to protect identities •  Analyze reported issues •  Distill best practices •  Summarize takeaways •  Repeat...
  2. Scenario 1 •  Fire, it is on fire! •  Users

    notice response time takes 1-3 sec •  App logs show timeouts •  Server log show socket exceptions
  3. Scenario 1 - Diagnostics •  Logs •  Understanding the timeouts

    o  Client read timeout set o  Connection closed/discarded o  Symptom not cause •  Server connection exceptions o  Match timing of client timeouts o  Symptom not cause
  4. Scenario 1 - Takeaways •  Monitor Logs o  Alert, escalate

    o  Correlate •  Disk o  Monitor o  Moved to RAID (10) •  Instrument/Monitor App •  Know your application and application (write) characteristics
  5. Scenario 2 •  Alerts warn that server is running hot

    •  Random (small) slowdowns •  Increased traffic/queries
  6. Scenario 2 - Diagnostics •  Turn on DB Profiling • 

    Look at logs Identify query patterns taking longest or with highest frequency and run explain
  7. Scenario 2 - Explain db.scenario2.find({...}).sort({...}).explain() { "cursor" : "BtreeCursor ABC",

    "nscanned" : 160677, "nscannedObjects" : 12015, "n" : 55, "millis" : 99, "scanAndOrder" : true, "indexBounds" : {...} }
  8. Scenario 2 - Diagnostics •  Create a compound index o 

    Used for criteria and sort o  Reduced CPU dramatically
  9. Scenario 2 - Takeaways •  Performance test/analyze system behavior • 

    Load test before deployment •  Alert on abnormal states •  High CPU is a sign of poorly indexed •  Rolling upgrade for indexes
  10. Scenario 3 - Diagnostics iostat Device: rrqm/s wrqm/s r/s w/s

    rsec/s wsec/s avgrq-sz avgqu-sz await svctm %util sdp 0.00 0.00 0.50 0.00 27.86 0.00 56.00 149.58 20320.00 2010.00 100.00
  11. Scenario 3 $ blockdev --report RO RA SSZ BSZ StartSec

    Size Device rw 8096 512 4048 0 1099494850560 /dev/ sdp Huge read-ahead of 4MB
  12. Scenario 3 - Takeaways •  Pay attention to disk configurations

    •  Load testing would have found this early •  MongoDB depends on the OS a lot •  Connect the dots from disportionate effects
  13. Best Practices Learned •  System provisioning o  Capacity o  Performance

    o  Scale o  Configuration •  Logs o  Review o  Alert o  Rotate and collect (per cluster)
  14. Best Practices Learned •  Query/Index Analysis o  Database Profiler o 

    Run explain periodically (sampled) o  Instrument code, generate metrics •  Plan/test rollouts o  Rolling upgrade for Replica Set o  Generate indexes on secondaries first o  Name services, use redirection
  15. Thanks, more refs Please take a look at http://mongodb.org (docs)

    •  Ask on mongodb-user group •  Use MMS or historic monitoring o  Watch for trends o  Create alerts o  Forecast capacity for provisioning •  logrotate unix command •  monitor disk - munin or the like